Do Visual and Haptic Cues Affect Taste?
Fang-Ping Chen
Department of Marketing and Logistics Management,
Chihlee University of Technology
E-mail: [email protected]
Hsiang Chen
Department of Business Administration,
National Taipei University
E-mail: [email protected]
Hsiao-Chi Hou
Kinmax Technology Inc.
E-mail: [email protected]
Wenchang Fang
Department of Business Administration,
National Taipei University
E-mail: [email protected]
ABSTRACT
suggest that haptic and visual cues affect quality evaluations, brand attitudes, and purchase intentions. In addition, visual cues and the autotelic need for touch moderate the relationship among haptic cues, quality evaluations, and brand attitudes. The results have implications for product and packaging designers, not only regarding material attributes but also on the visual presentation of products.
Keywords: Visual cues, Autotelic need for touch, Brand attitudes, Purchase intentions, Quality evaluation.
INTRODUCTION
Touch is a nearly irresistible urge for all human beings; yet, product touch has not been incorporated into the literature on marketing (Peck & Childers, 2006). Grohmann, Spangenberg, and Sprott (2007) indicate that touch is an essential proximity behavior that reflects both physical and psychological closeness (Andersen, 2008). The sense of touch is considered a crucial criterion for the evaluation of products that vary in their textual properties. Recently, marketing researchers have found that information obtained through physical touch plays a major role in consumer behavior (De Klerk & Lubbe, 2008; Dholakia et al., 2010; Cho & Workman, 2011; Kiang et al., 2011; Vieira, 2012; Chen et al,. 2013). For instance, Underhill (1999) reported almost all unplanned buying is a result of touching, hearing, smelling, or tasting something in a physical store. Peck and Childers (2006) suggested that individuals with a higher autotelic need for touch (NFT) purchased more products impulsively than did those with a lower autotelic NFT. In addition, for both higher and lower autotelic individuals, point-of-purchase signs, displays, and packaging encouraging product touch may increase impulse purchasing. Therefore, to have a persuasive influence on customer attitudes and behavior, customer must be provided with the opportunity to touch products (Peck & Wiggins, 2006). By contrast, barriers to touch can decrease confidence in product evaluations and increase the frustration level of consumers who are motivated to touch products (Peck & Childers, 2003b).
Krishna and Morrin (2008) clarify that nondiagnostic haptic cues mean those are not objectively relevant to the judgment task. For example, a beverage container which is feel delicate to the touch should not affect the actual taste or quality of the beverage itself; however, it would be considered a negatively valenced nondiagnostic haptic cue. Moreover, previous research has shown that irrelevant or nondiagnostic information can affect consumer judgments (Ackerman et al., 2010; Ilicic & Webster, 2013; Brasel & Gips, 2014). Some researchers may call it a placebo effect (Shiv et al., 2005). However, it still has remain largely unexplored on the impact of nondiagnostic cues in the domain of touch and the moderating effect of haptic orientation.
This study examined the effect of visual cues, specifically how different languages presented on product packaging affect consumer responses. Krishna and Morrin (2008) indicated that a perceptual transfer may occur within the context of other sensory processes. Humans rely heavily on visual information to explore the world. Visual cues generally serve people well, particularly when aligned with other sensory cues (Hoegg & Alba, 2007). Prior research has shown that visual cues affect consumer evaluations (Kennedy-Hagan et al., 2011; Guéguen et al., 2012; Meyvis et al. 2012; Van Doorn et al., 2017). For example, brand labels have been shown to influence preference substantially (Allison & Uhl, 1964; Hoyer & Brown, 1990; Aydinoğlu & Krishna, 2011). Participants sampling products with the same region (Ex: Japan) label perceived equal degrees of similarity, regardless of the true taste difference between two samples (Japanese and Chinese). In other words, the visual cues dominated the taste cue (Hoegg & Alba, 2007; Labrecque et al., 2013), and region images influenced consumer judgments (Koschate-Fischer et al., 2012; Herz & Diamantopoulos, 2017). In addition, concrete haptic written descriptions and visual depictions of products can partially enhance certain types of touch information (Peck & Childers, 2003b). However, the present study focused on the moderating role of language in product packaging. Consumers have different images in mind when products are made in different places and countries (Roth & Romeo, 1992). Some studies have reported that consumer evaluations of products are based on a country-of-origin image (Bilkey & Nes, 1982). For Taiwanese people, most consumers consider products from Japan to be of higher quality. Therefore, this framework examined how language differences in product packaging moderate taste judgments. Because packaging designs differ, consumers may make different evaluations on products that are otherwise identical in taste.
examine the relationships among haptic cues (hardness and texture), the autotelic NFT, and visual cues, individually. This study further examined the moderating role of visual cues and the autotelic NFT; haptic cues and taste effects are also discussed.
LITERATURE REVIEW Haptic Cues
Companies can benefit from customers who are allowed to touch products (Grohmann et al., 2007). Some research has shown that haptic input plays a crucial role in product evaluation (Peck & Childers, 2003a, 2003b; Krishna & Morrin, 2008; Tijssen, Zandstra, de Graaf, & Jager, 2017) and decision making, because it provides unique information that cannot be obtained through visual inspection alone (McCabe & Nowlis, 2003). In some instances, touch is the only choice for consumers to evaluate products. For example, the only way to accurately determine the texture, hardness, temperature, or weight of an object is to touch it (Klatzky & Lederman, 1992, 1993; Klatzky et al., 1993; Grohmann et al., 2007). Lederman and Klatzky (1987) also demonstrated that the haptic system is more efficient at assessing these four attributes, which they termed “material properties.”
When consumers evaluate products or services, they often search for diagnostic information on specific product benefits (Meyvis & Janiszewski, 2002). Although many studies have focused on products’ haptic input that is diagnostic, nondiagnostic haptic input may also affect the evaluation of products (Grohmann et al., 2007). Several studies on consumer behavior have demonstrated that objectively irrelevant product information can influence consumer decisions. For instance, Hoch and Ha (1986) observed that a nondiagnostic ambiguous product experience can increase the perceived quality of an advertised brand. Krishna and Morrin (2008) showed how product evaluation is affected by the nondiagnostic haptic qualities of the product’s packaging or serving container. Such cues can indeed affect product evaluation. Krishna and Morrin developed a haptic or touch-related characteristics conceptual framework about the perceptual transfer from product containers to judgments of the products themselves.
Therefore, on the basis of Krishna and Morrin (2008), the present research examined the impact of nondiagnostic haptic cues on consumer behavior. The nondiagnostic haptic cues investigated in this study are a natural part of the product consumption experience. People are not deliberately asked to touch the product, but feel the properties of the product unintentionally and consequently generate judgments.
Quality evaluation. Consumers use cues such as product characteristics, store images, brand names, and prices to differentiate among products and form impressions of their quality. Haptic inputs can also cause consumers to perceive product quality, such that the touching of a product can be an efficient way for consumers to assess intrinsic cues (Wheatley et al., 1981; Tijssen et al., 2017). Grohmann et al. (2007) suggested that haptic inputs positively affect the evaluation of products with attributes that are optimally explored by touch, particularly for high-quality levels. By contrast, when consumers simultaneously evaluate both high- and low-quality levels, haptic inputs negatively affect the product evaluations of low-quality products.
Although previous research has focused on products wherein haptic input is diagnostic, few studies have considered whether nondiagnostic haptic inputs affect the evaluation of products. McDaniel and Baker (1977) showed that sometimes lead to higher product quality evaluations is from a negative packaging attribute, because people perceived the chips in a hard-to-open package to be a crisper and fresher product. This suggests that packaging attributes affect the perceived taste or quality evaluation of the product itself. Moreover, Krishna and Morrin (2008) found that drinking water from bottles of varying hardness affected the perception of product quality. In other words, consumers perceived a higher quality when drinking water from a higher quality bottle. It suggests the vessel a beverage is served in could alter the consumer’s sensory perceptions of the beverage and impact the consumer’s attitude towards the product (Barnett, Velasco, and Spence, 2016; Cavazzana, Larsson, Hoffmann, Hummel, and Haehner, 2017; Van Doorn et al., 2017). Van Doorn et al. (2017) also proposed that they find out the associations between visual information and a product’s likely (or expected) sensory qualities. Therefore, the present study proposes that nondiagnostic haptic cues influence quality evaluations; that is, the touch characteristics of product containers may be transferred to the product itself through consumer judgment.
H1a: Haptic cues influence quality evaluations.
positive sensory feedback has been shown to improve attitudes, and was more persuasive than a touch element that provided negative sensory feedback (Peck & Wiggins, 2006). For example, high-NFT people exhibit a greater improvement in attitude when they touch a soft sweater that is pleasant to touch than when they touch a rough sweater that is unpleasant to touch (Peck 1999).
Krishna and Morrin (2008) showed that people enjoy feeling positively valenced nondiagnostic haptic cues, and that people like the feel of a firm cup more than that of a flimsy cup. Consequently, this study posits that different haptic cues influence attitudes toward the product.
H1b: Haptic cues influence brand attitudes.
Purchase intentions. Purchase intentions are personal action tendencies relating to the brand (Bagozzi et al., 1979; Ostrom, 1969). According to Spears and Singh (2004), purchase intentions are an individual’s conscious plan to make an effort to purchase a brand.
An affective or emotional response to the experience of touch has been found to have persuasive effects (Peck & Wiggins, 2006). The persuasive effect is composed of attitudes and purchase intentions. Thus, people who have a high autotelic NFT enjoy the experience of touch that affects their purchase intentions.
H1c: Haptic cues influence purchase intentions.
Haptic Orientation
NFT. Recent research has suggested that individual consumers differ in terms of their NFT or haptic orientation, which is conceptually defined as “a preference for the extraction and utilization of information obtained through the haptic system” (Peck & Childers, 2003a; Peck & Wiggins, 2006; Krishna & Morrin, 2008). Hence, for certain people, haptic information is constantly more prominent or conspicuous, and these haptically oriented people are more likely to use this information for product evaluations (Peck & Childers, 2003a, 2003b). For example, haptically motivated consumers are likely to be more frustrated when shopping if they do not have the opportunity to experience products directly, whereas they are more confident when they have the opportunity to touch the products (Peck & Childers, 2003b). According to prior research, the NFT is conceptualized as a construct with two underlying dimensions, instrumental and autotelic, each of which consists of six items (Peck & Childers, 2003a).
buying is by touching it (Krishna & Morrin, 2008). Instrumental judgments are expected to concentrate on haptic properties that relate to a product’s weight, temperature, hardness, or texture. For instance, picking up a cell phone and holding it to assess its weight and drawing a conclusion about its portability is an example of an instrumentally driven haptic product evaluation.
Consumers who are high in instrumental NFT collect information about the product through touching to help them evaluate the product and make judgments that they cannot gather through other means. For instance, people who are high in an instrumental NFT touch a sweater to confirm if the material is thick enough to offer warmth (Peck & Wiggins, 2006).
Autotelic NFT. The autotelic dimension of the NFT involves a hedonic-oriented response seeking fun, arousal, sensory stimulation, and enjoyment (Holbrook & Hirschman, 1982). Peck and Wiggins (2006) indicated that people with a high autotelic NFT enjoy touching because of its fun, interesting, and enjoyable experiences, which are more hedonic than instrumental. The autotelic NFT is not elicited by an unfulfilled demand but is rather preference driven and reflects compulsive and affective thoughts and feelings internal to an activity (Krishna & Morrin, 2008). In other words, such people consider that touching products can be fun; hence, when browsing in stores they enjoy touching many products. People who are high in autotelic NFT often feel an irresistible need to engage in exploratory touch and focus on touch as an end in itself.
Peck and Childers (2003a) suggested researchers could adopt either the one of the two subscales or composite NFT scale. Many researchers have used only the autotelic NFT scale to measure the NFT differences between individuals. For instance, individuals higher in the autotelic NFT purchased more impulsively than their lower autotelic NFT counterparts (Peck & Childers, 2006). In reviewing several studies, Peck and Wiggns (2006) found that for high autotelic NFT, the persuasion could be generally enhanced by a positively valenced touch element, improving attitudes and behavioral intentions.
nondiagnostic haptic input and focus their evaluations more on diagnostic information to the task. By contrast, because low autotelics are less practiced in processing haptic information, they expend greater resources to recall haptic-relevant event information from memory, and thus obtain available information from other channels. Although high autotelics generally enjoy touching objects in comparison with to low autotelics, they are less likely to be misled about product quality created by differences in nondiagnostic haptic input; less haptically oriented individuals are more likely to exhibit the impact of nondiagnostic haptic cues on product evaluations (Krishna & Morrin, 2008).
H2a: The autotelic NFT moderates the relationship between haptic cues and
quality evaluations.
H2b: The autotelic NFT moderates the relationship between haptic cues and
brand attitudes.
H2c: The autotelic NFT moderates the relationship between haptic cues and
purchase intentions.
Visual Cues
Haptic information is more costly than visual cues because customers must spend more physical energy to reach out and touch an object than to observe it visually (Jones & O’Neil, 1985). Therefore, information about products can be obtained through vision alone or through both the sense of touch and the sense of vision (McCabe & Nowlis, 2003). Messages that include haptic cues influence attitudes and behavior (Peck & Wiggins, 2006). Krishna and Morrin (2008) showed that nondiagnostic haptic cues that are verbally communicated affect the willingness to pay. These arguments suggest that visual cues may affect customer evaluations (Van Doorn et al., 2017).
Visual cues may affect consumer behavior, but this research focused on the moderating role of language in product packaging. The presentation of language does not express a haptic written description but stands for a certain country image. Various studies have addressed the number of country image dimensions reflected through consumer product quality evaluations (Crawford & Garland, 1988; Howard, 1989; Roth & Romeo ,1992; Martin & Eroglu, 1993; Van Doorn et al., 2017). Consumers develop different images when products are made in different places and countries (Roth & Romeo, 1992). An “image” represents the ideas, emotional background, and connotations associated with a concept (Nagashima, 1970).
experiment to examine the impact of country-of-origin cues on perceived quality, overall attitude, and purchase intentions. The results suggested that consumer perceptions of a product’s country of origin affected their perceptions of quality, their attitude, and their purchase intentions.
However, consumers generally have limited information about the country of origin of a brand. Gopinath and Glassman (2008) suggested that it would be worthwhile to examine whether consumers form perceptions of a product’s country of origin on the basis of the languages found on the packaging. Language is commonly associated with a country of origin. Since the 1960s, many researchers have indicated that the country of origin is a cue that consumers use to evaluate local and foreign products and brands. The origin of a language (local versus foreign) is one influential factor that could affect a person’s attention and comprehension of incoming information (Ahn & Ferle, 2008). For example, Liu, Li, and Murphy (2008) found that the country-of-origin effect was significant in wine evaluations in China. However, this effect was also moderated by the language used on labels. Therefore, this study posits that visual cues play a moderating role between haptic cues and taste effects.
H3a: Visual cues influence taste effects.
H3b: Visual cues moderate the relationship between haptic cues and quality
evaluations.
H3c: Visual cues moderate the relationship between haptic cues and brand
attitudes.
H3d: Visual cues moderate the relationship between haptic cues and purchase
intentions.
METHODOLOGY Overview
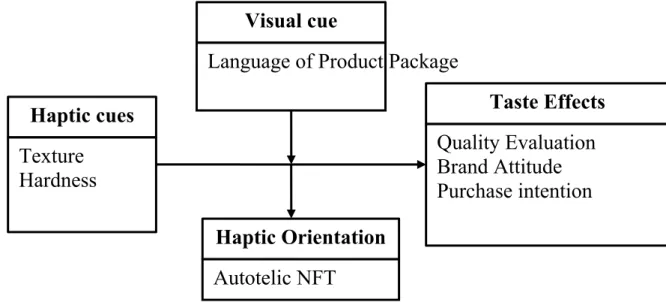
Two studies were conducted to examine the individual relationships between haptic cues, the autotelic NFT, visual cues, and taste effects. The first experiment tested whether high- or low-autotelic NFT consumers tended to incorporate haptic cues (texture vs. no texture) into their product evaluations. The second experiment examined whether haptic cues (hardness) influenced taste effects through the moderating role of the visual cues of different languages.
Haptic cues
Texture
Hardness
Quality Evaluation
Brand Attitude
Purchase intention
Taste Effects
Haptic Orientation
Autotelic NFT
Visual cue
Language of Product Package
perceptions and evaluations (Krishna & Morrin, 2008). Although the four material properties—texture, hardness, temperature, and weight—probably encourage product touch (Peck & Childers, 2003a; Lederman & Klatzky, 1987), varying the temperature and the weight of the packaging could affect the product itself. Therefore, this study investigated only the texture and hardness attributes.
Figure 1 Research Structure
Measures
Independent variables
The autotelic NFT is measured using multiple six-item perceptual scales from Peck and Childers (2003a) and indicates the degree to which people correspond to the sensational aspects about touching products; it involves hedonics and irresistible needs to engage in exploring through touching but with no purchase goal. Each response is measured on a Likert-type scale ranging from 1 (strongly disagree), to 4 (neutral), and to 7 (strongly agree). High- and low-autotelic NFT participants were divided according to a median split on the mean of the six items.
Dependent variables
Quality evaluations. This study modified the multiitem quality scales derived from Dodds et al. (1991) and Jang and Namkung (2009). Two items were deleted because they were not suitable for our study context or product: “the restaurant offers healthy options,” and “this product would seem to be durable.” In total, seven items were acquired. Each item on quality was measured using a 7-point scale.
used five 7-point items for brand attitudes: from unappealing to appealing, bad to good, unpleasant to pleasant, unfavorable to favorable, and unlikable to likable.
Purchase intentions. This research also used five-item scales from Spears and Singh (2004) to measure purchase intentions. Spears and Singh reduced 15 distinct items on purchase intentions to five through exploratory and confirmatory factor analysis. We used the following five 7-point items for purchase intentions: from never to definitely, definitely do not intend to buy to definitely intend to buy, very low purchase interest to high purchase interest, definitely will not buy it to definitely will buy it, will probably not buy it to will probably buy it.
Control variables
We controlled for three variables that fell outside the discussion of this study yet might have influenced quality evaluations, brand attitudes, and purchase intentions: gender, age, and preference for products. Wolin (2003) indicated that men and women process information differently. Kempf, Laczniak, and Smith (2006) described that women are more impressionable to the comprehensiveness of experimental information, knowing the manipulated differences in an experiment. Evanschitzky and Woisetschläger (2008) showed the impact of age as well as age-related constructs on relevant consumer attitudes and behavior. In addition, preferences toward a product may influence a participant’s judgment. Arias-Bolzmann, Chakraborty, and Mowen (2000) argued that prior product category attitudes (e.g., favorable or unfavorable) could affect consumer information processing. Thus, product preferences were considered in this experiment.
Pretest
We conducted a pretest to confirm the types of cups to be used in the studies. The participants were 60 graduate students, divided into two groups. One group was asked to touch a firm plastic cup and a paper cup with texture. The other group was asked to touch a flimsy plastic cup and a paper cup with no texture. The two types of plastic cups were of the same size and shape. They were both transparent and had no designs. The key difference between the plastic cups was the degree of hardness; one cup was made of polystyrene, and the other was made of polyethylene terephthalate. The paper cups were also of the same size, shape, and design. The major difference between the paper cups was the presence or absence of texture.
(M = 5.10) was significantly higher than that of the flimsy cup (M = 4.13; t [1, 58] = 3.45, p = .001). The perceived quality of the paper cup with texture (M = 5.63) was significantly higher than that of the paper cup with no texture (M = 3.73; t [1, 58] = 6.31, p < .000).
Study 1: Do Texture Cues Affect Taste?
Study 1 was conducted to test the taste of 3-in-1 hot chocolate as the stimulus. The participants were tasked to evaluate the attitude, purchase intentions, and quality of a single hot chocolate sample. This study manipulated haptic cues by asking the participants to touch two distinct product containers: a paper cup with texture, and a paper cup without texture.
All the participants were served the same hot chocolate product in a cup, but half the participants were offered the cup with texture, whereas the other half were offered the cup without texture. Our hypothesis was that haptic cues would influence quality evaluations, brand attitudes, and purchase intentions. We also hypothesized that haptic cues and the autotelic NFT would exert an interaction effect on quality evaluations, brand attitudes, and purchase intentions.
Design
The participants were 75 undergraduate students in Northern Taiwan. The experiment used a two (texture vs. no texture) × two (levels of autotelic NFT: high or low) full factorial, between-subjects design. The autotelic dimension of the NFT was expected to be the more relevant dimension for our purposes (Peck & Childers, 2003a). A median split on the mean of the six items of the autotelic dimension of Peck and Childers’ (2003a) NFT scale was used to categorize the participants as either high or low on the autotelic dimension of haptic orientation (Peck & Childers, 2003a; Peck & Wiggins, 2006; Krishna & Morrin, 2008). The median was 4.83 on a seven-point scale.
Methods
All the participants took part in the hot chocolate taste test at the same time. Hot water was added in advance into each cup and stirred well. Each cup was covered with a lid so that the participants could not see the contents. Therefore, we assessed the taste effects of nondiagnostic haptic cues without the moderation of vision. Thus, the feel of the container in the hand was the only haptic characteristic that could potentially affect consumer evaluations. After drinking the hot chocolate, the participants were asked to fill out the questionnaire about haptic orientation, attitude, purchase intentions, the quality of the beverage, and demographics.
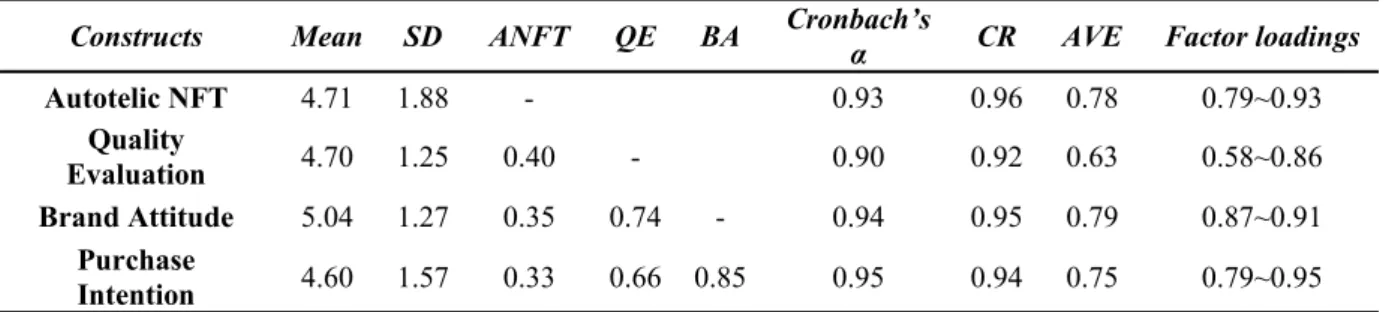
Table 1 list the descriptive statistics, reliability and validity values for Study 1. All calculations were performed using SPSS and LISREL. The Cronbach’s α and composite reliabilities (CR) in Study 1 for the autotelic NFT, quality evaluations, brand attitudes, and purchase intentions, all values exceeded the 0.7 criteria, indicating that the measurements had high reliability (Fornell & Larcker, 1981; Nunnally, 1978). The present study generated these measures from major academic journals, which indicates their content validity. Table 1 also show that the correlation of paired constructs is significantly less than 1, and average variances extracted (AVE) exceeded the threshold level (0.5) which indicates discriminate validity as suggested by Bagozzi, Yi, and Phillips (1991) and Segars and Grover (1998).
Table 1. Reliability, Validity, and Descriptive Statistics in Study One
Constructs Mean SD ANFT QE BA Cronbach’sα CR AVE Factor loadings
Autotelic NFT 4.71 1.88 - 0.93 0.96 0.78 0.79~0.93 Quality
Evaluation 4.70 1.25 0.40 - 0.90 0.92 0.63 0.58~0.86 Brand Attitude 5.04 1.27 0.35 0.74 - 0.94 0.95 0.79 0.87~0.91
Purchase
Intention 4.60 1.57 0.33 0.66 0.85 0.95 0.94 0.75 0.79~0.95
Note: 1. All differences from unity were statistically significant at p< 0.05.
2. SD: standard deviation; ANFT: Autotelic NFT; QE: Quality Evaluation; BA: Brand Attitude.
Results and Analysis
Control Variable Analysis
Three control variable – age, gender and preference were discussed in this study. The distribution of these control variables in Study 1 is shown in Table 2. Most of the participants were approximately 20–21 years old, and 58.7% were female. Results show that no significant difference exists between male and female on quality evaluation, brand attitude, and purchase intention, but the preference was significant (Table 3, 4, 5).
Table 2. Subjects Age Distribute and Gender Distribute
Age Subjects Percentage
20~21 72 99.0%
other 3 1.0%
Gender Subjects Percentage
Male 31 41.3%
Female 44 58.7%
ANOVA was individually conducted on the quality evaluations, brand attitudes, and purchase intentions for the cup of hot chocolate as the dependent variables, and the haptic cues (texture vs. no texture) and autotelic NFT (high vs. low autotelic) as the independent variables. Gender and preference were used as control variables, although only preference was significant.
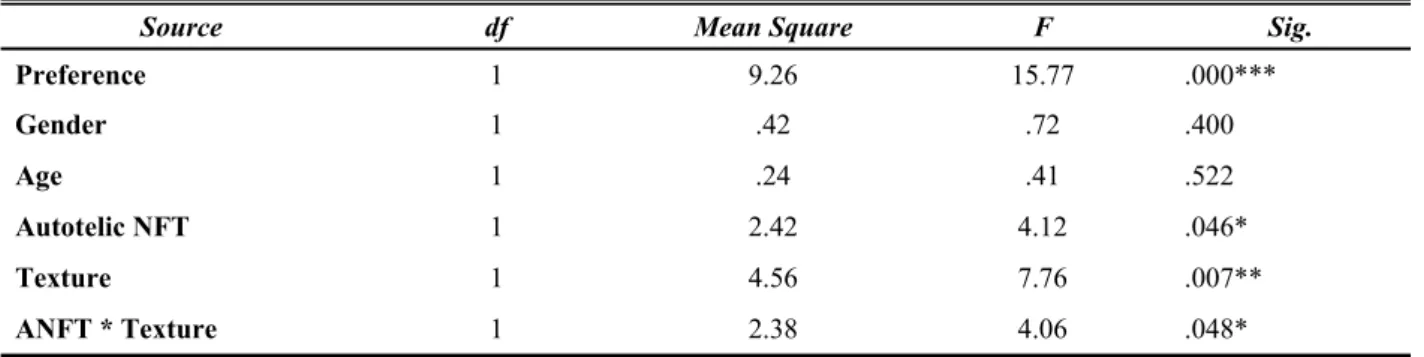
Quality Evaluations.There was a main effect of haptic cues (F [1, 68] = 7.76, p < .01), with texture obtaining a higher quality evaluation than no texture (Mtexture = 4.95 vs. Mno texture = 4.44). A main effect was also observed from the autotelic NFT (F [1, 68] = 4.12, p < .05), with a high autotelic NFT providing a higher mean quality evaluation than a low autotelic NFT (Mhigh autotelic NFT = 4.96 vs. Mlow autotelic NFT = 4.50). Both these effects were significant, and the interaction between these two variables was also significant (F [1, 68] = 4.06, p < .05; Table 3).
Table 3. ANOVA Result of Quality Evaluation Dependent Variable: Quality Evaluation
Source df Mean Square F Sig.
Preference 1 9.26 15.77 .000***
Gender 1 .42 .72 .400
Age 1 .24 .41 .522
Autotelic NFT 1 2.42 4.12 .046*
Texture 1 4.56 7.76 .007**
ANFT * Texture 1 2.38 4.06 .048*
Note: *p<0.05, **p<0.01, ***p<0.001
Brand Attitudes. There was a main effect of haptic cues (F [1, 68] = 5.75, p < .05), with texture obtaining a higher brand attitude than no texture (Mtexture = 5.27 vs. Mno texture = 4.79). A main effect was also observed from the autotelic NFT (F [1, 68] = 7.02, p < .01), with a high autotelic NFT providing a higher mean brand attitude than a low autotelic NFT (Mhigh autotelic NFT = 5.39 vs. Mlow autotelic NFT = 4.76). Both these effects were significant, and the interaction between haptic cues and the autotelic NFT was also significant (F [1, 68] = 4.02, p < .05; Table 4).
Table 4. ANOVA Result of Brand Attitude Dependent Variable: Brand Attitude
Source df Mean Square F Sig.
Prefer 1 16.66 23.51 .000***
Gender 1 1.21 1.71 .196
Age 1 .19 .27 .608
Texture 1 4.08 5.75 .019*
ANFT * Texture 1 2.85 4.02 .049*
Note: *p<0.05, **p<0.01, ***p<0.001
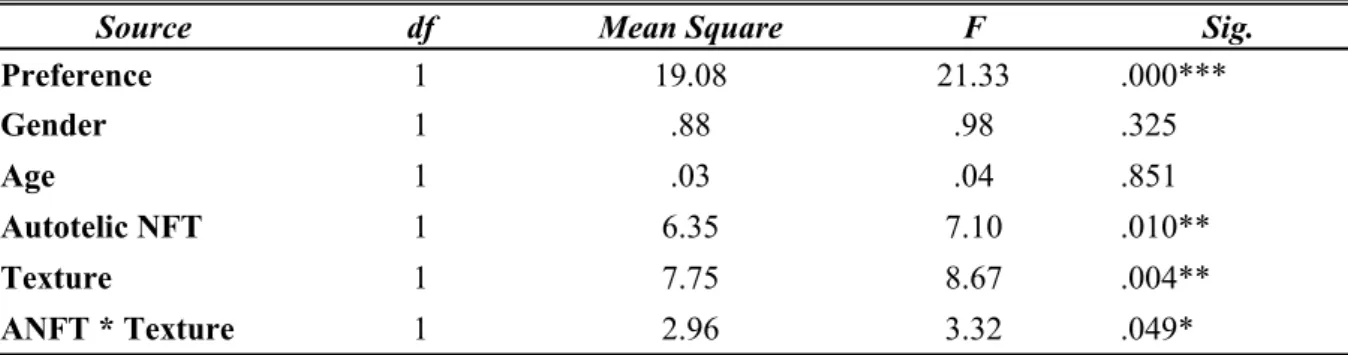
Purchase Intentions. There was a main effect of haptic cues (F [1, 68] = 8.67, p < .01), with texture obtaining a higher purchase intention than no texture (Mtexture = 4.91 vs. Mno texture = 4.26). A main effect was also observed from the autotelic NFT (F [1, 68] = 7.10, p < .01), with a high autotelic NFT providing a higher mean purchase intention than a low autotelic NFT (Mhigh autotelic NFT = 5.00 vs. Mlow autotelic NFT = 4.28). Both these effects were significant, and the interaction between these two variables was marginally significant (F [1, 68] = 3.32, p < .05; Table 5).
Table 5. ANOVA Result of Purchase Intention Dependent Variable: Purchase Intention
Source df Mean Square F Sig.
Preference 1 19.08 21.33 .000***
Gender 1 .88 .98 .325
Age 1 .03 .04 .851
Autotelic NFT 1 6.35 7.10 .010**
Texture 1 7.75 8.67 .004**
ANFT * Texture 1 2.96 3.32 .049*
Note: *p<0.05, **p<0.01, ***p<0.001
Study 2: Do Hardness Cues Affect Taste and Do Visual Cues Have Moderating Effects? The purpose of Study 2 was to test H1–H3, pertaining to the interaction among haptic cues, visual cues, and taste effects. The participants were tasked to evaluate their own attitudes, purchase intentions, and the quality of a single orange juice sample. This study manipulated haptic cues by asking the participants to touch two distinct product containers: a firm plastic cup and a flimsy plastic cup. To prevent the participants from having previous impressions, two distinct language labels were affixed to the cup as a visual cue.
Each participant was offered the same orange juice product in a cup; half took the firm cup with Japanese or Chinese, and the other half took the flimsy cup with Japanese or Chinese. This study examined the impact of hardness haptic cues on taste effects, moderated by visual cues.
Design
as high or low autotelics according to the autotelic scale (the median on the seven-point scale was 4.92).
Methods
Labels were affixed to both the firm and flimsy cups in advance. The labels were designed in two languages, each version containing a product name, pictures, and a slogan. They were identical except for the language, which was either Japanese or Chinese. The slogan described the orange juice as “absolutely fresh,” “natural” and “delicious”. Before the experiment, the orange juice was poured into each cup.
The four samples were tested in four different classrooms in the same university simultaneously. Each participant was served a cup of juice. This study aimed to limit the haptic input to that which was not diagnostic to judgment. We assessed the impact of haptic cues and not the taste (or feel) of the lip of the cup, which could arguably affect the perceived taste of the orange juice. Hence, all the participants were asked to drink the juice through a straw. This study replicated the method from Krishna and Morrin (2008) to ensure that our experimental procedure was accurate. After drinking the orange juice, the participants completed the survey about haptic orientation, attitudes, purchase intentions, the quality of the product, and demographics.
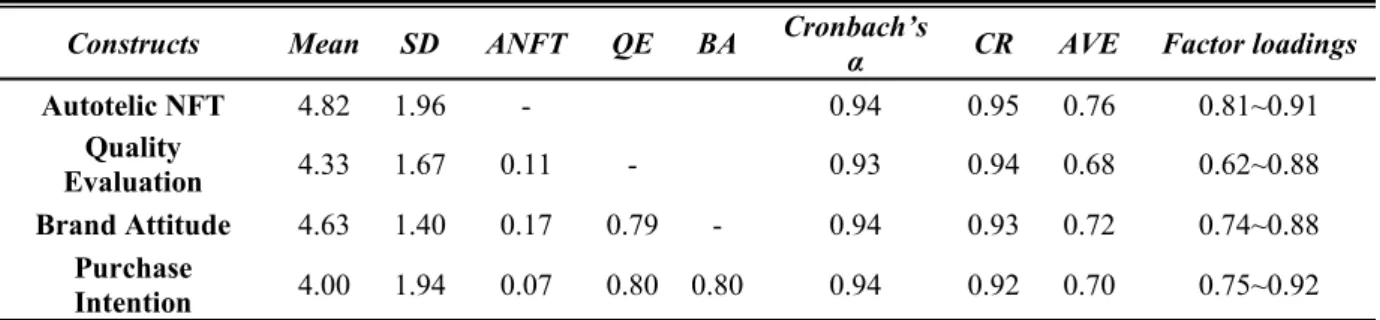
Reliability, Validity, and Descriptive Statistics
Table 6 shows that all the values exceed the threshold level.
Table 6. Reliability, Validity, and Descriptive Statistics in Study Two
Constructs Mean SD ANFT QE BA Cronbach’sα CR AVE Factor loadings
Autotelic NFT 4.82 1.96 - 0.94 0.95 0.76 0.81~0.91 Quality
Evaluation 4.33 1.67 0.11 - 0.93 0.94 0.68 0.62~0.88 Brand Attitude 4.63 1.40 0.17 0.79 - 0.94 0.93 0.72 0.74~0.88
Purchase
Intention 4.00 1.94 0.07 0.80 0.80 0.94 0.92 0.70 0.75~0.92 Note: 1. All differences from unity were statistically significant at p< 0.05.
2. SD: standard deviation; ANFT: Autotelic NFT; QE: Quality Evaluation; BA: Brand Attitude
Results and Analysis
Control Variable Analysis
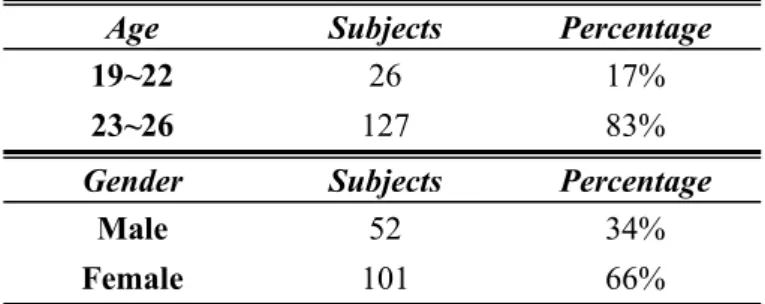
Three control variables, age, gender, and preferences, were included in this study. The distribution of these control variables for Study 2 is shown in Table 7. Most (83.0%) of the respondents were 23–26 years old, and 66.0% were female. The results show that there was no significant difference between men and women in quality evaluations, brand attitudes, and purchase intentions; however, preference was significant. (Table 8, 9, 10)
Age Subjects Percentage
19~22 26 17%
23~26 127 83%
Gender Subjects Percentage
Male 52 34%
Female 101 66%
Results
We also individually conducted an ANOVA on the quality evaluation, brand attitude, and purchase intention for orange juice as the dependent variables; and haptic cues (firm vs. flimsy), autotelic NFT (high vs. low autotelic), and language (Chinese vs. Japanese) as the independent variables; gender, age, and preference were the covariates.
Quality Evaluations. There was a significant main effect of haptic cues (F [1, 144] = 23.47, p < .001), with a firm haptic cue providing a higher mean for quality evaluations (M firm = 4.76 vs. M flimsy = 3.92). There was also a significant main effect of language (F [1,144] = 5.52, p < .05), with the participants perceiving the language of package quality to be higher if it was Japanese rather than Chinese (MJapanese = 4.52 vs. MChinese = 4.21). In addition, the results show that the interaction effects between the autotelic NFT and haptic cues (F [1,144] = 3.91, p < .05) and between hardness and language (F [1,144] = 4.07, p < .05) were significant (Table 8).
Table 8 ANOVA Result of Quality Evaluation Dependent Variable: Quality Evaluation
Source df Mean Square F Sig.
Preference 1 14.94 16.69 .000***
Autotelic NFT 1 1.70 1.90 .170
Hardness 1 21.01 23.47 .000***
Gender 1 .98 1.08 .625
Age 1 .08 .05 .951
Language 1 4.94 5.52 .020*
ANFT * Hardness 1 3.50 3.91 .050*
Hardness * Language 1 4.07 4.55 .035*
Note: *p<0.05, **p<0.01, ***p<0.001
Table 9. ANOVA Result of Brand Attitude Dependent Variable: Brand Attitude
Source df Mean Square F Sig.
Preference 1 23.72 30.41 .000***
Autotelic NFT 1 3.47 4.44 .037*
Hardness 1 24.15 30.96 .000***
Gender 1 1.51 1.50 .295
Age 1 .25 .38 .970
Language 1 4.96 6.35 .013*
ANFT * Hardness 1 3.19 4.09 .045*
Hardness * Language 1 3.28 4.20 .042*
Note: *p<0.05, **p<0.01, ***p<0.001
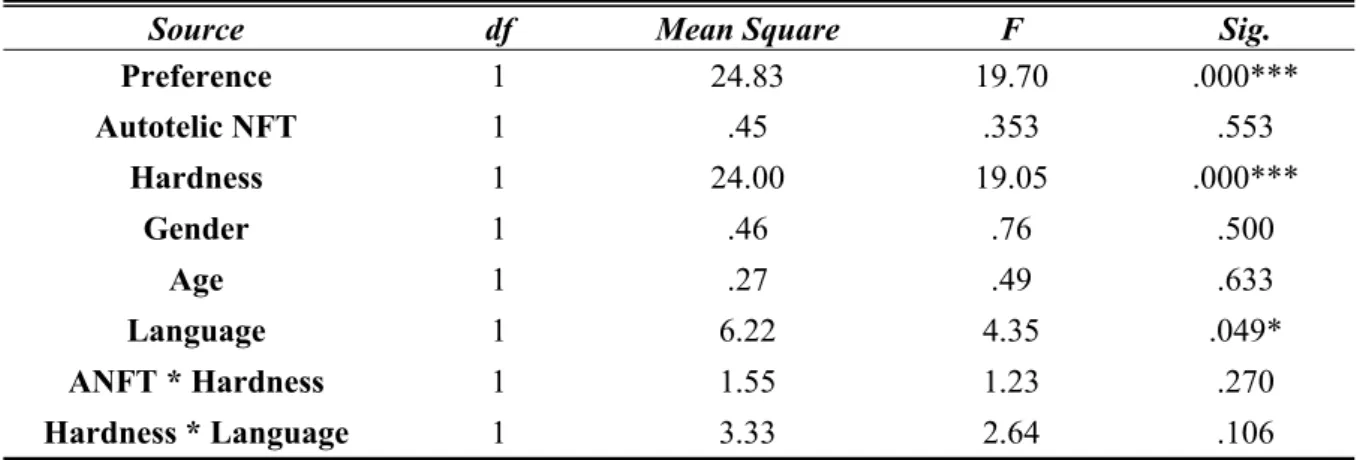
Purchase Intentions. There was a significant main effect of haptic cues (F [1, 144] = 19.05, p < .001), with a firm haptic cue providing a higher mean for purchase intentions (Mfirm = 4.46 vs. Mflimsy = 3.56). There was a marginally significant main effect of language (F [1,144] = 4.35, p < .05), with the participants showing a higher purchase intention when the language on the package was Japanese rather than Chinese (MJapanese = 4.18 vs. MChinese = 3.88). However, the autotelic NFT did not significantly affect purchase intentions (p > .05). The results show that the interactions between the autotelic NFT and haptic cues and between hardness and language were not significant (Table 10).
Table 10. ANOVA Result of Purchase Intention Dependent Variable: Purchase Intention
Source df Mean Square F Sig.
Preference 1 24.83 19.70 .000***
Autotelic NFT 1 .45 .353 .553
Hardness 1 24.00 19.05 .000***
Gender 1 .46 .76 .500
Age 1 .27 .49 .633
Language 1 6.22 4.35 .049*
ANFT * Hardness 1 1.55 1.23 .270
Hardness * Language 1 3.33 2.64 .106
Note: *p<0.05, **p<0.01, ***p<0.001
DISCUSSION AND CONCLUSION Findings
texture compared to cups with no texture. In Study 2, the participants preferred firm cups to flimsy cups. Study 2 also showed that the visual cue of language in packaging products influences quality evaluations, brand attitudes, and purchase intentions. The Japanese packaging acquired a higher quality evaluation and brand attitude than the Chinese packaging did. However, the autotelic NFT significantly affected brand attitudes, with a higher mean for the high autotelic NFT than for the low autotelic NFT. The results of Study 2 further suggest that visual cues significantly moderate the relationship among haptic cues, quality evaluations, and brand attitudes. The interaction effect between haptic cues and the autotelic NFT is also significant. Prior research has suggested that the autotelic NFT plays a moderating role among haptic input, product quality, and the willingness to pay a certain price (Krishna & Morrin, 2008). Thus, the results of the present study are consistent with previous research. In summary, H1a, H1b, H1c, H2a, and H2b are supported, and H2c is partially supported. In addition, H3a, H3b, and H3c are supported, but H3d is not supported.
Implications
This paper makes several contributions to managerial practices. First, many firms spend millions of dollars on disposable cups and bottles each year (Krishna & Morrin, 2008). If these firms want to save on costs by providing haptically inferior containers, it could influence consumer perceptions of the taste or quality of the product, producing negative evaluations of these companies or products. By contrast, consumers may think that a product served in a haptically superior container is of higher quality, producing positive attitudes and purchase behaviors.
Furthermore, manufacturers must carefully design their product packaging. Language may produce an exotic atmosphere that affects consumer perceptions of a product (Herz, & Diamantopoulos, 2017). Consumers have limited information about the country of origin of a brand; therefore, they may form perceptions of the product’s country of origin according to the language found on the packaging (Gopinath & Glassman, 2008; Herz, & Diamantopoulos, 2017). However, people associate different languages with different images and feelings of a country; therefore, manufacturers should choose languages carefully. To attract consumers and leave a favorable impression of products, manufacturers could take advantage of language to design advertisements, descriptions, and slogans in offline and online retailers.
Limitations and directions for future research
conducted the study was not practical, and the purchasing environment might have influenced the results. Further research could analyze more interaction effects, and the effect of various purchasing environments such as supermarkets, malls, or restaurants should be concerned. Second, the study participants were students. Future studies could analyze other groups with different ages or occupations. Third, the participants perceived different languages through the product’s packaging. Future research could express related information through other ways, such as descriptions or advertisements.
In recent years, the public has placed an emphasis on environmental issues. If firms manufacture thinner containers as a green design purporting that “thinner is better,” then the flimsy haptic cue may be associated with positive evaluations (Krishna & Morrin, 2008). Therefore, future research could analyze the moderating effect of green verbal cues on the relationship between haptic cues and consumer behavior. In addition to the material of the container, the shape of the packaging may affect haptic or vision cues, and thus influence product evaluations. For example, consumers may prefer tall and thin bottles to short and fat bottles, thus affecting product evaluations.
ACKNOWLEDGMENT
The authors acknowledge the financial support provided by the Ministry of Science and Technology, R.O.C. (97-2410-H-305-050-MY2), project name: Virtual Spokes-Characters: The Effect of Spokes-Characters Type upon On-Line Advertising.
REFERENCES
Ackerman, J.M., Nocera, C.C. & Bargh, J.A., (2010). Incidental haptic sensations influence social judgments and decisions. Science, 328(5986), 1712-1715. https://doi.org/10.1126/science.1189993
Ahn, J. & Ferle, C. L. (2008). Enhancing recall and recognition for brand names and body copy. Journal of Advertising, 37(3), 107-117. https://doi.org/10.2753/joa0091-3367370308
Allison, R. I., & Uhl, K. P. (1964). Influence of beer brand identification on taste perception. Journal of Marketing Research, 1(3), 36-39.
https://doi.org/10.2307/3150054
Andersen, P. A. (2008). Nonverbal communication: Forms and functions, 2nd Edition,
Argo, J. J., Dahl, D. W., & Morales, A. C. (2006). Consumer contamination: How consumers react to products touched by others. Journal of Marketing, 70(2), 81-94. https://doi.org/10.1509/jmkg.70.2.81
Arias-Bolzmann, L., Chakraborty, G., & Mowen, J. C. (2000). Effects of absurdity in advertising: The moderating role of product category attitude and the mediating role of cognitive Responses. Journal of Advertising, 29(1), 5-49.
https://doi.org/10.1080/00913367.2000.10673602
Aydinoğlu, N. Z., & Krishna, A. (2011). Guiltless gluttony: The asymmetric effect of size labels on size perceptions and consumption. Journal of Consumer Research,
37(6), 1095-1112. https://doi.org/10.1086/657557
Bagozzi, R. P., Tybout, A. M., Craig, C. S., & Sternthal, B. (1979). The construct validity of tripartite classification of attitudes. Journal of Marketing Research,
16(1), 88-95. https://doi.org/10.1177/002224377901600113
Bagozzi, R. P., Yi, Y., & Phillips, L. W. (1991). Assessing construct validity in organizational research. Administrative Science Quarterly, 36(3), 421-458. https://doi.org/10.2307/2393203
Barnett, A., Velasco, C., & Spence, C. (2016) Bottled vs. canned beer: Do they really taste different?. Beverages, 2(4), 1-25. https://doi.org/10.3390/beverages2040025 Bilkey, W. J., & Nes, E. (1982). Country-of-origin effects on product evaluations.
Journal of International Business Studies, 13(1), 89-99. Retrieved from http://www.jstor.org/stable/154256
Brasel, S. A., & Gips, J. (2014). Tablets, touchscreens, and touchpads: How varying touch interfaces trigger psychological ownership and endowment. Journal of Consumer Psychology, 24(2), 226-233. https://doi.org/10.1016/j.jcps.2013.10.003 Cavazzana, A., Larsson, M., Hoffmann, E., Hummel, T., & Haehner, A. (2017). The
vessel’s shape influences the smell and taste of cola. Food quality and preference,
59, 8-13. https://doi.org/10.1016/j.foodqual.2017.01.014
Chen, S. J., Lin, C. L., & Chien, C. W. (2013). The influence of the nature of need for touch, handcraft material and material color on the motivation for touch. In Cross-Cultural Design. Methods, Practice, and Case Studies, 8023, 281-287. Springer Berlin Heidelberg. https://doi.org/10.1007/978-3-642-39143-9_31
Cho, S., & Workman, J. (2011). Gender, fashion innovativeness and opinion leadership, and need for touch: Effects on multi-channel choice and touch/non-touch preference in clothing shopping. Journal of Fashion Marketing and Management, 15(3), 363-382. https://doi.org/10.1108/13612021111151941
Crawford, J. C., & Garland, B. C. (1988). German and American perceptions of product quality. Journal of International Consumer Marketing,1(1), 63-78.
De Klerk, H. M., & Lubbe, S. (2008). Female consumers’ evaluation of apparel quality: Exploring the importance of aesthetics. Journal of Fashion Marketing and Management, 12(1), 36-50. https://doi.org/10.1108/13612020810857934
Dholakia, U. M., Kahn, B. E., Reeves, R., Rindfleisch, A., Stewart, D., & Taylor, E. (2010). Consumer behavior in a multichannel, multimedia retailing environment.
Journal of Interactive Marketing, 24(2), 86-95. https://doi.org/10.1016/j.intmar.2010.02.005
Dodds, W. B., Monroe, K. B., & Grewal, D. (1991). Effects of price, brand, and store information on buyers' product evaluations. Journal of Marketing Research, 28(3), 307-319. https://doi.org/10.1177/002224379102800305
Evanschitzky, H., & Woisetschläger, D. (2008). Too old to choose? The effects of age and age related constructs on consumer decision making. Consumer Research -North American Conference Proceedings,35, 630-636. Retrieved from
https://strathprints.strath.ac.uk/id/eprint/9294
Fornell, C., & Larcker, D. F. (1981). Evaluating structural equation models with unobservable and measurement error. Journal of Marketing Research, 18(1), 39-50. https://doi.org/10.1177/002224378101800104
Gopinath, M., & Glassman, M. (2008). The effect of multiple language product descriptions on product evaluations. Psychology and Marketing, 25(3), 233-261. https://doi.org/10.1002/mar.20207
Grohmann, B., Spangenberg, E. R., & Sprott, D. E. (2007). The influence of tactile input on the evaluation of retail product offerings. Journal of Retailing, 83(2), 237-245. https://doi.org/10.1016/j.jretai.2006.09.001
Guéguen, N., Jacob, C., & Ardiccioni, R. (2012). Effect of watermarks as visual cues for guiding consumer choice: An experiment with restaurant menus. International Journal of Hospitality Management, 31(2), 617-619.
https://doi.org/10.1016/j.ijhm.2011.04.008
Herz, M., & Diamantopoulos, A. (2017). I use it but will tell you that I don't: consumers’ country-of-origin cue usage denial. Journal of International Marketing,
25(2), 52-71. https://doi.org/10.1509/jim.16.0051
Hoch, S. J., & Ha, Y. W. (1986). Consumer learning: Advertising and the ambiguity of product experience. Journal of Consumer Research, 13(2), 221-233. https://doi.org/10.1086/209062
Hoegg, J., & Alba, J. W. (2007). Taste perception: More than meets the tongue.
Journal of Consumer Research, 33(4), 490-498. https://doi.org/10.1086/510222 Holbrook, M. B., & Hirschman, E. C. (1982). The experiential aspects of
Hong, S. T., & Kang, D. K. (2006). Country-of-origin influences on product evaluations: the impact of animosity and perceptions of industriousness brutality on judgments of typical and atypical products. Journal of Consumer Psychology,
16(3), 232-239. https://doi.org/10.1207/s15327663jcp1603_5
Howard, D. G. (1989). Understanding how American consumers formulate their attitudes about foreign products. Journal of International Consumer Marketing,
2(2), 7-24. https://doi.org/10.1300/j046v02n02_02
Hoyer, W. D., & Brown, S. P. (1990). Effects of brand awareness on choice for a common, repeat-purchase product. Journal of Consumer Research, 17(2), 141-148. https://doi.org/10.1086/208544
Ilicic, J., & Webster, C. M. (2013). Celebrity co-branding partners as irrelevant brand information in advertisements. Journal of Business Research, 66(7), 941-947. https://doi.org/10.1016/j.jbusres.2011.12.014
Jang, S. S., & Namkung, Y. (2009). Perceived quality, emotions, and behavioral intentions: Application of an extended Mehrabian–Russell model to restaurants.
Journal of Business Research, 62 (4), 451-460. https://doi.org/10.1016/j.jbusres.2008.01.038
Jones, B., & O’Neil, S. (1985). Combining vision and touch in texture perception.
Perception and Psychophysics, 37(1), 66-72. https://doi.org/10.3758/bf03207140 Kempf, D. S., Laczniak, R. N., & Smith, R. E. (2006). The effects of gender on
processing advertising and product trial information. Marketing Letters, 17(1), 5-16. https://doi.org/10.1007/s11002-006-3545-8
Kennedy-Hagan, K., Painter, J. E., Honselman, C., Halvorson, A., Rhodes, K., & Skwir, K. (2011). The effect of pistachio shells as a visual cue in reducing caloric consumption. Appetite, 57(2), 418-420. https://doi.org/10.1016/j.appet.2011.06.003 Kiang, M. Y., Ye, Q., Hao, Y., Chen, M., & Li, Y. (2011). A service-oriented analysis
of online product classification methods. Decision Support Systems, 52(1), 28-39. https://doi.org/10.1016/j.dss.2011.05.001
Klatzky, R. L., & Lederman, S. J. (1992). Stages of manual exploration in haptic object identification. Perception and Psychophysics, 52(6), 661-670.
https://doi.org/10.3758/bf03211702
Klatzky, R. L., & Lederman, S. J. (1993). Toward a computational model of constraint-driven exploration and haptic object identification. Perception, 22(5), 597-621. https://doi.org/10.1068/p220597
Koschate-Fischer, N., Diamantopoulos, A., & Oldenkotte, K. (2012). Are consumers really willing to pay more for a favorable country image? A study of country-of-origin effects on willingness to pay. Journal of International Marketing, 20(1), 19-41. https://doi.org/10.1509/jim.10.0140
Krishna, A., & Morrin, M. (2008). Does touch affect taste? The Perceptual transfer of product container haptic cues. Journal of Consumer Research, 34(6), 807-818. https://doi.org/10.1086/523286
Labrecque, L. I., Patrick, V. M., & Milne, G. R. (2013). The marketers’ prismatic palette: A review of color research and future directions. Psychology & Marketing,
30(2), 187-202. https://doi.org/10.1002/mar.20597
Lederman, S. J., & Klatzky, R. L. (1987). Hand movements: A window into haptic object Recognition. Cognitive Psychology, 19(3), 342-368.
https://doi.org/10.1016/0010-0285(87)90008-9
Liu, F., Li, J., & Murphy, J. (2008). The effect of language on brand attitude - a wine label test in China. American Academy of Advertising Conference Proceedings,
available at,
https://search.proquest.com/docview/192403572/fulltextPDF/B692D25CC7054069 PQ/5?accountid=8008
Martin, I. M., & Eroglu, S. (1993). Measuring a multi-dimensional construct: country image. Journal of Business Research, 28(3), 191-210. https://doi.org/10.1016/0148-2963(93)90047-s
McCabe, D. B., & Nowlis, S. M. (2003). The effect of examining actual products or product descriptions on consumer preference. Journal of Consumer Psychology,
13(4), 431-439. https://doi.org/10.1207/s15327663jcp1304_10
McDaniel, C., & Baker, R. C. (1977). Convenience food packaging and the perception of product quality. Journal of Marketing, 41(4), 57-58.
https://doi.org/10.2307/1250234
Meyvis, T., & Janiszewski, C. (2002). Consumers’ beliefs about product benefits: the effect of obviously irrelevant product information. Journal of Consumer Research,
28(4), 618-635. https://doi.org/10.1086/338205
Meyvis, T., Goldsmith, K., & Dhar, R. (2012). The importance of the context in brand extension: How pictures and comparisons shift consumers' focus from fit to quality.
Journal of Marketing Research, 49(2), 206-217. https://doi.org/10.1509/jmr.08.0060
Nagashima, A. (1970). A comparison of Japanese and U.S. attitudes toward foreign products. Journal of Marketing, 34(1), 68-74.
https://doi.org/10.1177/002224297003400115
Nunnally, J. C. (1978), Psychometric theory, McGraw-Hill, New York.
Ostrom, T. M. (1969). The relationship between the affective, behavioral, and cognitive components of attitude. Journal of Experimental Social Psychology, 5(1), 12-30. https://doi.org/10.1016/0022-1031(69)90003-1
Peck, J. (1999). Extraction of Haptic Properties: Individual Characteristics and Stimulus Characteristics. Doctoral dissertation, Department of Marketing, University of Minnesota.
Peck, J., & Childers, T. L. (2003). Individual differences in haptic information processing: The “need for touch” scale. Journal of Consumer Research, 30(3), 430-442. https://doi.org/10.1086/378619
Peck, J., & Childers, T. L. (2003). To have and to hold: The influence of haptic information on product judgments. Journal of Marketing, 67(2), 35-48.
https://doi.org/10.1509/jmkg.67.2.35.18612
Peck, J., & Childers, T. L. (2006). If I touch it i have to have it: Effects of need for touch on impulse purchasing. Journal ofBusiness Research, 59(6), 765-769.
https://doi.org/10.1016/j.jbusres.2006.01.014
Peck, J., & Wiggins, J. (2006). It just feels good: customers’ affective response to touch and its influence on persuasion. Journal of Marketing, 70(4), 56-69.
https://doi.org/10.1509/jmkg.70.4.56
Rahman, O. (2012). The influence of visual and tactile inputs on denim jeans evaluation. International Journal of Design, 6(1), 11-25. Retrieved from http://www.ijdesign.org/index.php/IJDesign/article/view/955/400
Roth, M. S. & Romeo, J. B. (1992). Matching product category and country image perceptions: a framework for managing country-of-origin effects. Journal of International Business Studies, 23(3), 477-497.
https://doi.org/10.1057/palgrave.jibs.8490276
Segars, A. H., & Grover, V. (1998). Strategic information systems planning success: An investigation of the construct and its measurement. MIS Quarterly, 22(2), 139-163. https://doi.org/10.2307/249393
Shiv, B., Carmon, Z., & Ariely, D. (2005). Placebo effects of marketing actions: consumers may get what they pay for. Journal of Marketing Research, 42(4), 383-393. https://doi.org/10.1509/jmkr.2005.42.4.383
Thorelli, H. B., Lim, J. S., & Ye, J. (1989). Relative importance of country-of-origin, warranty on retail store image on product evaluations. International Marketing Review, 6(1), 35-46. https://doi.org/10.1108/eum0000000001501
Tijssen, I., Zandstra, E. H., de Graaf, C., & Jager, G. (2017). Why a ‘light’product package should not be light blue: Effects of package colour on perceived healthiness and attractiveness of sugar-and fat-reduced products. Food Quality and Preference, 59, 46-58. https://doi.org/10.1016/j.foodqual.2017.01.019
Underhill, P. (1999), Why We Buy, The Science of Shopping. New York: Simon and Schuster.
Van Doorn, G., Woods, A., Levitan, C. A., Wan, X., Velasco, C., Bernal-Torres, C., & Spence, C. (2017). Does the shape of a cup influence coffee taste expectations? A cross-cultural, online study. Food Quality and Preference, 56, 201-211.
https://doi.org/10.1016/j.foodqual.2016.10.013
Vieira, V. A. (2012). An evaluation of the need for touch scale and its relationship with need for cognition, need for input, and consumer response. Journal of International Consumer Marketing, 24(1-2), 57-78.
https://doi.org/10.1080/08961530.2012.650139
Wheatley, J. J., Chiu, J. S. Y. & Goldman, A. (1981). Physical quality, price and perceptions of product quality: Implications for retailers. Journal of Retailing,
57(2), 100-116.
Wolin, L. D. (2003). Gender issues in advertising-an oversight synthesis of research: 1970-2002. Journal of Advertising Research, 43(1), 111-129.
https://doi.org/10.2501/jar-43-1-111-130
Dr. Fang-Ping Chen is Assistant Professor of the Department of Marketing and Logistics Management at Chihlee University of Technology and she has authored and co-authored scientific papers and presented her works at many national and International conferences. She is primarily interested in the role of Electronic Commerce, and Network Marketing.
Mr. Hsiang Chen (Corresponding author) is a doctoral student at the Department of Business Administration, National Taipei University. He is primarily interested in the role of Electronic Commerce, and Network Behavior in Marketing. His research interests extend to the marketing areas of word of mouth and social network site.
Ms. Hsiao-Chi Hou earned her MBA degree from Department of Business Administration, National Taipei University. Now, she works for Kinmax Technology Inc.