83 2, XXI, 2018
DOI: 10.15240/tul/001/2018-2-006
Introduction
Parcel delivery service, or courier service, is defi ned as delivering small and light parcels, quickly and accurately relying on sophisticated networks and the reliable tracking of the shipments (Ducret, 2014). Due to the rapid expansion of e-commerce, parcel delivery service industry became one of the fastest growing industries in the world and characterized as follows. First, it is an asset intensive industry since it requires huge investment on facilities such as delivering vehicles and hub facilities. Because of huge investment and long payback period, small and medium sized companies are seldom found in the market. Second, the core competencies of company are the speed and the accuracy of delivery. To achieve these competencies, it is important to construct the rapid and reliable information system. Finally, customers of the service are geographically spread out across the wide area. Therefore, a reliable and effi cient delivery network is the most important asset of the company.
Expansion of the parcel delivery service industry claimed the attention of researchers. For example, Ducret (2014) interviewed 112 experts from European parcel delivery service
industry so as to fi nd the trend of this sector, its drivers and current issues. He mainly focused on the urban logistics so called “last-mile” issue and analyzed the logistic strategy of various European parcel delivery service companies. Hayashi et al. (2014) provided a conceptual model to explain the development process of the parcel delivery market and compared the characteristics of the parcel delivery service industry in China and Japan.
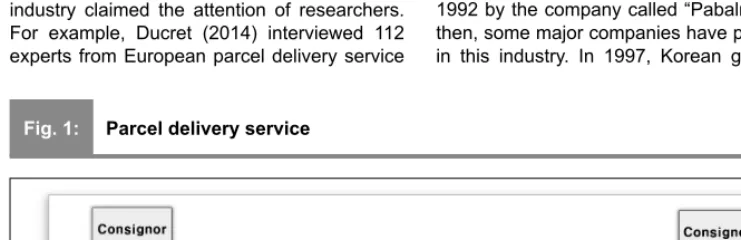
In South Korea, KFTC (Korea Fair Trade Commission) defi nes the parcel delivery service in detail as (1) weight of the parcel is less than 30kg including its packaging, (2) the size of the shipment (the sum of the length, height and width) is less than 160cm, (3) service includes pick-up, packaging, transportation and delivery, (4) service company has the full responsibility on the whole process from pick-up to delivery. Fig. 1 shows the general process of the parcel delivery service.
In South Korea, the legislation on the parcel delivery service was introduced in 1989, but the fi rst parcel delivery service was launched in 1992 by the company called “Pabalma”. Since then, some major companies have participated in this industry. In 1997, Korean government
RESTRUCTURING PARCEL DELIVERY
NETWORK BY CONSIDERING DYNAMIC
CUSTOMER DEMAND
Hyun-Woong Jin
Fig. 1: Parcel delivery service
Source: Korea Integrated Logistics Association (2010)
EM_2_2018.indd 83
84 2018, XXI, 2
changed the entry condition to the parcel delivery service market from the accreditation system to the registration system. This brought the sharp increase of the number of players in the Korean parcel delivery service market as well as the expansion of the market size.
Up to the late 1990s, urgent postal mail was the main product of the parcel delivery service and the market size was gradually increased. However, as the e-commerce such as online shopping mall has been introduced and grown since the 2000s, the parcel delivery service market increased rapidly as shown in Fig. 2.
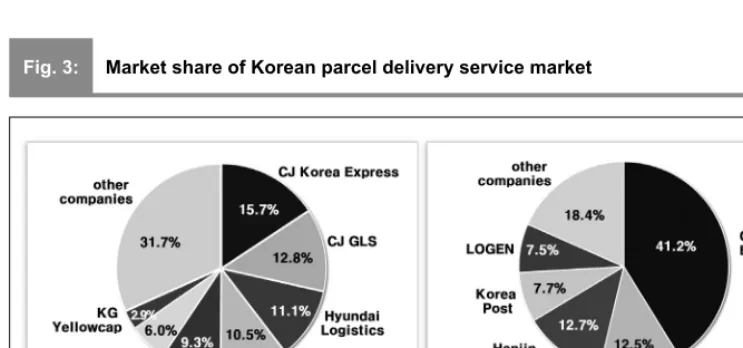
As the competition becomes tough, M&A among the companies were progressed and the size of the companies increased. In result, the small and medium sized companies lost their market shares as shown in Fig. 3.
Tough competition also resulted in the reduction of the price of delivery service. The average price per parcel has dropped from KRW 3,000 in 2000 to KRW 2,392 in 2015, which means more than 20% reduction. Therefore, parcel delivery service companies are forced to restructure their delivery network so as to secure their competencies in terms of cost and delivery speed.
Fig. 2: Number of parcels and growth rate of Korean parcel delivery service industry
Source: Korea Information Society Development Institute (2016)
Fig. 3: Market share of Korean parcel delivery service market
Source: Korea Information Society Development Institute (2016)
EM_2_2018.indd 84
85 2, XXI, 2018
1. Parcel Delivery Network
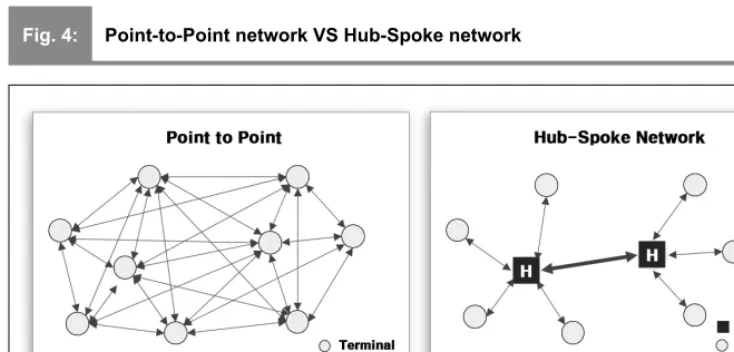
In the parcel delivery service industry, there are lots of origins and destinations which are scattered across the whole nation. Even though various types of parcel delivery network have been constructed by companies, they can be categorized according to their delivery strategy as point-to-point network and hub-spoke network (Bowen, 2012; Jo et al., 2012).
In point-to-point network, parcels are directly transported from the origin terminal to the destination terminal. It is commonly used for the small and medium sized parcel delivery network since it does not require large investment on the hub facility. However, as the delivery network grows, the complexity of the management increases fast.
On the other hand, in hub-spoke network, parcels in the terminal site are sent to its assigned hub facility so that the volume of parcels between hubs increases greatly (Sung & Jin, 2001). The increased volume between hubs allows the economy of scale. Therefore, hub-spoke network is widely used for a large scaled parcel delivery network (Cheung et al., 2001; Jo et al., 2012) and many researchers dealt with the design issues for hub-spoke network (Wasner & Zapfel, 2004; Jung et al., 2006). Detailed description of the related researches on hub-spoke network can be found in the research of Farhani et al. (2013). Main issues on the hub-spoke network design are to decide the number of hubs and their locations
as well as the assignment of terminal nodes to hubs. More hubs allow the effi cient operation but require huge investment.
Like other big companies, most of key players in the Korean parcel delivery service industry also constructed their delivery service network as a form of hub-spoke network or hybrid type (Kim et al., 2015). As the e-commerce market in Korea increases, the parcel delivery service companies are forced to expand the capacity of hub facilities so as to satisfy the increased customer demand. Moreover, fl uctuation on the customer demand disturbed the stable delivery service in terms of delivery time.
Fig. 5 shows the monthly seasonality of customer demand obtained from one of the biggest Korean parcel delivery service company. Seasonality fl uctuates from 1.088 in January to 0.915 in August. To satisfy the fl uctuating demand, companies utilize temporary hubs as well as permanent hubs (Lee et al., 2005). Temporary hubs are installed so as to meet the seasonal demand exceeding the capacity of permanent hubs and they are closed after some time. Opening and closing costs of temporary hubs are relatively cheaper than those of permanent hubs and sometimes a company leases temporary hub facilities from other companies for a certain time period (Lee et al., 2005; Gelareh et al., 2015).
In this situation, company needs to decide when to open and close temporary hubs as well as the number of them and their locations. This kind of decision problem is called as the dynamic Fig. 4: Point-to-Point network VS Hub-Spoke network
Source: own
EM_2_2018.indd 85
86 2018, XXI, 2
hub-spoke network design problem. Surely, this problem can happen in every country, not only in South Korea. For example, Gelareh et al. (2015) mentioned that major airports in the world such as Frankfurt and Paris in Europe, Hong Kong and Singapore in Asia and Atlanta and Chicago in the U.S. played a role of hub nodes in the freight delivery network. And they claimed the necessity of network restructuring by opening and closing each hub so as to meet the customer demand.
Even though there are so many researches on the hub-spoke network design problem, researches dealing with the dynamic customer demand are very limited. The fi rst research on the dynamic hub-spoke network design is due to Campbell (1990). Campbell assumed that customer demand was continuously increasing and proposed the myopic strategy so as to fi nd the location of additional hub facilities. Contreras et al. (2011) considered the
fl uctuation of customer demand and proposed the Lagrangean relaxation approach to solve their problem. In their research, the capacity of hub facilities are assumed to be unlimited. Gelereh et al. (2015) also considered the
fl uctuation of customer demand and proposed the meta-heuristic algorithm. In their research, all the hubs and candidate sites are allowed to change their status only once during the whole time period. That is, if a hub site is closed, then it cannot be re-opened until the end of time period. Also, if a hub site is installed at the specifi c time
period, then it should remain open until the end of time period. Recently, Ebrahimi-Zade et al. (2016) proposed the genetic algorithm to solve the dynamic hub set covering problem. Even though there are some previous researches on the dynamic hub-spoke network design, all the previous papers assumed that the capacity of hub facility is unlimited. This lack of research motivated the author and this paper deals with the parcel delivery network design problem so as to meet the dynamic customer demand with the capacitated hub facilities.
2. Problem Description
This section describes the decision problem that this paper considers. A parcel delivery network composed of the set of terminal nodes
N
and the set of candidate sites for hub facilityM
during the time periodT
is given. Some of the sites inM
are selected as hubs for each time period and terminal nodes are assigned to one of the open hubs so as to concentrate their parcels to the corresponding hub.Since all the hubs are fully connected, if terminal nodes
i
andj
are assigned to hubsk
andl
, respectively, then the parcels fromi
to
j
are transported through the links of from terminal nodei
to hubk
, of from hubk
to hubl
, and then of from hubl
to terminal nodej
.The objective of the considered problem is to make a decision on the number of temporary hubs and their locations at each time period so as to minimize the total delivery cost. To Fig. 5: Seasonality of parcel delivery service demand
Source: Korea Information Society Development Institute (2016)
EM_2_2018.indd 86
87 2, XXI, 2018
construct a mathematical formulation, the decision variables are defi ned as follows.
Y
tk : 1 if candidate site
k
is selected as a hubat time period
t
, and 0 otherwise.X
tik : 1 if terminal node
i
is assigned to hubk
attime period
t
, and 0 otherwise.Since this paper deals with the fl uctuating customer demands, the number of hub facilities might be different from period to period. For each hub facility, some amount of budget is required for its installation and closing as well as the operation. Therefore, in this paper, the hub related cost including the installation, closing and operation is assumed to be restricted by the given budget for each time period. Moreover, the capacity of each hub is assumed to be limited and known. The followings are the parameters used in this paper to construct the mathematical model.
C
tijkl : the unit delivery cost of demand from
terminal node
i
to terminal nodej
through hubk
andl
at time periodt
.W
tij : the amount of demand from terminal
node
i
to terminal nodej
at time periodt
.F
tk : the hub installation cost at candidate
site
k
at time periodt
.O
tk : the hub operation cost at candidate site
k
at time periodt
.Q
tk : the hub closing cost at candidate site
k
at time period
t
.B
t : the given budget at time periodt
.CA
tk : the capacity of candidate site
k
at timeperiod
t
.In this problem, the number and location of permanent hubs are assumed to be given. And their installation and closing cost at each time period are set to 0 since permanent hubs are already installed and will not be closed during the time horizon. With the above notations, the considered problem can be formulated as follows.
(1)
(2a)
(2b)
(2c)
(3)
(4)
(5)
Eq. (1) shows that the objective function of this problem is to minimize the total delivery cost occurred through the whole time period. The unit delivery cost
C
tijkl is obtained by assuming
that hubs are installed at site
k
andl
. Moreover, the fi xed cost for hub operation is excluded and considered in the constraints with the hub installation cost and the hub closing cost. For the simplicity, the unit delivery cost is assumed to be independent to the volume transported. Constraints (2a), (2b) and (2c) require that the total hub related cost should not exceed the given budget for each time period. Constraints (3) mean that the volume of parcels passing through the hub facility should not exceed its capacity. Constraints (4) require each terminal node is assigned to exactly one hub facility. Finally, constraints (5) mean that the decision variables are binary.The above model can be linearized by introducing additional variables. However, in this paper, the mathematical formulation is constructed as a non-linear IP model for the compactness and readability.
3. Solution Approach
It is well known that the complexity of the uncapacitated hub-spoke network design problem is NP-hard (Sung & Jin, 2001). Since the problem considered in this paper is an extended form of the uncapacitated hub-spoke network design problem, the complexity of the
EM_2_2018.indd 87
88 2018, XXI, 2
considered problem is also NP-hard. Therefore, this research aims to develop a heuristic algorithm rather than an exact algorithm so as to fi nd a good solution in a reasonable time.
In this paper, the two phased solution procedure based on GRASP heuristic is proposed. At the fi rst phase, the solution procedure aims to fi nd a feasible solution of the considered problem. And at the second phase, a local search procedure is adopted so as to improve the current solution.
3.1 Construction
Phase
GRASP (Greedy Randomized Adaptive Search Procedure) is one of the meta-heuristics, which can be adopted to various combinatorial optimization problems and initially proposed by Feo and Resende (1995). GRASP iteratively constructs a feasible solution by adding one element at a time. To select an element, the greedy function which measures the attractiveness when a specific element is added to the solution is used. In the traditional greedy method, the element having the best greedy function value is selected and added to a solution. However, in GRASP, a set of good elements having the greedy function values belonging to some predetermined range from the best greedy function value is constructed. The set of good elements is called as RCL (Restricted Candidate List) and an element in RCL is randomly selected as a candidate for the solution. That is, GRASP randomly selects any element belonging RCL which having reasonable value, whereas the traditional greedy method always selects the best element only. That means GRASP provides more diversity than the traditional greedy method so that it could overcome the trap of local optimum solution. Usually, GRASP is accompanied by local search procedure so as to improve its solution.
In this paper, the objective of construction phase is to fi nd a feasible solution satisfying the budget constraints and the capacity constraints. That is, the procedure needs to decide the number of temporary hubs and their location as well as the assignment of terminal nodes to its corresponding hub for each time period. The procedure consists of three sub-procedures. The fi rst sub-procedure aims to fi nd a set of temporary hubs to satisfy the constraints by using the following greedy function
G
t1
(k)
.(6)
where
H
p means the set of permanent hubs. With Eq. (6), a candidate site, which requires small installation and operation cost or has large capacity, can have high priority. If the hub cost and the capacity of some candidate sites are similar, then a site which is located near to the permanent hub has priority. If the installation of hub facility at sitek
results in the excess of the given budget, the greedy function valueG
t1
(k)
is set to the infi nite value so as toprevent the solution procedure from selecting the corresponding candidate
k
as a hub site. This sub-procedure will be iterated until all the capacity constraints are satisfi ed.At the second sub-procedure, candidate sites which might reduce the total delivery cost are selected by considering the following greedy function
G
t2
(k)
.(7)
In Eq. (7),
H
1 i andH
1
j mean the hubs that
terminal node
i
andj
is currently assigned, respectively. Moreover,N
2(k)
is the set ofterminal nodes which provide better delivery cost by changing their currently assigned hub to the newly installed hub
k
. If the installation of hub facility at sitek
results in the excess of the given budget, the greedy function valueG
t2
(k)
is set to the infi nite value so as to prevent the solution procedure from selecting the candidate
k
as a hub site. This sub-procedure is repeated until there are no more candidate sites which improve the delivery cost.The above sub-procedures consider only the installation of temporary hubs. It might lead to the installation of redundant temporary hubs. Therefore, in the third sub-procedure, less attractive temporary hubs are closed by considering the following greedy function
G
t3
(k)
.(8)
EM_2_2018.indd 88
89 2, XXI, 2018
In Eq. (8),
H
2i means the hub that terminal
node
i
is newly assigned andN
3(k)
is the setof terminal nodes which provide better delivery cost by changing their assigned hub from
k
toH
2i. If there are remaining terminal nodes in
N
3(k)
which cannot be assigned to any other opening hub due to the capacity restriction, the greedy function value
G
t3
(k)
is set to the infi nite valueso as to prevent the solution procedure from closing the corresponding temporary hub
k
. This sub-procedure is repeated until there are no more temporary hubs which can be closed.The construction phase described in the above can be summarized as follows.
STEP 1. Construct a set of temporary hubs satisfying the budget and capacity constraints
1.1. Calculate Greedy Function Calculate the greedy function
G
t1
(k)
for all thecandidate sites.
1.2. Construct RCL
Include candidate site
k
in RCL, ifG
t 1(k)
issmaller than min
Gt
k *
% Mk 1 100 . 1.3. Select a newly installed temporary hub Randomly select candidate site
k
in RCL as a newly installed temporary hub.1.4. Assign terminal nodes to the newly installed temporary hub
Assign terminal nodes which are assigned to the overfl owed hub until the capacity of the newly installed hub is met.
1.5. Feasibility Check
If the constraints are satisfi ed, then go to STEP 2. Otherwise, go to Step 1.1.
STEP 2. Improve the current solution by adding temporary hubs
2.1. Calculate Greedy Function Calculate the greedy function
G
t2
(k)
for all thecandidate sites.
2.2. Construct RCL
Include candidate site
k
in RCL, ifG
t2
(k)
is lessthan min
Gt
k *
% Mk 2 100 .
2.3. Select a newly installed temporary hub Randomly select candidate site
k
in RCL as a newly installed temporary hub.2.4. Assign terminal nodes to the newly installed temporary hub
Assign terminal nodes which are assigned to the existing hubs to the newly installed hub, if the assignment reduces the total delivery cost.
2.5. Feasibility Check
If the objective function is improved, then go to Step 2.1. Otherwise, go to STEP 3.
STEP 3. Improve the current solution by closing temporary hubs
3.1. Calculate Greedy Function Calculate the greedy function
G
t3
(k)
for all theopening temporary hub sites.
3.2. Construct RCL
Include hub site
k
in RCL, ifG
t3
(k)
is less than
G k *
%min t
M
k 3 100 .
3.3. Select a newly closing temporary hub Randomly select candidate site
k
in RCL as a newly closing temporary hub.If closing any temporary hubs leads to infeasible solution, then terminate the procedure.
3.4. Reassign terminal nodes to other hubs Assign terminal nodes which are assigned to the newly closing hub to other hubs.
Go to Step 3.1.
3.2 Local Search Phase
The construction phase of GRASP aims to fi nd a feasible solution. Then, in the local search phase, the quality of the solution is improved by searching for the better solutions.
In the local search method, a set of neighborhood solutions which can be moved from the current solution is defi ned. Then, the current solution is moved to the neighborhood solution providing the best objective function value. By repeating this procedure, gradual improvement of the solution is achieved.
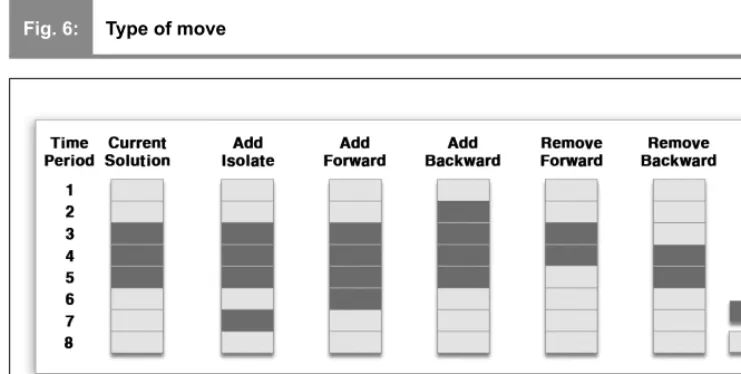
In this paper, move is defi ned as a change of opening period of specifi c candidate sites. More specifi cally, for each candidate sites, the following moves are defi ned. Add_Isolate is to open the node at the time period when the previous period and the following period are closed. Add_Forward and Add_Backward are to open the node at the following and the previous period of the consecutive opening period, respectively. Remove_Forward and Remove_Backward are to close the node at the last and the fi rst period of the consecutive opening period, respectively. Fig. 6 shows an illustrative example of each move.
EM_2_2018.indd 89
90 2018, XXI, 2
The main drawback of local search is to become stuck in a sub-optimum solution. To escape this trap, this research adopts Tabu search method initially proposed by Glover (1989). Tabu search uses the short-term memory structure called tabu list which records the history of the recently visited solution. Neighborhood solution which is included in the tabu list is excluded from the candidate solution so as to prevent the local search procedure from trapping in the sub-optimal solution. In this research, the changed node and the changed time period in the previous move are recorded in the tabu list.
Since the proposed local search procedure is a heuristic algorithm, it is not easy to measure its effectiveness. However, Hertz and Widmer (2003) proposed the following guidelines to design an effective local search algorithm.
1. It should be easy to generate a neighborhood solution.
2. There must be a path linking the considered solution to the optimal solution.
3. Neighborhood solution should be in some sense close to the current solution. 4. The topology induced by the objective
function on the neighborhood solution should not be too fl at.
A neighborhood solution in this procedure is found by changing the status of specifi c site
at specifi c time period. Therefore, guideline 1 and 3 seem to be satisfi ed by the defi nition of neighborhood solution. And all the feasible solutions can be reached by use of the defi ned moves. It means that guideline 2 is also satisfi ed. Finally, every move changes the objective function value so as to meet the guideline 4. Therefore, it may be claimed that the local search procedure described in this section satisfi es the guideline for the meta-heuristic algorithm.
3.3 Whole Solution Procedure
The following summarizes the whole solution procedure described in the above sections.
STEP 1. Initialization
1.1. Randomly set
θ
to be the value between 0 and 0.1.1.2. Set
Current_Best_Soln
and setCurrent_
Best_Obj_Value
to be a big value. STEP 2. Construction Phase2.1. Construct a feasible
Current_Soln
by implementing the construction procedure described in the section 3.1 and calculateCurrent_Soln_Obj_Value
. STEP 3. Local Search Phase3.1. Improve
Current_Soln
by implementing the local search procedure described in the section 3.2 and calculateCurrent_Soln_
Obj_Value
.Fig. 6: Type of move
Source: own
EM_2_2018.indd 90
91 2, XXI, 2018
STEP 4. Update
4.1. If
Current_Soln_Obj_Value
is smaller thanCurrent_Best_Obj_Value
, then replaceCurrent_Best_Soln
andCurrent_
Best_Obj_Value
withCurrent_Soln
andCurrent_Obj_Value
.4.2. If
Current_Soln_Obj_Value
is not updated duringε
iterations, then increaseθ
by 0.1.STEP 5. Termination Condition
5.1. If
θ
is larger than or equal to 1.0, than setCurrent_Best_Soln
to be the fi nal solution and terminate the whole procedure. Otherwise, go to STEP 2.Parameter
θ
decides the size of RCL. Ifθ
is set to a small value, then the number of elements in RCL decreases so as to concentrate on more attractive elements. On the other hand, ifθ
is set to a large value, then the number of elements in RCL increases so that various elements can be selected. In this research,θ
is initially set to a small value and increases gradually. It means that the solutionprocedure utilizes the intensifi cation strategy which searches the attractive solution space at the initial part, but gradually moves to the diversifi cation strategy which searches for the unexploited solution space.
4. Experimental Test
4.1 Instances
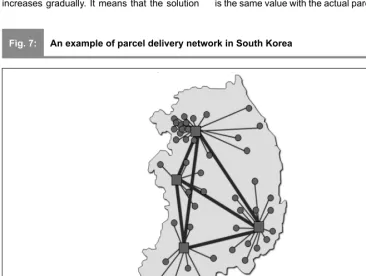
To evaluate the performance of the solution procedure described in Section 3, the following example of parcel delivery network in South Korea is considered.
In this parcel delivery network, 50 terminal nodes are selected by considering the population of the city and its geographical distribution. Since the most of parcel delivery service demands in South Korea come from individual customers, parcel delivery service demands are mainly proportional to the population of the city (Jung & Kim, 2015). Geographical distribution refl ects the administrative district and the delivery cost. Number of permanent nodes is set to four, which is the same value with the actual parcel delivery
Fig. 7: An example of parcel delivery network in South Korea
Source: own
EM_2_2018.indd 91
92 2018, XXI, 2
network in Lee et al. (2005), and their locations are decided to minimize the total delivery cost. Unfortunately, the real parcel delivery network of a Korean parcel delivery service company cannot be released due to the confi dentiality issues. However, the above parcel delivery network is not very far from the actual parcel delivery network.
To test the effectiveness of the proposed solution procedure under various environments, the following design factors are considered to generate the data set; level of demand randomness, level of seasonality, type of hub cost and type of hub capacity.
First two factors are related to the parcel delivery service demand between terminal nodes at each time period. Actual parcel delivery service demand between terminal nodes at each time period is calculated by multiplying the initial demand and the monthly seasonality and the random variation value. Initial demands between terminal nodes are assumed to be proportional to their population. The random variation value which decides the fi rst design factor is set to small if the random variation value is randomly selected between 0.9 and 1.1. And it is set to medium if the range is between 0.8 and 1.2 and large if the range is between 0.7 and 1.3. The level of seasonality is set to be medium if the monthly seasonality is the same to the actual value described in Fig. 5. And it is set to small if 0.5 is multiplied to the actual value and to large if 2.0 is multiplied to the actual value.
For the third design factor, hub costs including hub installation, operation and closing costs are defi ned in three different ways. The
fi rst type is to set the hub costs to be proportional to the customer demand. In the second type, the hub costs are set to the same values across all the candidate sites. In the third type, hub costs are randomly generated within the same ranges.
The fourth design factor, type of capacity of hub facilities, is set to be similar to the type of hub costs. That is, in the fi rst type, the capacity of hub facility is assumed to be proportional to its customer demand, while the second type sets the same capacity across all the candidate sites. In the third type, capacity of candidate site is randomly generated.
Since there are 4 design factors having 3 levels, 81 combinations are possible. Moreover, to ensure the reliability of the experimental test, 10 data sets are randomly generated for each combination.
4.2 Test
Result
The performance of the proposed solution procedure is compared with the meta-heuristic solution algorithm proposed by Gelerah et al. (2015). Even though they considered similar environment with the problem considered in this paper, they assumed that the capacity of hub facilities is unlimited. Therefore, some modifi cations on their algorithm are needed. In this experimental test, if a neighborhood solution does not satisfy the capacity constraints, then the penalty value proportional to the excessive capacity is added to the objective function value so as to guide the algorithm to the feasible solution area.
Tab. 1 below summarizes test results of the proposed solution procedure and Gelareh et al.’s meta-heuristic algorithm.
The average objective function value (delivery cost) of GRASP algorithm with the whole data set is 22,276,666.91, which is 12.96% less than the average objective function value of Gelereh et al.‘s meta-heuristic algorithm, 25,162,699.62. That is, the overall test results show that the GRASP algorithm proposed in this paper outperforms the meta-heuristic algorithm proposed by Gelareh et al.
Graphical illustration of the test results in terms of the design factors are shown in Fig. 8. The upper graphs in Fig. 8 show that the objective function values of both algorithms increase as the level of demand randomness and the seasonality increase. It is expected result since the randomness and the seasonality increase the uncertainty of customer demand. However, it is shown that the gap between GRASP and Gelareh et al.‘s algorithm increases as the level of randomness and the level of seasonality increase. From this result, it might be claimed that the GRASP algorithm is more robust than the Gelareh et al.‘s algorithm in terms of demand variation.
Another interesting result is that the slope of increase in the level of seasonality is steeper than that of the level of demand randomness in both algorithms. It might be reasonable to infer that the high seasonality requires frequent installation and closing of temporary hubs and these frequent installation and closing increase the complexity of the problem.
In terms of the type of hub cost, the objective function value when the hub costs are proportional to the customer demand is larger than the objective function value when the
EM_2_2018.indd 92
93 2, XXI, 2018
Design Factor Level GRASP Gelareh et al.
level of demand randomness
small 22,116,962.63 23,257,593.42 medium 22,740,969.95 25,900,992.41 large 21,972,068.16 26,329,511.83
level of seasonality
small 20,597,061.83 21,766,328.46 medium 22,147,049.59 24,052,781.59 large 24,085,889.32 29,668,987.61
type of hub cost
proportional to demand 24,627,045.90 27,833,337.73 same value 20,634,857.52 23,561,847.08 random value 21,568,097.31 24,092,912.85
type of capacity
proportional to demand 21,007,805.98 23,771,291.50 same value 23,005,716.07 25,988,213.60 random value 22,816,478.69 25,728,592.56
Source: own
Tab. 1: Experimental test result
Fig. 8: Test results in terms of design factors
Source: own
EM_2_2018.indd 93
94 2018, XXI, 2
hub costs are the same across all the terminal nodes or the objective function value when the hub costs are randomly generated regardless of the customer demand. It is desirable to locate temporary hubs near the terminal nodes having large customer demand since it could reduce the delivery cost of large volume. However, if the hub costs are proportional to the customer demand, then the terminal node having large customer demand might be excluded from hub candidate because of high hub cost. This might be the reason why the objective function value when the hub costs are proportional to the customer demand is higher than others. No big differences are found between other types.
On the contrary, in terms of the hub capacity, the objective function value when the hub capacities are proportional to the customer demand is smaller then the objective function value when the hub capacities are the same across all the terminal nodes or the objective function value when the hub capacities are randomly generated regardless of the customer demand. In this case, high capacity of the terminal nodes having high customer demand tends to attract temporary hubs. Therefore, the delivery cost for large volumes might decrease compared to other cases. Like the result of type of hub cost, no peculiar differences are found between the same amount of capacity and the randomly assigned capacity.
Conclusions
This research aims to provide the effi cient procedure to reconstruct the parcel delivery network by considering dynamic customer demand. The solution procedure proposes to install and close temporary hubs so as to satisfy the fl uctuating customer demand. Temporary hub responds to the excessive demands assigned to the permanent hubs and is closed during the recession period so as to reduce its operating cost.
To show the appropriateness of the proposed approach, trend of the parcel delivery service industry in South Korea was analyzed and the mathematical formulation was constructed. Since the complexity of the considered problem is NP-hard, GRASP based heuristic solution procedure was proposed. The proposed solution procedure consists of the construction phase where a feasible solution is found and the local search phase which improves the found solution.
To evaluate the performance of the proposed GRASP based algorithm, various data sets considering four design factors were randomly generated based on the Korean parcel delivery network. The performances of the algorithm were compared to the meta-heuristic algorithm proposed by Gelareh et al. (2015). Test results show that the algorithm proposed in this research is more robust than the existing algorithm against the fl uctuation of customer demand as well as it provides overall better results.
Even though many researchers have dealt with the parcel delivery network design problem, researches considering dynamic customer demand are scarce because of its complexity. Moreover, capacities of hubs are not considered even in those researches. The contribution of this research might be to propose the solution procedure considering both the capacity constraints and the dynamic customer demand. The proposed solution procedure might be the step stone to be compared for these problems.
This work was supported by Jungseok Logistics Foundation Grant.
References
Bowen, J. (2012). A spatial analysis of FedEx and UPS: hubs, spokes, and network structure. Journal of Transport Geography, 24(2), 419-431. https://dx.doi.org/10.1016/j. jtrangeo.2012.04.017.
Campbell, J. F. (1990). Locating transportation terminals to serve an expanding demand. Transportation Research Part B, 24(3), 173-192. https://dx.doi.org/10.1016/0191-2615(90)90015-Q.
Cheung, W., Leung, L. C., & Wong, Y. M. (2001). Strategic service network design for DHL Hong Kong. Interfaces, 31(4), 1-14. https:// dx.doi.org/10.1287/inte.31.4.1.9663.
Contreras, I., Cordeau, J., & Laporte, G. (2011). The dynamic uncapacitated hub location problem. Transportation Science, 45(1), 18-32. https://dx.doi.org/10.1287/trsc.1100.0326.
Ducret, R. (2014). Parcel deliveries and urban logistics: Changes and challenges in the courier express and parcel sector in Europe – The French case. Research in Transportation Business & Management, 11(10), 1274-1280. https://dx.doi.org/10.1016/j.rtbm.2014.06.009.
Ebrahimi-Zade, A., Hosseini-Nasab, H., Zare-Mehrjerdi, Y., & Zahmatkesh, A. (2016).
EM_2_2018.indd 94
95 2, XXI, 2018
Multi-period hub set covering problems with
fl exible radius: A modifi ed genetic solution. Applied Mathematical Modelling, 40(4), 2968-2982. https://dx.doi.org/10.1016/j. apm.2015.09.064.
Farahani, R. Z., Hekmatfar, M., Arabani, A. B., & Nikbakhsh, E. (2013). Hub location problems: A review of models, classifi cation, solution techniques, and applications. Computers & Industrial Engineering, 64(4), 1096-1109. https://dx.doi.org/10.1016/j.cie.2013.01.012.
Feo, T., & Resende, M. (1995). Greedy randomized adaptive search procedures. Journal of Global Optimization, 6(2), 109-133. https://dx.doi.org/10.1007/BF01096763.
Gelareh, S., Monemi, R. N., & Nickel, S. (2015). Multi-period hub location problems in transportation. Transportation Research Part E, 75(1), 67-94. https://dx.doi.org/10.1016/j. tre.2014.12.016.
Glover, F. (1989). Tabu Search-Part I. ORSA Journal on Computing, 1(3), 190-206. https://dx.doi.org/10.1287/ijoc.1.3.190.
Hayashi, K., Nemoto, T., & Nakaharai, S. (2014). The Development of the Parcel Delivery Service and its Regulations in China. Procedia – Social and Behavioral Sciences, 125(20), 186-198. https://dx.doi.org/10.1016/j. sbspro.2014.01.1466.
Hertz, A., & Widmer, M. (2003). Guidelines for the use of meta-heuristics in combinatorial optimization. European Journal of Operational Research, 151(2), 247-252. https://dx.doi. org/10.1016/S0377-2217(02)00823-8.
Jo, Y., Park, D., & Park, H. (2012). A study on network optimization of parcel service industry. The Korea Spatial Planning Review, 72(3), 102-120.
Jung, H., Lee, K., & Chun, W. (2006). Integration of GIS, GPS, and optimization technologies for the effective control of parcel delivery service. Computers & Industrial Engineering, 51(1), 154-162. https://dx.doi. org/10.1016/j.cie.2006.07.007.
Jung, S. Y., & Kim, S. M. (2015). MADM Analysis based optimal decision making methodology for location selection of parcel terminal. Journal of the Korean Society of Supply Chain Management, 15(1), 83-92.
Kim, T., Hwang, S., & Jung, Y. (2015). A study of supply chain design for point to point distribution network in logistics service industry. DAEHAN Association of Business Administration, 28(2), 735-747.
Lee, Y. S., Kim, M. Y., Kim, S. T., & Lee, Y. H. (2005). A study on supply chain network design of small package delivery service. Journal of the Korean Society of Supply Chain Management, 5(2), 43-52.
Sung, C. S., & Jin, H. W. (2001). Dual-based approach for a hub network design problem under non-restrictive policy. European Journal of Operational Research, 132(1), 88-105. https://dx.doi.org/10.1016/S0377-2217(00)00114-4.
Wasner, M., & Zapfel, G. (2004). An integrated multi-depot hub-location vehicle routing model for network planning of parcel service. International Journal of Production Economics, 90(3), 403-419. https://dx.doi. org/10.1016/j.ijpe.2003.12.002.
Prof. Hyun-Woong Jin, Ph.D. Hannam University Department of Business Administration South Korea [email protected]
EM_2_2018.indd 95
96 2018, XXI, 2
Abstract
RESTRUCTURING PARCEL DELIVERY NETWORK BY CONSIDERING DYNAMIC
CUSTOMER DEMAND
Hyun-Woong Jin
Parcel delivery service is one of the fastest growing industries in the world as the e-commerce such as online shopping mall expands rapidly. To increase its market share, most of parcel delivery service companies construct their delivery network as a form of hub-spoke network which is known to be effi cient to deliver large scale products through widely spread area. In hub-spoke network, the number of hubs and their locations are important decision issues. Even though there are many researches on the hub-spoke network design, there is a lack of researches which deal with the fl uctuating customer demand. Moreover, all the previous researches considering the fl uctuating customer demand assumed that the capacity of hub facility is unlimited. Therefore, this research aims to propose the restructuring procedure of the parcel delivery network by considering the fl uctuating customer demand with the capacitated hub facilities. In this research, utilization of temporary hubs is proposed so as to satisfy the fl uctuating customer demand. Temporary hub responds to the excessive demands assigned to the permanent hubs and it is closed during the recession period to reduce its operating cost. A nonlinear integer programming model is constructed to decide the number of temporary hubs and their location at each time period. Since the complexity of the constructed mathematical model is NP-hard, GRASP based heuristic solution procedure is proposed. To evaluate the appropriateness of the proposed algorithm, experimental test with various demand sets considering four design factors are performed and the performance of the proposed algorithm is compared with the existing meta-heuristic algorithm. Test results show that the algorithm proposed in this research is more robust than the existing algorithm against the fl uctuation of customer demand as well as it provides overall better results.
Key Words: Parcel delivery service, network design, meta-heuristics, GRASP.
JEL Classifi cation: M10, M110, C00.
DOI: 10.15240/tul/001/2018-2-006
EM_2_2018.indd 96