R E S E A R C H
Open Access
Automated approach for splicing detection
using first digit probability distribution
features
Archana V. Mire
1*, Sanjay B. Dhok
2, N. J. Mistry
1and Prakash D. Porey
2Abstract
Digital image tampering operations destroy inbuilt fingerprints and create own new fingerprint in the tampered region. Considering the Internet speed and storage space, most of the images are circulated in the JPEG format. In a single compressed JPEG image, the first digits of DCT coefficients follow a logarithmic distribution. This distribution is not followed by DCT coefficients of DCT grid aligned double compressed images. In a tampered image, the major portion of the original JPEG image is aligned double JPEG compressed. Hence, untampered region does not follow this logarithmic distribution. Due to the nonalignment of DCT compression grids, tampered region still follows this logarithmic distribution. Many tampering localization techniques have investigated this fingerprint, but the majority of them uses SVM classifier, specifically trained for the respective primary and secondary compression qualities of the test images. The efficiency of these classifiers is dependent on the knowledge of tampered image compression history. Hence, these approaches are not fully automated. In this paper, we have investigated a method, which does not require prior compression quality knowledge. Our experimental analysis shows that the addition of Gaussian noise can make the probability distribution of an aligned double compressed image similar to a nonaligned double compressed image. We divided the test image and its Gaussian version into sub-images and clustered them using K-means clustering algorithm. The application of K-means clustering algorithm does not require compression quality knowledge. This makes our approach more practical as compared to the other first digit probability distribution-based algorithms. The proposed algorithm gives compatible performance with the other approaches, based on different JPEG fingerprints.
Keywords:First digit probability distribution, JPEG forgery detection, Passive digital image forensic, Double compression, Gaussian noise
1 Introduction
With the sophisticated image editing tools, digital im-ages can be easily tampered with the great professional quality. This creates a big dilemma in the authenticity of the digital images. An image tampered and distributed through such tools may cause adverse effect on the society. Passive digital image forensic techniques investi-gate such digital images in the absence of any embedded security information. There exist various statistics such as CFA interpolation, resampling artifacts, motion blur, lightning intensity, reflections, edges, and JPEG fingerprint, which are consistent in the untampered images [1,2]. Re-cently in [3], the authors provided a comprehensive survey
of different forgery detection techniques such as copy-move forgery, splicing, resampling, and image retouching. Mostly, they covered pixel-based techniques, as these techniques do not require any a priori information about the type of tampering. In [4], the authors extracted sensor pattern noise from various images and clustered it using pairwise correlations among them. Thus, they clustered images captured by the same camera into the same cluster. Each SPN was treated as a random variable, and a Markov random field approach was employed to iteratively assign a class label to each SPN. However, they have validated their approach only on the gray images. In [5], the authors segmented image into small patches and computed noise variance of each patch using kurtosis concentration-based pixel-level noise estimation method. Later, suspicious region was identified by searching those conjunct patches,
* Correspondence:[email protected] 1SVNIT, Surat, India
Full list of author information is available at the end of the article
which are out of the linear constraint. In [6], the authors applied Gabor Wavelets and Local Phase Quantization to extract texture features at different scales and orientations to train SVM classifier. They claimed a comparable per-formance with much reduced feature dimensions. Being default image distribution format, JPEG fingerprint has emerged as one of the most important fingerprints. To hide the visual traces of image tampering, rotation and scaling are often applied to the tampered region. These basic tampering operations can be located in the double compressed images using JPEG fingerprints [7]. Most of the JPEG fingerprint-based forgery detection techniques locate aligned double JPEG (ADJPEG) compression arti-facts [7–12].
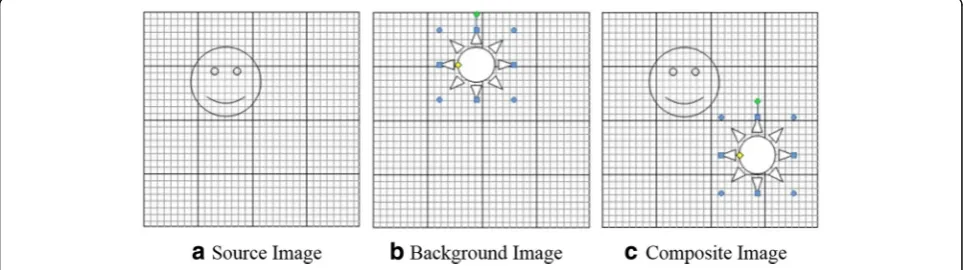
It is difficult to create a good tampering by aligning 8 × 8 DCT compression grids of the tampered region. At least some portion of the tampered region undergoes nonaligned double JPEG (NADJPEG) compression, where double compression artifacts are missing. Figure1 shows an example of tampering, where star segment from the source image (a) (compressed at qualityQ1) is copied and pasted into the destination image (b) (com-pressed at qualityQ2) to create composite double com-pressed image (c) (comcom-pressed at qualityQ3). Grids in Fig.1represent 8 × 8 DCT grid (shown with dark edges) used for compression. Star shape copied from source image (a) shows significant shifting within 8 × 8 grids in figure (c). Hence, the pasted star shape undergoes NADJPEG compression, while smiley shape and all remaining components of background image undergo ADJPEG compression. A tampered region is identified as a region, where aligned double JPEG compression ar-tifacts are missing.
The author in [8] used the difference between test image and its recompressed versions for locating ADJPEG compressed regions. He found the difference minimum, at the primary compression quality as well as at the secondary compression quality, called as ghost effect. In [9], the authors investigated the periodicity in the histogram of double quantized DCT coefficients in
ADJPEG compressed images. In [10], the authors used these periodicities and expectation maximization algo-rithm to generate the probability of each 8 × 8 block being DJPEG/NADJPEG compressed. In [13], the authors plot-ted the histogram of DCT coefficients inside the 8 × 8 blocks and at the edges of blocks. They showed that both the histograms overlap with each other for uncompressed images and show significant difference for the compressed images. In [14], the authors called this histogram differ-ence as a block artificial characteristic matrix (BACM). They have detected NADJPEG compressed images by investigating symmetry of this matrix. DCT coefficients of single compressed images follow a generalized Benford’s model; aligned double compressed images do not follow this model [15]. This model was further investigated in [11, 12, 16] for tampering localization. The authors in [11, 12, 16] used first digit probability distribution (FDPD) of single compressed images and their double compressed counterparts for training the SVM classifier. Thus, such investigation needs primary compression quality of the test image, without which accurate forensic investiga-tion is not possible. In [12], the authors showed that the probability distribution of the first digits“2,” “5,”and“7”is sufficient for forensic investigation. In [17], the authors combined the moments of characteristic function features with the FDPD features. They enhanced localization by training an SVM classifier with 436-D vector. Factor histo-gram of DCT coefficient shows double maxima in the ADJPEG compressed images [18]. This double maximum present in the factor histogram can be used to locate tam-pering present in the double compressed images [7]. In [19], the authors developed neuro-fuzzy inference system by combining features retrieved from discrete wavelet transformation (DWT) decompression and edge images based on gray level co-occurrence. In [20], the authors used CNNs for aligned and nonaligned double JPEG compres-sion detection. In particular, they explored the capability of CNNs to capture DJPEG artifacts directly from images. Their forgery detection and localization were based on the computation and analysis of a correlation matrix calculated
by recompressing the given (possibly tampered) image at dif-ferent quality factors and then comparing the recompressed versions with the given image. Our proposed scheme also captures DJPEG artifacts directly from the image. However, our scheme needs only single recompression, whereas algo-rithm in [20] requires multiple recompression. In this paper, we have explored the forensic application of FDPD, when compression history is not available.
The paper is organized as follows. In Section 2, we have discussed the FDPD of single and double com-pressed images. Section 3 investigates the possibility of blind NADJPEG compressed FDPD estimation. Based on our empirical analysis, we have proposed FDPD-based K-means clustering algorithm in Section 4. Since the performance of the proposed algorithm is compared to [7, 10–12], Section 5 shortly discusses these ap-proaches, its limitations, and how our proposed scheme overcomes these limitations. Experimental setup and performance analysis are discussed in Section 6. Finally, the paper concludes with the future work in Section7.
2 FDPD-based SVM classifier
As per Benford’s law [21], in a set of naturally generated data, the probability distribution of the first digitsd(d= 1, 2..9) follows the logarithmic nature as shown in Eq. (1).
p dð Þ ¼ log10ð1þ1=dÞ d¼1;2; :::9 ð1Þ
Wherep(d) stands for the probability of first digitd. DCT coefficients of an uncompressed image follow this law, and DCT coefficients of single compressed images can be fitted with a new logarithmic model using Eq. (2). This modified model is called as generalized Benford first digit probability distribution (GBFDPD) model. ADJPEG compressed images show significant divergence from this model [15].
p dð Þ ¼N log10ð1þ1=ðsþdqÞÞ d¼1;2;3::9 ð2Þ
WhereNis a normalization factor, which makesp(d) a probability distribution, s and q are the model parame-ters specific to the compression quality of an image.
Usually, secondary compression grids do not overlap with the primary compression grids of the tampered region. This leads to the logarithmic FDPD of the tampered region [15]. Hence, FDPD-based tampering localization techniques train SVM classifier using FDPD of single compressed images and their aligned double compressed counterparts [11,12]. These techniques div-ide the test image into sub-images and classify each of the sub-images using earlier trained SVM classifier. As these classifiers are trained using images at a specific compression quality, this will give the best performance for the test images compressed with the compression
quality of the training images. As the compression qual-ities of the test images starts deviating, the performance of the classifiers goes on decreasing. Whenever a new test image arrives for tampering localization,
compres-sion quality on the scale of (0–100) is unknown.
Although it is possible to guess the compression quality visually, it is not sufficient to apply the respective SVM classifier. Hence, practically, it is difficult to use the current FDPD-based forensic investigation techniques.
3 Blind estimation of FDPD of NADJPEG
As discussed in Section2, most of the FDPD-based algo-rithms use SVM classifier, which needs prior training with FDPD of single compressed images and double compressed images. FDPD of single compressed images serves as a feature of tampered region and FDPD of aligned double compress region serves as a feature of the untampered region. These classifiers perform well on tampered images with the same compression history. The major problem while using these classifiers is the knowledge of the primary and secondary compression qualities of the test image. If SVM classifier trained with different compression history than the test image is applied to test the image, the performance severely degrades. Although there exist some work to identify primary quantization steps [8, 18, 22], it is not sufficient to assess the exact primary compression quality. If these images are custom quantized, even primary quantization step computation is difficult [8].
We have used K-means clustering algorithm to elimin-ate this compression quality prerequisite. As K-means clustering algorithm does not require prior training, we do not need FDPD features of single compressed images. For a given test image, tampered region is NADJPEG compressed and follows FDPD, while untampered region being ADJPEG compressed does not follow it. Thus, an image is divided into clusters following FDPD and those not following FDPD, using K-means clustering algo-rithm. An image is divided intoB×Boverlapping sub-i-mages, and FDPD for the first 20 AC frequencies is computed. K-means clustering algorithm uses interclus-ter and intraclusinterclus-ter distances for clusinterclus-tering features into different classes. For a set of FDPD of m blocks (x1,
x2, .…xm), each distribution consists of probability of the
first digits 1 to 9 from the first 20 AC frequencies. These 180-D m observations are partitioned into two sets S
= {S1,S2} to minimize the within-cluster sum of square distances. In other words, the objective is to find S, as shown in Eq. (3).
arg min s
Xk
i¼1 X
x∈si x−μi
k k2 ð
3Þ
The K-means clustering algorithm uses an iterative refinement technique. Initially, dataset is randomly parti-tioned into two classes, and the initial means are computed for both the classes. In the next phase, for an initial set of means μ1
1;μ12, the algorithm proceeds by
alternating between assignment step and update step. During assignment step, each observationxpis assigned
to the cluster whose mean has the least squared Euclid-ean distance as shown in Eq. (4).
Sð Þin ¼ xp:xp−μð Þin 2
≤xp−μð Þjn2∀j;1≤j≤2
ð4Þ
Where nis the iteration number and pis the sample number.
In the update state, the new means are updated as per the centroids of the observation in the new cluster, as shown in Eq. (5).
μðnþ1Þ
i ¼
1
Sð Þin
X
xj∈Sð Þit
xj ð5Þ
The algorithm converges when the assignment no lon-ger changes. Thus, this approach does not require know-ledge of prior compression history and assign samples to different classes iteratively. Generally, the size of the tampered region is very small as compared to the untampered region. For proper clustering, the number of features should be sufficiently large. Hence, initially, algorithm was not able to cluster these features. As the size of untampered feature set was sufficiently large, we have investigated the possibility of increasing the size of a tampered feature set.
3.1 Impact of Gaussian noise on FDPD
JPEG compression involves 8 × 8 block DCT transform. Resultant DCT distribution modeled as a Gaussian dis-tribution, which follows generalized Benford’s model [15]. JPEG compression uses 8 × 8 quantization steps for quantizing each of the 8 × 8 DCT coefficients. When uncompressed image gets single compressed, its DCT coefficientsc0are quantized with step q1. After neglect-ing quantization and roundneglect-ing error, the resultant dequantized coefficientc1is shown in Eq. (6).
c1¼½c0=q1 q1 ð6Þ
The operator [.] represents the rounding operation, which maps the set of unquantized DCT coefficients to the same value of dequantized coefficientc1. Due to the property of rounding operation, the probability distribu-tion of DCT coefficients at a specific frequency in 8 × 8 blocks can be shown in Eq. (7).
p1ðc1;q1Þ ¼
Xq1ðc1þ1=2Þ
c0¼q1ðc1−1=2Þp0ð Þc0 ð7Þ
During secondary compression, these coefficients c1 are quantized with stepq2and the resultant dequantized coefficientsc2are shown in Eq. (8).
c2¼½½c0=q1 q1=q2 q2 ð8Þ
Due to DCT grid aligned double JPEG compression, all DCT coefficients present at a specific frequency in 8 × 8 blocks are quantized with the same set of quantization steps q1∈Q1and q2∈Q2respectively, whereQ1and Q2 represents the primary and secondary quantization tables. The resultant probability distribution of dequantized coef-ficients can be shown using Eq. (9).
p2ðc2;q1;q2Þ ¼
Xq2ðc2þ1=2Þ
c1¼q2ðc2−1=2Þp1ð Þc1 ð9Þ
When q2<q1, the set of unquantized DCT coefficients
c0map to the same value of the secondary dequantized
DCT coefficient c2. This increases the numbers of
certain DCT coefficients, while certain DCT coefficients are completely removed from the ADJPEG compresses image. In [9], the authors proved this periodicity with a set of one-dimensional data. Since the logarithmic FDPD followed by naturally generated random data, periodic aligned double compressed DCT coefficients show diver-gence with it. When an image undergoes nonaligned double compression, there is no fixed relationship between quantization steps q1 and q2. Hence, periodic quantization artifacts are not introduced in the secondary dequantized DCT coefficients [13]. Random quantization artifacts maintain randomness in the DCT coefficient distribution, and logarithmic FDPD is maintained in these coefficients.
coefficients still follow Gaussian distribution and obey logarithmic FDPD.
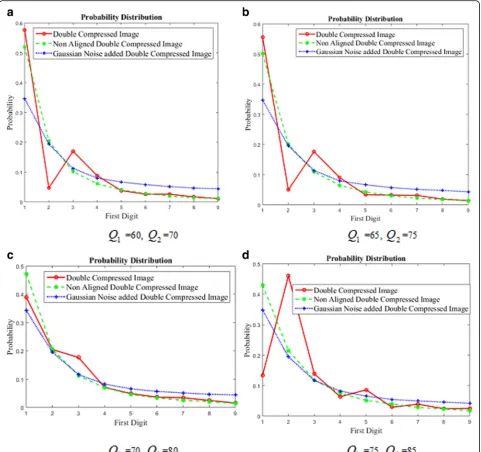
3.2 Empirical analysis of Gaussian noise on FDPD
The possibility of data modeling Benford’s law can be verified using tests such as mantissa test, chi-square test, and the geometric distribution. As these tests also analyze the actual data values, there is no formal math-ematical proof, which will confirm Benford’s model [25]. The logarithmic nature of FDPD is verified empirically by actually plotting FDPD of the data [15,16]. Hence, to verify the above effect, we have added zero mean Gauss-ian noise to the images from UCID database [26]. This database consists of 1338 uncompressed images in TIFF format. Each of the uncompressed images was single compressed, ADJPEG and NADJPEG compressed at various compression qualities. Figure 2 shows the aver-age FDPD of all imaver-ages in each category. Due to the space constraint, it is not possible to show FDPD at all qualities, but we found the same impact at other qual-ities. This shows that, as per discussion in [11, 12, 15, 16], FDPD of ADJPEG images is non-logarithmic. After adding Gaussian noise, FDPD becomes logarithmic. Thus, it is verified that the addition of Gaussian noise makes FDPD of ADJEPG compressed images logarith-mic. This distribution can be used to increase the sam-ple features of the NADJPEG compressed region. Thus, features of both the classes become sufficiently large and clustering algorithm can be applied.
4 Proposed approach
As per the earlier discussion, the proposed localization algorithm creates a noisy version of the test image by adding zero mean Gaussian noise to it. Test image and
noisy image are divided into B×B overlapping
sub-images, and FDPD for the first 20 AC frequencies is computed. Thus, the features of both the classes become sufficiently large for clustering. We have applied K-means clustering algorithm on these features to cluster them in two different classes as shown below.
If test image Iis of size M×Nand block size consid-ered isB, then algorithm will have (M−B+ 1)(N−B+ 1) iterations for generating FDPD features of all the blocks. All other FDPD-based algorithms will also require the
same number of iterations to generate these features. To
cluster n number of d dimensional samples into k
number of clusters, K-means clustering algorithm re-quires time complexity O(ndk+ 1). Hence, the proposed algorithm hasO([(M−B+ 1)(N−B+ 1)]2d+ 1) time com-plexity. Since we are considering nine FDPD of the first 20 frequencies, all the samples are 180 dimensional, and accordingly, time complexity of the proposed algorithm isO([(M−B+ 1)(N−B+ 1)]361).
5 Method of [7,10–12]
Like most of the JPEG artifact-based forensic techniques, algorithms in [7,10–12] also use DCT coefficients at a re-spective AC frequency. In [7], the primary quantization table was computed using factor histogram. As discussed earlier, aligned double quantization with stepq1followed by
q2maps the set of primary DCT coefficientsc1to the same secondary coefficientsc2. The set of coefficientsc1mapping
to the same values ofc2 can be computed using
quantization step q2 and coefficient c2. The histogram of the factors of this set is called as factor histogram [18]. It has maximum frequency up to stepq2as well as at a step
q1. Thus, the primary quantization steps can be detected. Similar to other approaches, [7] also has investigated DCT grid aligned blocks. Tampered region was assumed as NADJPEG compressed, while untampered region was assumed as ADJPEG compressed. Each block was catego-rized as tampered/untampered depending on the second maxima in the block factor histogram. Ideally, the second maxima in factor histogram should be available at primary quantization step. However, it may not necessarily be absent at nearby quantization step. In such cases, the com-puted primary quantization step will be wrong and the per-formance of the algorithm may degrade. As our proposed algorithm is not computing any specific quantization step and using distribution of DCT coefficients, it does not suf-fer with little changes in DCT coefficients.
position of DCT grid was further used to measure quantization errors. Shifting DCT grid at different posi-tions in 8 × 8 block means one has to try 64 posiposi-tions of recompression grids and analyze these 64 DCT coefficient histograms. This increases the computational complexity of the algorithm. Authors has used parallel processing approach to reduce this time. Neither the proposed approach nor [7, 12] needs to compute these errors. In our proposed approach, single recompression is enough to get the statistics of nonaligned double compressed re-gion from the aligned double compressed image, after adding Gaussian noise to it.
Forensic approach in [11, 12] has investigated FDPD, but its use has a practical limitation. If the tampered test image has the primary compression quality Q1and sec-ondary compression qualityQ2, an SVM classifier needs to be trained using single compressed images of quality
Q1and their double compressed counterparts at quality
Q2. In real life, one rarely knows the primary compres-sion history of the test image. They trained SVM classi-fier using FDPD of DCT coefficients at the first 20 AC frequencies. They also had a forensic investigation by divid-ing an image into DCT grid aligned images. Each
sub-image was individually classified as tampered or
untampered using FDPD. The authors in [12] used FDPD of digits 2, 5, and 7 while in [11], all nine FDPD were used. As [11] uses all nine FDPD (1,2...9), [12] cannot perform better than [11]. As our proposed algorithm is not using SVM classifier, it does not require classifier training, which is very specific to the primary and secondary compression qualities of test image. Since the test image is recom-pressed using the secondary quantization table present in the test image itself, the primary compression history at all is not required. Thus, our proposed algorithm can work even on an image having customized quantization table. This is not possible with [11, 12], as it requires primary quantization table while training SVM classifier.
6 Results and discussion
The proposed algorithm is implemented with MATLAB (R2011a), 64-bit version, and P. Sallee MATLAB JPEG toolbox [27] was used for reading DCT coefficients. Like the other standard experimental setups [10–12, 16], we have also created random tampered images using uncom-pressed TIFF images from UCID database [26]. Each image was compressed at the primary compression quality
Q1, and random 120 × 120 DCT grid nonaligned source image blocks were copied to create tampered images. While tampering an image, the pasted block borders are aligned with the DCT grids of the destination image. Re-sultant images were compressed at a secondary compres-sion qualityQ2(Q2>Q1). For investigation, each of the test images were divided into 40 × 40 non-overlapping sub-images. Thus, we are aware that sub-images are actually tampered (NADJPEG)/untampered (ADJPEG). The out-put of the classifier can be directly compared to this.
Since [11,12] needs special setup, we have trained vari-ous quality-specific SVM classifiers using single com-pressed and aligned double comcom-pressed images at different compression qualities. As [11] is expected to per-form better than [12], practical limitations are shown only
for [11]. For this, we have tested each of the test images by applying SVM classifiers trained for different compression qualities. The results of [12] are plotted by applying SVM classifier trained with exact compression quality. Since [7,10] and proposed approach do not require a compression history and prior training, no special setup was needed.
For each of the test sub-images, the output of the clas-sifier was compared with its actual class to compute misclassification error rate as shown in Eq. (10).
miserr¼X
N
i¼1
T ið Þ≠C ið Þ=N
ð10Þ
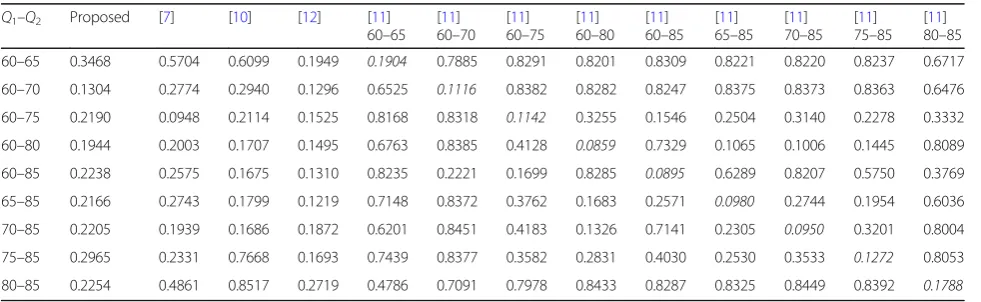
Where T(i) represents the original class of the sub-imagei,C(i) represents the class assigned by supervised/ unsupervised classifier and N represents the total num-ber of sub-images in the test case. Table 1 shows the misclassification error rate generated by different algo-rithms. The first column of this table mentions the pri-mary and secondary compression qualities of the test images. Remaining columns show the observed mis-classification error rate for each of the algorithms. As [11] was investigated by applying different trained SVM classifiers, columns 6 to 14 show the respective mis-classification error rate. Top of these columns mentions the compression history of the training images. When training and test images had a same compression his-tory, misclassification rate is marked in bold.
Figure 3 shows a graphical representation of these misclassification error rates. As [11] was tested by apply-ing different SVM classifiers with different trainapply-ing his-tory, we have plotted its best misclassification error rate (represented in bold, when training and test image com-pression qualities are same), as well as an average mis-classification error rate (average of each row for [11] in Table 1). Since [12] does not perform better than [11] even when compression qualities of training and test
Table 1Misclassification error rate for randomly tampered images
Q1–Q2 Proposed [7] [10] [12] [11]
60–65 [11] 60–70
[11] 60–75
[11] 60–80
[11] 60–85
[11] 65–85
[11] 70–85
[11] 75–85
[11] 80–85
60–65 0.3468 0.5704 0.6099 0.1949 0.1904 0.7885 0.8291 0.8201 0.8309 0.8221 0.8220 0.8237 0.6717
60–70 0.1304 0.2774 0.2940 0.1296 0.6525 0.1116 0.8382 0.8282 0.8247 0.8375 0.8373 0.8363 0.6476
60–75 0.2190 0.0948 0.2114 0.1525 0.8168 0.8318 0.1142 0.3255 0.1546 0.2504 0.3140 0.2278 0.3332
60–80 0.1944 0.2003 0.1707 0.1495 0.6763 0.8385 0.4128 0.0859 0.7329 0.1065 0.1006 0.1445 0.8089
60–85 0.2238 0.2575 0.1675 0.1310 0.8235 0.2221 0.1699 0.8285 0.0895 0.6289 0.8207 0.5750 0.3769
65–85 0.2166 0.2743 0.1799 0.1219 0.7148 0.8372 0.3762 0.1683 0.2571 0.0980 0.2744 0.1954 0.6036
70–85 0.2205 0.1939 0.1686 0.1872 0.6201 0.8451 0.4183 0.1326 0.7141 0.2305 0.0950 0.3201 0.8004
75–85 0.2965 0.2331 0.7668 0.1693 0.7439 0.8377 0.3582 0.2831 0.4030 0.2530 0.3533 0.1272 0.8053
80–85 0.2254 0.4861 0.8517 0.2719 0.4786 0.7091 0.7978 0.8433 0.8287 0.8325 0.8449 0.8392 0.1788
images are same, we have not shown its average mis-classification error rate. From Fig. 3, we can conclude that [11, 12] gives the best performance, but as test image compression qualities divert from training qual-ities, the performance degrades. All the remaining ap-proaches, including our proposed algorithm, perform differently at different compression qualities. At the qualities 60–65, 60–70, and 80–85, our proposed algo-rithm gives the best performance. At quality 60–75, [7] gives the best performance. In between 60–80 and 70– 85, [10] performs best. Hence, there is not a single method, which may perform better at all compression qualities. Different compression artifacts have different
strength at different compression qualities. At lower compression qualities and at lower quality differences, most of the algorithms except [11, 12] fail (error rate greater than 0.4). However, our proposed algorithm still gives comparable performance.
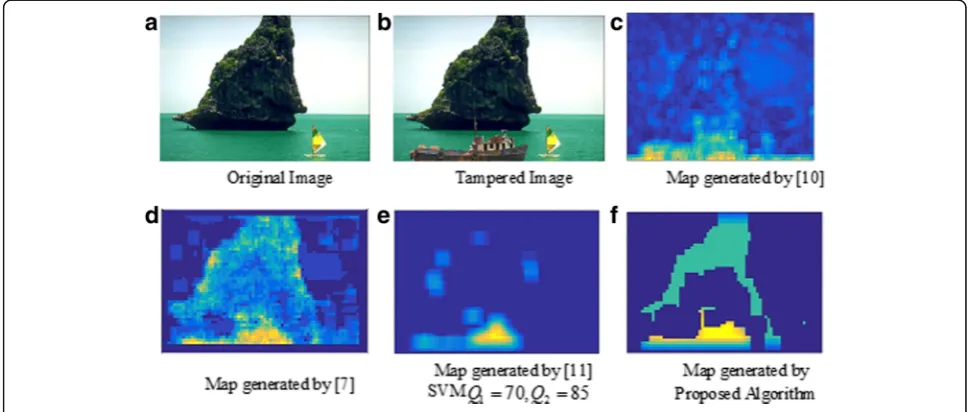
We have also tested these algorithms on tampered image database CASIA V.2 [28]. On some of the images, we got very promising results. As the compression history of these images was not available, it was difficult to evaluate the performance of localization algorithms. Figure 4a, bshows the original image and its tampered version from CASIA V.2 [28]. Figure 4c–f shows the tampering localization map generated by applying Fig. 3Misclassification error rate
[7, 10, 11] and proposed algorithm on the tampered image (b). For testing [11], we have applied various SVM classifiers having different training compression
history. Figure 4e shows the best possible outcome
and respective training compression history for [11]. The output is represented as the probability of each pixel being tampered. The higher value of probability is assigned to NADJPEG tampered pixels (yellow color), and untampered region appears with a lower index value (shown with blue colors). The output map generated by proposed algorithm is comparable with the other algorithms. Algorithm in [10] locates the sufficiently large tampered region, but it is diffi-cult to select a final tampered region. For [10], the yellow color untampered boat also comes out as tampered, along with the tampered segment of the ship. For [11], when we applied several classifiers hav-ing a different trainhav-ing compression history, we could get comparable output at a training quality sequence 70, 85. However, it locates very small portion of the actual tampered region.
Figure 5 shows one more localization example. Here, the map generated by [10] is at all not useful for forensic investigation. Algorithm in [7] generates traceable map, but it is not sufficient to make critical decisions. Due to the unavailability of primary compression quality, we could not get comparable output for [11]. Compara-tively, our proposed algorithm has generated robust out-put, sufficient to make a decision.
To evaluate algorithms against realistic tampering, 100 tampered images were blindly created using different source images. Each image was tampered by pasting segment from the same image as well as from the other images using PIXLR online image editing tool [29]. To make tampering convincing, different pre-processing
operations such as lightning adjustment, color balance, contrast stretching, up sampling, down sampling, and rotation were applied to the tampered region. Compres-sion history was unknown to us. For [11], each image needs to be investigated by applying classifiers with differ-ent training historyQ1= 60..100,Q2=Q1+ 1..100. Due to this classifier training dependency, we could not compare [11] for these images. For accurate localization, overlap-ping block processing was very necessary. Hence, we have applied these algorithms with 8 × 8 overlapping. Since tampered region spans across 8 × 8 blocks nonuniformly, the misclassification error rate was computed at pixel level. If any of the 40 × 40 blocks classified as a tampered, all overlapping pixels were classified as tampered, irre-spective of the decision made by the other overlapping blocks. Accordingly, in Eq. (8),T(i) represents the original class of the pixeli,C(i)represents the class assigned by the classifier, and Nrepresents the total number of pixels in an image. Table2 shows the corresponding misclassifica-tion error rate. Our proposed approach gives comparable performance with other machine learning/non-machine learning-based approaches.
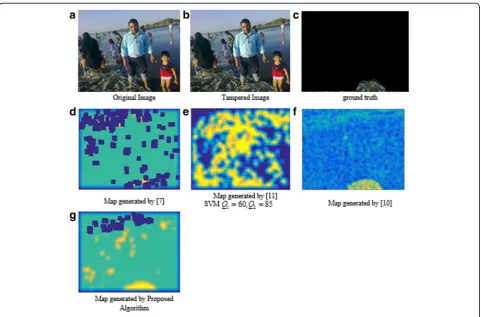
Figure6shows one of the examples of such tampering localization. In this tampered image (b), source (a) and destination (a) of tampered region are the same. Seg-ment of water is copied from an image and pasted into the same image to hide the right leg of a man standing in the sea. The copied region was resampled before past-ing. Figure 6c shows the ground truth of the tampered region. Figure 6d–g shows the outputs of various tam-pering localization algorithms. Although [7] works with-out prerequisite of compression quality knowledge, it did not work for this tampered image. It locates very small portion of the tampered region, along with some other untampered region. The located true tampered
region and false tampered region have nearly the same size, which makes it difficult to make any decision. As compression qualities are not available, we have applied various SVM classifiers with different training compres-sion history for [11]. The output for [11] is plotted in (e), which is again of no use to make decisions. The algorithm in [10] locates only the tampered region. However, the tampering probability assigned to the re-gion is very low and not continuous. Our proposed algo-rithm clearly locates the continuous tampered region. Although there exist some small falsely identified tam-pered regions, its size is very small. After considering connected components, original tampered region will appear as a largest connected component with high tam-pering probability. Thus, although misclassification rate of proposed scheme is a little bit more than [7, 10], its output map is more useful than the other algorithms. The proposed algorithm and the algorithm in [10] can be used to cross validate each other.
7 Conclusions
The discrepancy in double compression artifacts is an indicator for most of the tampering operations. We have shown that the DCT coefficients of aligned double compressed image do not follow first digit probability distribution. However, DCT coefficients of single compressed and nonaligned double compressed image follow it. In addition, we have also shown that the additive Gaussian noise in the aligned double compressed images makes resultant first digit prob-ability distribution logarithmic. Hence, proposed algo-rithm does not need features of single compressed images and is able to work in the absence of prior knowledge of primary compression history of the test image. Thus, its efficiency is not dependent on the pre-trained classifier, specific to the compression his-tory of the test images. Validity of the proposed
algo-rithm has been demonstrated by computing
misclassification error rate. The effectiveness of the proposed algorithm is also confirmed by the realistic test images in the absence of image compression his-tory. Performance analysis shows that different com-pression artifacts perform at different comcom-pression qualities. Hence, multiple artifacts need to be fused to devise an algorithm performing at all the compression Table 2Misclassification error rate for manually tampered
images
Proposed approach [7] [10]
Misclassification error rate 0.236585 0.214694 0.213455
qualities. Algorithms discussed here are not robust against antiforensic attacks. In the future, we will try to address these issues in our research.
Acknowledgements
Not applicable.
Funding
This study received funding from PhD contingency grant and fellowship assigned by Sardar Vallabhbhai National Institute of Technology, under MHRD, India.
Availability of data and materials
The datasets analyzed during the current study are as follows: CASIA V.2 tampered image database,http://forensics.idealtest.org/casiav2/; UCID—an uncompressed color image database,http://jasoncantarella.com/downloads/ ucid.v2.tar.gz; and self-created database,https://drive.google.com/drive/ folders/0B11DqvnKC0SGdElDZ2tjVmJKMFE?usp=sharing.
Authors’contributions
We have proposed a reliable algorithm which automatically locates the spliced region in a double compressed tampered image. The tampered region is assumed as NADJPEG compressed region, and untampered region is assumed as ADJPEG compressed region. We have used first digit probability distribution of DCT coefficients to cluster tampered and untampered region into two different classes. Aiming at overcoming limitations in [11,12], the proposed algorithm makes the following improvements: (1) it does not require prior compression quality knowledge, (2) it uses K-means clustering algorithm to cluster ADJEG and NADJPEG compressed region, (3) it is shown that if image is recompressed after the addition of Gaussian noise, resultant DCT coefficients follow the first digit probability distribution, and (4) this recompressed version can be used to increase sample NADJPEG compressed features. The algorithm is evaluated by the following standard process of creation of random tampered images from untampered, uncompressed UCID database color images. The algorithm is also evaluated against real-life tampered images from CASIA V.2 database. In addition, algorithm is evaluated against our own dataset, where tampering is visually indistinguishable. To compare algorithm against standard machine learning and non-machine-based algorithms, performance is compared using misclassification error rate. All the authors have read and approved the manuscript.
Ethics approval and consent to participate
Not applicable.
Consent for publication
Not applicable.
Competing interests
The authors declare that they have no competing interests.
Publisher’s Note
Springer Nature remains neutral with regard to jurisdictional claims in published maps and institutional affiliations.
Author details
1
SVNIT, Surat, India.2VNIT, Nagpur, India.
Received: 16 February 2016 Accepted: 22 February 2018
References
1. A Piva, An overview on image forensics. ISRN Signal Proc 2013, 22 (2013).
https://doi.org/10.1155/2013/496701. Article ID 496701
2. H Farid, Image forgery detection, a survey. IEEE Signal Process. Mag. (2009) 3. Muhammad Ali Qureshi, Mohamed Deriche, A bibliography of pixel-based
blind image forgery detection techniques, In Signal Processing: Image Communication, Volume 39, Part A, 2015, Pages 46–74, ,https://doi.org/10. 1016/j.image.2015.08.008.
4. C-T Li, X Lin, A fast source-oriented image clustering method for digital forensics. EURASIP J Image Video Proc69(2017)https://doi.org/10.1186/ s13640-017-0217-y
5. H Yao, F Cao, Z Tang, J Wang, T Qiao,Expose Noise Level Inconsistency Incorporating the Inhomogeneity Scoring Strategy, Article in Multimedia Tools and Applications(2017).https://doi.org/10.1007/s11042-017-5206-8
6. MM Isaac, M Wilscy, Multiscale local gabor phase quantization for image forgery detection.Multimedia Tools and Applications, 1–22 (2017)https:// doi.org/10.1007/s11042-017-5189-5
7. AV Mire, SB Dhok, NJ Mistry, PD Porey, Factor histogram based forgery localization in double compressed JPEG images. Procedia Comput Sci54, 690–696 (2015) 8. H Farid, Exposing digital forgeries from JPEG ghosts, IEEE transactions on
information forensics and security. Vol.4(1), 154–160 (2009)
9. Z Lin, J He, X Tang, C-K Tang, Fast, automatic and fine-grained tampered JPEG image detection via DCT coefficient analysis. Pattern Recognition, Vol
42, 2492–2501 (2009)
10. T Bianchi, A Piva, Image forgery localization via block-grained analysis of JPEG artifacts. IEEE Transactions on Information Forensics Security7(3), 1003–1017 (2012)
11. XH Li, YQ Zhao, M Liao, FY Shih, YQ Shi, Detection of the tampered region for JPEG images by using mode-based first digit features. EURASIP Journal on Advances in Signal Processing190, 2012 (2012)
12. I Amerini, R Becarelli, R Caldelli, A Del Mastio, Splicing forgeries localization through the use of first digit features. proceedings of IEEE International Workshop on Information Forensics and Security(WIFS),143-148 (2014).
https://doi.org/10.1109/WIFS.2014.7084318
13. Z Fan, RL de Queiroz, Identification of bitmap compression history: JPEG detection and quantizer estimation. IEEE Transaction on Image Processing, Vol 12(2), 230–235 (2003).https://doi.org/10.1109/TIP.2002.807361
14. W Luo, Z Qu, J Huang, G Qiu, A novel method for detecting cropped and recompressed image block. IEEE Int Conference Acoustics Speech Signal Proc (2007)
15. Dongdong Fu, Yun Q. Shi, Wei Su. A Generalized Benford’s Law for JPEG Coefficients and its Applications in Image Forensics, SPIE Conference on Security, Steganography, and Watermarking of Multimedia Contents, 2007 16. B Li, YQ Shi, J Huang,Detecting Doubly Compressed JPEG Images by Using
Mode Based First Digit Features(IEEE International Workshop on Multimedia Signal Processing, Queensland, 2008), pp. 730–735
17. F Zhao, YU Zhenhua, S Li, Detecting double compressed JPEG images by using moment features of mode based DCT histograms. proceedings of 2010 International Conference on Multimedia Technology,1-4 (2010).
https://doi.org/10.1109/ICMULT.2010.5631476
18. J Yang, G Zhu,Detecting Doubly Compressed JPEG Images by Factor Histogram(Proceeding of APSIPA, ASC, 2011)
19. H Ghaffari-Hadigheh, GB Sulong,Annual Iranian mathematics conference
(Hamedan, 2017)
20. M Barni, L Bondi, N Bonettini, P Bestagini, A Costanzo, M Maggini, B Tondi, S Tubaro, Aligned and non-aligned double JPEG detection using
convolutional neural networks. J. Vis. Commun. Image Represent.49, 153– 163 (2017)https://doi.org/10.1016/j.jvcir.2017.09.003
21. F Benford, The law of anomalous numbers. Proc. Amer. Phil. Soc.78, 551– 572 (1938)
22. J Lukas, J Fridrich, Estimation of primary quantization matrix in double compressed JPEG images. Proc Digital Forensic Res Workshop, 1–17 (2003) 23. D Zoran, Y Weiss, Scale invariance and noise in natural images. IEEE 12thInt
Conference Comput Vision, 2209–2216 (2009)
24. R Zhang, X-g YUJ Zhao, JY Liu, Symmetric Alpha Stable Distribution Model Application in Detecting Double JPEG Compression. Proc International Conference on Artificial Intelligence and Software Engineering(AISE2014), 462-467(2014)
25. M Nigrini, JT Wells, Benford’s Law: Applications for Forensic Accounting, Auditing, and Fraud Detection,Wiley Publication, 19-21(2012) ISBN: 978-1-118-15285-0
26. G Schaefer, M Stich,UCID—An Uncompressed Colour Image Database
(Technical Report, School of Computing and Mathematics, Nottingham Trent University, U.K, 2003)
27. P. Sallee, Matlab JPEG toolbox 1.4, [online], Available:http://dde. binghamton.edu/download/jpeg_toolbox.zip
28. CASIA Tampered image detection evaluation database http ://forensics.
idealtest.org:8080/ index_v2.htm