ABSTRACT
Emphysema is a common chronic respiratory disorder characterised by the destruction of lung tissue. A standard approach used for emphysema detection in medical image analysis and other computerized techniques used for classification of emphysema. The Cancer detection and classification of histopathological images is the standard clinical practice for the diagnosis and prognosis of any cancer. In this paper we present the cancer detection and classification of benign and malignant tumour (Nuclei) based on H & E stained histopathology and colour segmentation based staining method to distinguish the different types of tissues in biomedical application. Nucleus detection in H&E is a challenging problem considering the variability, heterogeneity, low contrast, K means clustering, and differing typologies of nuclei to distinguish different types of tissues. There are strong indications that morphological analysis in H&E can serve as a biomarker. This paper is about developing a image processing method for H&E stained cancer images and these method which helps pathologists to distinguish different types of tissues in biomedical applications. The segmentation approach is completely colour based and uses k-means clustering technique uses a series of algorithm steps which is an image processing approach in distinguishing the different tissue types. These algorithm steps are modelled in image processing tool box of MATLAB v7.0. Modelling steps involved are from reading the image to segmentation of the nuclei into a separate image in MATLAB real-time simulation environment.
Keywords
Emphysema, Histopathology, H&E staining, K means clustering, Color Segmentation, Image Processing, MATLAB.
1.
INTRODUCTION
Chronic obstructive pulmonary disease (COPD) is one of the most common lung diseases. There are two main forms of COPD are Chronic Bronchitis, defined by a long-term cough with mucus and Emphysema. COPD is currently the fourth leading cause of death worldwide [1] Emphysema is a long-term, progressive disease of the lung (s) and occurs when the alveolar walls are destroyed along with the capillary blood vessels that run within them. Emphysema is also a component of aging. As the lungs get older, the elastic properties decrease, and the tensions that develop can result in small areas of emphysema and in some cases owing to the consequences of alpha1-antitrypsin deficiency. Smoking is one major cause of this destruction. It is very vital importance to develop methods for diagnosing emphysema, both for clinical and research use [2]. A common approach to detecting emphysema is called ‗‗density mask‘‘ which is simply a
thresholding technique [2]. Recently, Friman et al. [2] combined image processing and neural networks into an emphysema detection system that produces high accuracy and reproducibility. Emphysema, along with other diffuse lung diseases, is a disease where textural features have been used widely for detection [2, 3]. In India the prevalence rates of COPD in males varied from 2.12% to 9.4% in studies conducted in north India and from 1.4% to 4.08% in south India. The respective ranges for females were 1.33%–4.9% in north India and 2.55%– 2.7% in south India. The median values of these prevalence rates are 5% for males and 2.7% for females [5]. Therefore, early diagnosis of emphysema is very important, since the cessation of smoking can limit the progression of the disease. Emphysema diagnosis consists of a physical examination, laboratory tests [6] and imaging methods. A computed tomography (CT) scan [4] is a more specific and sensitive test for diagnosing emphysema and can accurately determine the size of air pockets in the lungs [7, 8]. This imaging technique may even be useful for assessing mild lung disease and evaluating surgical options. As a result, the amount of time and labor spent on diagnosing emphysema are immense.In recent years, considerable efforts have been made in computer-aided diagnosis (CAD) using medical images to improve a clinician's confidence in the analysis of medical images. Evaluation of medical images by a clinician is qualitative in nature and may vary from person to person. It has been proven that double reading of medical images could lead to better disease detection. But the cost incurred in double reading is very high; therefore good software to assist radiologists in medical institutions is of great interest nowadays. A lot of research efforts have been directed in the field of 'Medical Image Analysis' with the aim to assist in diagnosis and clinical studies. In this work a computer aided diagnosis system for Emphysema images is developed using MATAB.
2.
MATERIALS AND METHODS
A. Design of Algorithm
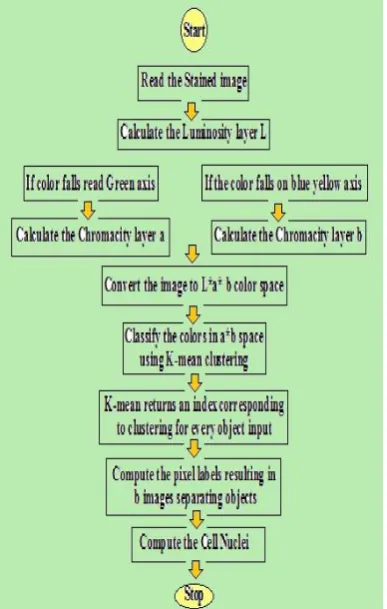
The different steps involved in design of algorithm are explained as follows:
1. Reading the image
25
Figure. 1. Input image H&E stained Emphysema
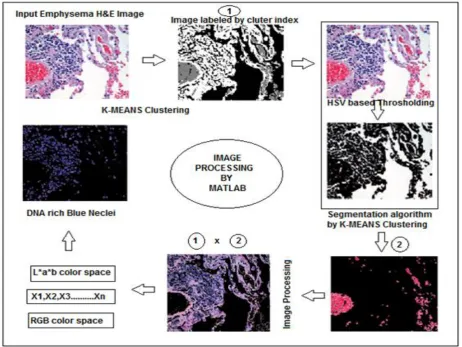
2. Convert Image from RGB Colour Space
to L*a*b* Colour Space
This step is based on the different colours that we see in the image if the variations in the brightness are ignored. Basically in the input image there are three colours white, blue, and pink by converting RGB colour space into L*a*b colour space we can visually distinguish these colours from one another. The L*a*b* color space is derived from the CIE XYZ tristimulus values. The L*a*b* space consists of a luminosity layer 'L*', chromaticity-layer 'a*' indicating where color falls along the red-green axis, and chromaticity-layer 'b*' indicating where the color falls along the blue-yellow axis. All of the color information is in the 'a*' and 'b*' layers. We can measure the difference between two colors using the Euclidean distance metric.
3. Classify the Colors in 'a*b*' Space
Using K-Means Clustering.
Clustering is a way to separate groups of objects. K-means clustering treats each object as having a location in space. It finds partitions such that objects within each cluster are as close to each other as possible, and as far from objects in other clusters as possible. K-means clustering requires that you specify the number of clusters to be partitioned and a distance metric to quantify how close two objects are to each other. Since the color information exists in the 'a*b*' space, our objects are pixels with 'a*' and 'b*' values. Use kmeans to cluster the objects into three clusters using the Euclidean distance metric.
4. Label Every Pixel in the Image Using
the Results from KMEANS
[image:2.595.328.534.73.235.2]For every object in the input, kmeans returns an index corresponding to a cluster. The cluster_center output from kmeans will be used for determining the three cluster images. Labeling has to be done for every pixel in the image with its cluster index.
Figure 2. Image labeled by Cluster index
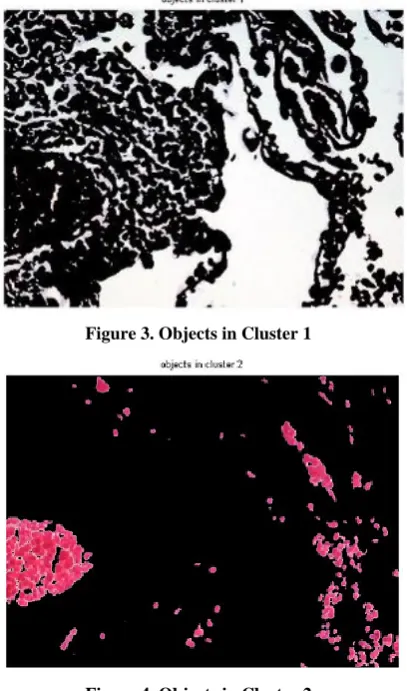
5. Create Images that Segment the H&E
Image by Colour.
Using pixel_labels, we can separate objects in the input image by color, which will result in three different images as seen in the figures below.
[image:2.595.329.533.320.666.2]Figure 3. Objects in Cluster 1
Figure 5. Objects in Cluster 3
6. Segment the Nuclei into a Separate
Image.
[image:3.595.66.269.432.598.2]Here we notice that there are dark and light blue objects in one of the clusters. We can separate dark blue from light blue using the 'L*' layer in the L*a*b* color space. The cell nuclei are dark blue. Also the 'L*' layer contains the brightness values of each color. The cluster that is found contains the blue objects. After finding the cluster containing blue objects we extract the brightness values of the pixels in this cluster and threshold them using im2bw.The next step is to programmatically determine the index of the cluster containing the blue objects because kmeans will not return the same cluster_idx value every time. We can do this using the cluster_center value, which contains the mean 'a*' and 'b*' value for each cluster. The blue cluster has the smallest cluster_center value (determined experimentally).
Figure 6. DNA rich Blue Nuclei
In the further section we are describing the flow diagram of the project which gives the basic idea of the image processing software developed in MATLAB.
FLOWCHART IMPLEMENTATION
The flow chart is derived from the algorithm based on the algorithm above steps.
The source code is implemented in the MATLAB 7.0 and the output simulation results are obtained in the real time simulation environment
3.
RESULTS AND DISCUSSION
27
Fig 1: If necessary, the images can be extended both columns
In the present study an effort had been made to nuclei detection using the spatial information on cell nuclei distribution. Our results indicate that the number density of dispersed chromatin cell nuclei and the number density of other cellular components function as grade differentiating features. In combination with other texture/biomarker features derived from platforms such as, biomarker-decorated image data, global gene expression profiles, and chromosome aberration measurements, the differentiation potential of these new findings will increase due to increasing length of outcome specific feature vectors used in classification.
The following output simulation result is obtained in MATLAB7.0 real time environment, which takes the original image as the input. According to the algorithm designed the following output results obtained.
4.
CONCLUSIONS
We have proposed a novel algorithm for color segmentation. Our algorithm improves the color segmentation accuracy significantly. One distinctive advantage of our approach is that our algorithm is also provides an explicit feature for regions which can be used for classifications and recognitions.
5.
ACKNOWLEDGMENTS
The author VSK is grateful to DST-PURSE, Department of Science and Technology, New Delhi for the Research Fellowships, to work under PURSE Programme at Sri Venkateswara University, Tirupati.
Dr. L V Narasimha Prasad, is grateful to Institute of Aeronautical Engineering, Hyderabad for providing MATLab simulation analysis.
6.
REFERENCES
[1] A. G. N. Agustí, B. G. Cosío, ―Chronic Obstructive Pulmonary Disease Emphysema‖, general Encyclopedia of Respiratory Medicine, 2006, Pages 448-457
[2] Friman O, Borga M, Lundberg M, Tyle´n U, Knutsson H (2002) Recognizing emphysema—a neural network approach. In: Proceedings of sixteenth international conference on pattern recognition, Quebec, Canada, pp 1–4
[3] Kinsella M, Mu¨ller NL, Abboud RT, Morrison NJ, DyBuncio A (1990) Quantification of emphysema by computed tomography using a ‗‗density mask‘‘ program and correlation with pulmonary function tests. Chest 97:315–321
[4] Mir H, Hanmandlu M, Tandon SN (1995) Texture analysis of CT images. IEEE Eng Med Biol Mag 14:781–786
[5] K.J.R. Murthy, J.G. Sastry ―Economic burden of chronic obstructive pulmonary disease‖, NCMH Background Papers• Burden of Disease in India
tumors. World Health Organization 1968, 2(2):13-20.
[10] Balslev I, Axelsson CK, Zedeler K, Rasmussen BB, Carstensen B, Mouridsen HT: The Nottingham Prognostic Index applied to 9,149 patients from the studies of the Danish Breast Cancer Cooperative Group (DBCG). Breast Cancer Res Treat 1994, 32:281-290.
[11] Latson L, Sebek B, Powell KA: Automated cell nuclear segmentation in color images of hematoxylin and eosin-stained breast biopsy. Analytical and Quantitative Cytology and Histology 2003, 25(6):321-331.
[12] Schnorrenberg F, Pattichis C, Kyriacou K, Schizas C: Computer- Aided Detection of Breast Cancer Nuclei. IEEE Trans on Information Tech in Biomedicine 1997, 1(2):128-140.
Neoplastic Lesions with Applications to Cancer Chemoprevention Trials. Cancer Epidemiol Biomarkers Prev 1999, 8:1087-1094.