O R I G I N A L A R T I C L E
Open Access
Multi-objective optimization of functionally
graded thickness tubes under external
inversion over circular dies
Omid Mohammadiha
*and Hashem Ghariblu
Abstract
This paper optimizes the crushing response and energy absorption of functionally graded thickness (FGT) inversion tubes using the multi-objective optimization method. The numerical results, which are validated by the experimental tests, confirm that optimizing geometry of FGT inversion tube improves energy absorption capacity with respect to ordinary uniform tube UT with the same weight. Our study shows that the die radius r, coefficient of friction μd between the die and tube, and thickness distribution function have great influence on the responses of FGT inversion tubes. The specific energy absorption (SEA), peak crushing force Pmax, and dynamic amplification factor (DAF) are selected as the objectives of crashworthiness optimal design. Finally, the weighted average method, multi design optimization (MDO) technique, constrained single-objective optimization, and geometrical average method were employed to find the optimal configuration of the proposed inversion tube. The results give new design ideas to improve crashworthiness performance of inversion tubes.
Keywords:Inversion tube, Functionally graded thickness, Finite element, Multi-objective optimization
Background
Energy crisis and environmental concerns place higher requirement to decrease the weight of vehicles and achieve a highest possible safety and quality with mini-mum cost. In the last few decades, there has been a con-tinuous focus on design optimization as a primary requirement in the design of automotive structures. Lightweight materials, such as aluminum and magne-sium alloys, are gradually finding their place in vehicle engineering (Miller et al. 2000). Thin-walled structures are widely used to dissipate the vehicle’s kinetic energy in terms of plastic deformation in collisions. Many applications employ thin-walled tubes to enhance the crashworthiness of structure such as energy absorption devices at the front of cars and trains (Marsolek & Reimerdes 2002), aircraft sub floor structures (Bisagni), and rollover protective structures (ROPS) of heavy vehicles, such as bulldozers and tractors (Ahmad & Thambiratnam 2009a). Thin-walled tubes with different geometries and materials are commonly used to absorb
kinetic energy through plastic material deformation. The widespread use of thin-walled tubes as energy absorbers is due to their good performance under dy-namic loading, availability, low manufacturing cost, and efficiency. Numerous efforts have been made in the past decades to improve the crashworthiness perform-ance of the crush absorber tubes, such as foam filled tubes (Hanssen et al. 2000; Ahmad & Thambiratnam 2009b; 2009c; Aktay et al. 2008; Mirfendereski et al. 2008), introducing different patterns (Zhang et al. 2007), grooves (Zhang & Huh 2009; Saleh ghaffari et al. 2010), multi-cells (Zhang & Zhang 2013; Zhang &
Zhang 2014), and functionally graded structures
(Mohammadiha & Ghariblu 2016; Sun et al. 2010). Relative merits of conical tubes with graded thickness subjected to oblique impact loads are investigated by Zhang (Zhang & Zahng 2015).
Inversion is a mode of plastic deformation which develops when a thin-walled tube is compressed between a flat plate at one end and filleted die at the other (Al-Hassani et al. 1972a; Reddy 1992a). Therefore, analysis of external inversion process is equally important for manufacturing technology as well as for impact and crashworthiness
* Correspondence:[email protected]
Department of Mechanical Engineering, University of Zanjan, Zanjan, P. O. Box 81746-73441, Iran
Al-Hassani et al. (1972b), Reid (Karagiozova et al. 2000), and Reddy (1992b) made experimental investiga-tions and theoretical analyses for the deformation be-havior and forming load of external inversion. Miscow and AL-Qureshi (1997) studied the theoretical and ex-perimental studies of the static and dynamic inversion process in circular tubes. This theoretical analysis is valuable as the first formula that predicts the axial force versus the axial displacement during the inversion process. But theoretical curve that sketched based on Miscow’s theory shows an intensive increment at the onset of loading with a large difference, comparing the experimental curve. The effects of strain rate and iner-tia during dynamic free inversion process were further investigated by Colokoglu and Reddy (1996). However, the prediction process is very complicated and gener-ally, theory and experiments have not been in accept-able agreements with each other. Accordingly, the predicted quasi-static inversion load is significantly lower than experimental value while the predicted dynamic mean load is overestimated. Chirwa (1993) in-vestigated the plastic collapse of a tapered thin-walled metal Inver buckle energy absorbing tube subjected to axial impact. In this work, predicted specific energies and loads of collapse modes had been in good agreement with the experimental results. Recently, Masmoudi et al. (2016) carried out numerical and experimental analyses of external curling of thin-walled round tubes. Their model provides an accurate prediction on the forming kinematics and the deformed shape.
Reviewing the literature presents an effective way to in-crease the energy absorption of a structure, which is to harden the materials and simultaneously design the optimal structures. Up to now, the multi-objective optimization of functionally graded thickness (FGT) inversion tubes has never been investigated or presented elsewhere, even though optimal shapes of die and tube are very important in the crashworthiness of external inversion of tubes.
The aim of this study is to address the crashworthi-ness design issues of the various FGT inversion tubes under axial loading through the several quasi-static tests by following the multi-objective optimization pro-cedure. A finite element (FE) model is developed to simulate the graded thickness in FGT tubes, and this
some pioneer researchers (Miscow & AL-Qureshi 1997) and not yet been disclosed. The results will demonstrate that the optimal FGT inversion tubes can be recom-mended as efficient energy absorbers. The primary out-come of this study is new design optimum information on the energy absorption performance of inversion tubes.
Methods
Objective functions of structural crashworthiness
To evaluate the energy-absorbance of structures and optimize their performance, it is necessary to define the crashworthiness objective functions of energy absorber. The ultimate objective of a crashworthy structure is to minimize occupant injuries and trauma. The specified energy absorption (SEA) is defined as the area under the load-displacement curve per unit mass represented as follows:
SEA¼
Z d
0 Fdx
mc ¼
E
mc; ð
1Þ
where, mc is the total mass of the component andE is
the energy absorbed. SEA is a key indicator to distin-guish energy absorption capabilities for various struc-tures and weights. The total strain energy absorbed by the structure during the deformation includes not only the elastic component but also the plastic strain energy.
On the other hand, the peak crushing force Pmax is
sometimes considered one of the critical design objectives to prevent the occupant’s body from severe biomechanical injury (Qiao et al. 2004). In the load-displacement curve, the peak crushing forcePmax is defined as the maximum
collapse load during the crushing strike. In this study, SEA andPmaxare selected as the independent parameters
in multi-objective optimization.
Finite element models of FGT inversion tubes
T yð Þ ¼t1þðt2−t1Þ x Lα
m
: ð2Þ
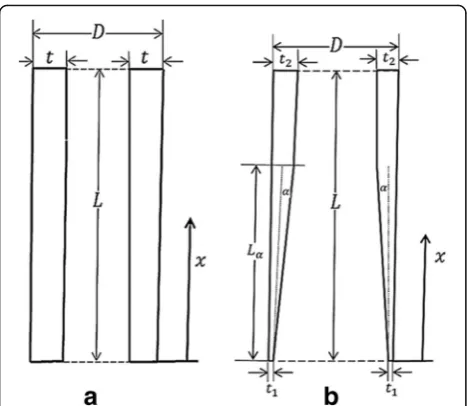
Here, all of the tubes have the same baseline dimensions with lengthL= 85 mm and outer diameterd= 50 mm. It is first assumed that the FGT tubes have a linearly graded thickness fromt1= 1 mm tot2= 2 mm, and the UT tubes
have an equivalent thickness oft= 2 mm. Also, the terms αandLαin Fig. 1 are the angle and length of tube section with distributed thickness. Meanwhile, x is the distance from bottom to the heightLαandmis the order of thick-ness distribution, with m= 1 for linear variation of tube thickness.
As shown in Fig. 1,Lαin specimens for three different angles can be calculated as follows:
Lα¼t2−t1
tanα: ð3Þ
So,Lαfor three different angles are calculated as
Lα¼1¼57:2 mm; Lα¼2¼28:63 mm; Lα¼3¼19:08 mm:
Developing an accurate FE analysis, proper selection of the impact modeling technique will have great contri-bution on crashworthiness analysis. Here, the crush be-havior of UT and FGT tubes is studied to predict their main crashworthiness features as function of the tube material and geometrical parameters. The FE analysis is employed to find these behaviors for various cases which are difficult and expensive to perform by experimental tests. The finite element models of the tubes were devel-oped with the use of commercial explicit finite element code LS-DYNA. Aluminum alloy is modeled by applying
the piecewise linear elastic-plastic material model with the constitutive equation of strain hardening as (Karagiozova et al. 2000):
_
ε¼D σ
0 0 σ0−
1
q
; ð4Þ
in which σ0
0 is the dynamic flow stress at a uniaxial plastic
strain rate, σ0 is the associated static flow stress, and
the constants D and q are material parameters. These
parameters are selected for aluminum 6061 as D=
1,288,000s−1 and q= 4 (Karagiozova et al. 2000). The yielding function is defined by the von-Mises yielding criterion as:
φ¼1 2SijSij−
σy
3 : ð5Þ
Where Sij and σy are the deviatoric stress and the
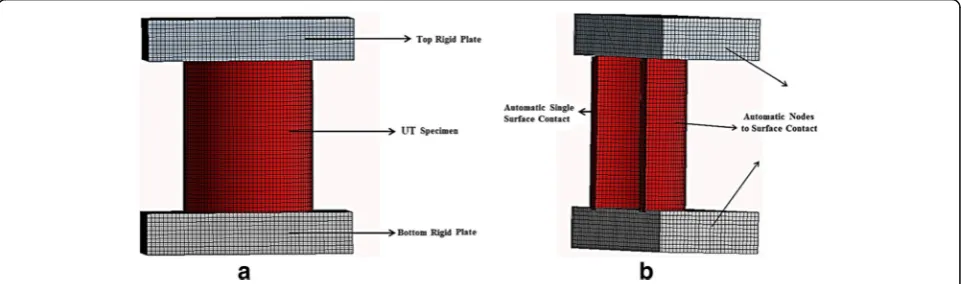
current radius of the yield surface. As illustrated in Figs. 2 and 3, the full section FGT and UT tubes are modeled by the quadrilateral Belytschko-Tsay shell elem-ent with four nodes and three integration points consid-ered throughout the thickness. Top and bottom plates modeled as rigid bodies. It is assumed that the bottom die is fixed and the top plate only moves in longitudinal direction and has one degree of freedom. The optimum mesh size for each simulation is obtained after perform-ing the mesh sensitivity analysis. It indicates that an element size of 3 mm (3200 elements in FE model) is adequate to produce suitable results. In other words, the mesh size is suitable when the obtained results are lo-gical for crush simulation and do not change drastically.
The automatic single surface contact algorithm is used to account the contact force between the crush zone sur-faces or metal folds. The node to surface algorithm models the contact between the rigid plate (die) and the crushed components. The friction coefficients at the different interfaces have been takenμ= 0.2. In all simula-tions, the die radius isr= 3 mm. To obtain the appropri-ate value of friction factor μd between die and tube
interface, various values forμdwere tested. It is seen that
whenμd= 0.02 was utilized, the load-displacement curves
and deformed shapes of tubes are similar to the experi-mental tests. Therefore, the value of friction coefficient μd= 0.02 assumed for subsequent study.
Material properties
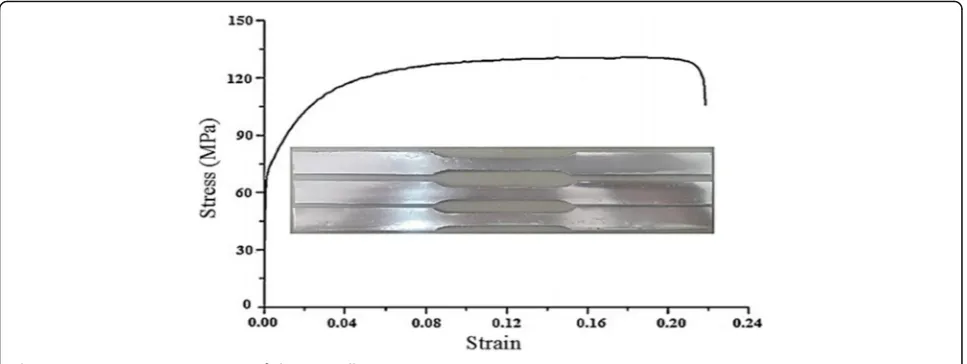
The circular aluminum alloy AA6061 tubes utilized for experimental tests. To obtain tubes exact stress-strain curve and mechanical properties, three similar speci-mens prepared from tubes in longitudinal direction based on ASTM standard tensile test (Fig. 4) (ASTM Standard E8/E8M-08 2003). The strain rate was 2.77 × Fig. 1Schematic view of the test specimens.aUniform tube UT.
10−3s−1. The mechanical properties of aluminum alloy AA6061 are tabulated in Table 1.
Validation of finite element models
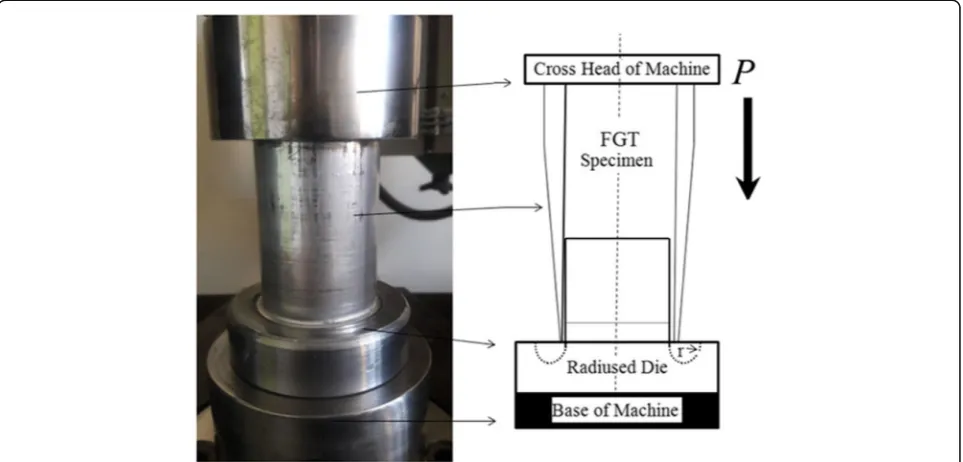
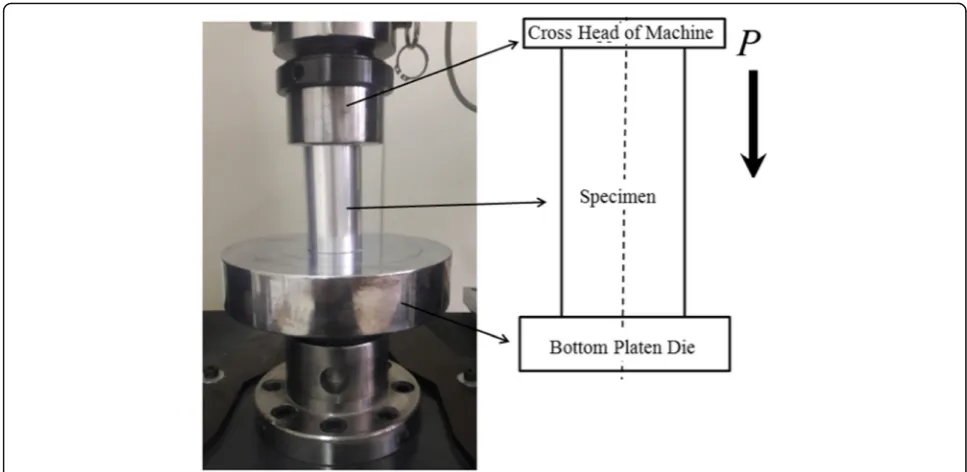
The FE result of the UT tube without die and FGT tubu-lar specimens under axial loading condition compared and validated by experimental results. Quasi-static com-pression tests of specimens have been done using the 250 kN standard tensile-compression test machine. The top plate feed rate is considered as 3 mm/min with max-imum 40 mm progress. Friction plays a significant role to ensure the process of tube inversion to deform. Grease based on lithium soap was used during experi-ment to reduce the friction factor and preventing folding mode of tube crush. The die surface and inner area of the tubes has been lubricated with grease before con-ducting the experiments. Three different tube profiles with angles α= 1°, 2°, and 3° are investigated here and three specimens are prepared for each case (Fig. 5).
As depicted in Figs. 6 and 7, in order to compare FGT and UT tube crush responses with each other, only FGT tubes with linear thickness variation with angles α= 1°, 2°, and 3° are tested. Then, by optimization, the FE model is employed to consider with different geometries for FGT tubes.
The final crushed shape of UT and FGT tubes is shown in Fig. 8a–d. In Fig. 8a, both experimentally and numerically, it is seen that in the UT tube without die the folding begins from the upper section and continues with stacking more folding during the crushing. Also, as depicted in Fig. 8b–d, different deformation modes are observed in FGT tubes with linearly variable thicknesses. In all three FGT specimens with angles α= 1°, 2°, and 3° tubes, thickness starts from t1= 1 mm at bottom side to
maximumt2= 2 mm at heightLα(Fig. 1). Because of rela-tively smaller cross section of the FGT tubes in the bot-tom side, compression load results in higher stress rates at this side and deformation of all FGT specimens start from Fig. 2The details of representative finite element model for FGT inversion tube with die and uniform circular without die.aOverall view.
bCross-sectional view
the bottom by inversion of tubes. But, approximately, after reaching to the height ofLα, inversion process changes to folding of tubes. Therefore, complete inversion of tube only occurs in the FGT tube with α= 1° with Lα=1°=
57.2 mm that is greater than 40 mm maximum compres-sion progress. The comparison between load vs. displace-ment between experidisplace-mental and FE simulation is shown in Fig. 9. The predicted load-displacement curve shows acceptable agreement with experimental curves.
For better comparing the results of finite element energy absorption characteristic of UT tube and FGT tube with the experimental results, various results are presented in Table 2. In Table 2,Pmax(peak load), Pm (mean load), E
and SEA in various tube geometries are calculated by FE simulation and compared with the experimental tests. The FE simulation results indicate acceptable agreement with experiments.
From experimental results represented in Fig. 9 and Table 2, it is seen that load-displacement curve in the complete inversion process for FGT tube with α= 1° is smoother than the UT tube with folding crush behavior, and meanwhile SEA = 43.9 and mean forcePm= 39.3 kN
of FGT tube with α= 1° is meaningfully more than
SEA = 32.4 Pm= 28.1 kN for UT tube with the same
overall dimensions. Beside on, initial peak force in the FGT tubes is lower than in the UT tube. Therefore, using optimal FGT tubes guarantees full inversion process with better crush characteristics and behavior. The validated FE model will be further used for optimization designs in the following sections.
Multi-objective optimization design Design methodology
While the effect of various parameters on crushing re-sponse has been addressed in the previous sections, it is still unknown how to design specific best designs for thin-walled circular inversion tubes under the axial load-ing. The die radiusr, coefficient of frictionμd, and order of thickness distribution have great influence on the responses of FGT inversion tubes. In this section, a fundamental optimization problem is solved and the optimum values of these design variables are ob-tained. The approximate function relation that pre-dicts the amount of desired objectives was obtained from the RSM. RSM is a method for constructing functions that describe the correlation between the design variables based on the FE simulation results. The improved RSM flowchart is shown in Fig. 10, where the experimental designs are generated through saturated Latin hypercube design (LHD) points (Liao et al. 2008). In order to construct a fourth-order RSM model, the number of (rv+ 1)s design points se-lected for the design variables. In this optimization study, rv (order of the polynomial objective function)
and s (the number of design variables) are
corres-pondingly assigned to each optimization problem. De-sign variables continuously increase with an increase of 0.1, from 0 to 10 form, 1 to 3 mm fort, and 2 to 6 mm for r. This increase for the angle α in linear thickness distribution is 0.1° from 1° to 3°. In automotive scenarios, the peak load Pmax and SEA are critical to the occupant
Fig. 4Engineering stress-strain curve of aluminum alloy AA6061
Table 1The tensile mechanical properties of aluminum alloy AA6061
Mechanical properties Young’s modulus E Yield strengthσ0.2 Ultimate tensile strength Poison ratioϑ Failure strain %
survival rate when impact occurs. An overly high Pmax
and less SEA often lead to severe injury or even death of occupant. In this study, these parameters are selected as objective functions in the multi-objective optimization framework.
Error evaluation of the surrogate model
As indicated in the previous section, RSM model con-structed through LHD point’s selection. The numerical errors in the fitted regression model can be caused by the selection of basic functions, selection of sampling points and the least square and includes effects such as random and measurement errors on the response (Liao et al. 2008). In this study, the two central composite de-sign (CCD) and LHD selection methods were employed and the error obtained from these methods was com-pared with the different polynomial RS models. The stat-istical parameters used for evaluating the model fitness
the error sum of square (SSE), the total sum of square
SST
ð Þcalculated as
SSE¼
XM
i¼1
yi−ỹiÞ2;
ð6Þ
SST¼
XM
i¼1 yi−yi
ð Þ2; ð
7Þ
where yi the numerical solution obtained from FE, yi is the mean value of FE, and yi represents
approxima-tion based on the response surface model. Relative error (RE), root mean square (R2), adjusted root mean square (Radj2 ), and root mean square error (RMSE) are
sequentially given by the following relations (Zhang & Zhang 2014)
Fig. 5Specimens offFGT tubes for three different anglesα¼1○;2○;and 3○
Fig. 7Experimental setup used for studying uniform thickness tube without die
Fig. 8Experimental and FE simulation deformation pictures.aUT tube.bFGT tube with lathe anglesα¼1○.cFGT tube with lathe angles
RE¼~yi−yi
yi ; ð8Þ
R2¼1−SSE=SST; ð9Þ
Radj2¼1− 1−R2
M−1
M−p−1; ð10Þ
RMSE¼
ffiffiffiffiffiffiffiffiffiffiffiffiffiffiffiffi SSE
M−p−1 s
; ð11Þ
wherepis the number of none constant terms in the RS model and M is the number of design sampling points. Relatively higher values of R2 and Radj2 and relatively
smaller values of RMSE and RE indicate the better agreement between FE and response surfaces model. The results of the error evaluation are tabulated in Table 3 (a) and (b) for SEA (m,μd) analysis carried out by CCD and LHD selection methods. One can see from
the result that quadratic polynomial function con-structed by LHD method provides the best fitness.
Optimization of die radiusrand angleαfor linear thickness variation
Multi-objective optimization problem can be expressed in terms of the linear weighted average of objective func-tions as (Hou et al. 2008):
Minimize Fw ¼ ð1−wÞf 1 f1þw
f2 f2 St w ∈½1;0 and xl≤ xu
8 <
: ; ð12Þ
in which f1=SEA, f2=Pmax, and f1; f2 correspondingly
are the given normalizing values of SEA andPmax.
Regard-ing the multi design optimization (MDO), x represents the design variables r and α. Additionally, superscripts l andu, respectively, indicate the lower and upper bound of design variables, whilewis the weight factor to emphasize the effectiveness of these two objectives. The optimal Fig. 9Experimental and simulation load-displacement curves.aUT tube.bFGT tube with lathe anglesα=1°.cFGT tube with lathe anglesα=2°.
dFGT tube with lathe anglesα=1°
Table 2Experimental and FE simulation results for various types of tubes
Tube case Pmax(kN) Pm(kN) E(kJ) SEA(kJ/kg)
Exp. FE Diff. (%) Exp. FE Diff. (%) Exp. FE Diff. (%) Exp. FE Diff. (%)
UT 47.9 52.4 8.5 28.1 33.4 15.8 1.6 1.9 15.7 32.4 38.5 15.8
results of Pareto’s points can be determined by changing parameter w in Eq. (12). It should be noted that Pareto sets provide the designer with a large number of optimal solutions. The setup of Pareto sets is crucial to fully understand the solution space for these two different de-sign criteria.
Solving the optimization problem, the maximum SEA
value is 56.4 kJ/kg and minimum of Pmax is 32.4 kN
which is obtained at point (r= 3.43 mm, α= 1.41°).The Pareto sets for FGT is plotted in Fig. 11. Because of the
complex nature of design objectives and variables, the convexity of Pareto space is not guaranteed. However, convexity of all plotted curves signifies the effectiveness of using linear weighted method to explore for multi-objective optimization (Masmoudi et al. 2016). By setting the design variables to the optimum point, a numerical verification analysis is conducted and load-displacement curve for the optimal design are given in Fig. 12. The SEA value is 54.1 kJ/kg andPmaxis 33.8 kN
at the optimum point. The difference between the pre-dicted value and verification value is about 4 %, which shows a very good approximation.
Design optimization for coefficient of frictionμdand
exponent gradientm
In order to find the best tube configuration, the MDO procedure (Zarei & Kroger 2008) has been applied to Fig. 10The flowchart of the improved RSM
Table 3Accuracy of different polynomial RSM models based on (a) CCD and (b) LHD
RS model R2 R
adj
2 RMSE RE interval (%)
(a)
Quadratic polynomial 0.9957 0.9942 0.0921 [−2.18,2.24] Cubic polynomial 0.9966 0.9956 0.0723 [−1.03,2.31] Quartic polynomial 0.9984 0.9977 0.0316 [−0.78,1.17] (b)
Quadratic polynomial 0.9990 0.9990 0.0893 [−1.76,2.04] Cubic polynomial 0.9992 0.9990 0.0714 [−0.74,1.58] Quartic polynomial 0.9999 0.9997 0.0292 [−0.39,1.08]
Fig. 11The Pareto sets for optimum FGT inversion tube
that these values are near to upper or lower bound; ac-cordingly, the variables are shifted to lower or higher values. These cycles continue to a point where the ob-jective function is improved for the crashworthiness. The optimum value of design variables calculated from MDO are given in Table 4.
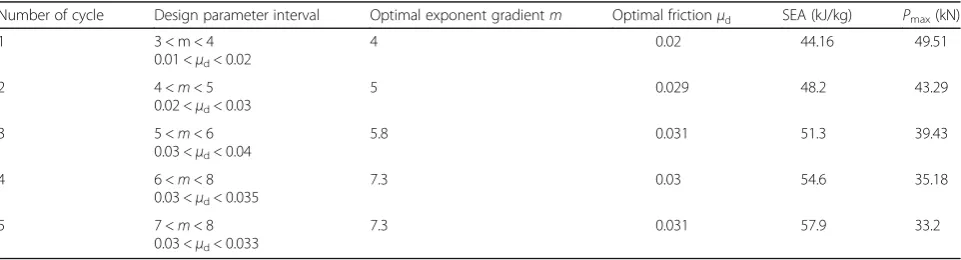
Design optimization for die radiusrand thickness exponent gradientm
It is assumed that the thickness exponent gradient m is positive constant that must be adjusted to obtain a certain type of power law variation in FGT inversion tubes. The achieved optimization results in previous section reveal that coefficient of frictionμd= 0.031 has better crashworthiness
performance than other values. To design a suitable geom-etry for inversion die in this section, the design parameters for optimization process are selected asmandr. With the explicit formulation of SEA (m,r) andPmax(m,r), the
two constrained single-objective optimization in the multi-objective optimization framework defined as:
Maximize SEA mð ;rÞ Pmaxðm;rÞ≤35kN St ml≤m≤mu
rl≤r≤ru
8 > > < > > : ð 13Þ
Minimize Pmaxðm;rÞ SEA mð ;rÞ≥55kJ=kg St ml≤m≤mu
rl≤r≤ru
8 > > < > >
: ; ð14Þ
where, l and u superscripts represent the lower and
absorption and the peak load, determined with respect to the grading exponent m and die radius r. These ob-jective parameters are drawn in Figs. 13 and 14.
Dynamic loading
Quasi-static test is not able to express actual crash-worthy structure behavior. It is also interested to quan-tify the effect of the various inversion parameters on the dynamic response of FGT inversion tubes and compare them with the quasi-static response. The explicit finite element procedure was used to analyze the dynamic re-sponse of UT and FGT inversion tubes subjected to axial impact loading. The calculated absorbed energy is com-pared with the corresponding results obtained for quasi-static simulation. In this study, dynamic amplification factor (DAF) was used to consider the dynamic effect of crash. The term DAF relates quasi-static and dynamic responses to each other and is defined as the ratio of the absorbed energy under dynamic loading to the ab-sorbed energy under quasi-static loading (Ahmad & Thambiratnam 2009b). The effect of strain rate on the yield stress is described by Eq. (4), whose parameters are mentioned in the“Material properties” section forDand q. Here, the influence of nonlinear thickness distribution of FGT tubes under various loading velocities is estab-lished. The FGT tubes main dimensions are t1¼1 mm,
t2¼3 mm, die geometry r¼4 mm, and coefficient of
friction μd¼0:03 . Figure 15 shows significant effect of
exponent gradient mon the DAF for both UT and FGT
tubes. The results show that dynamic energy absorption
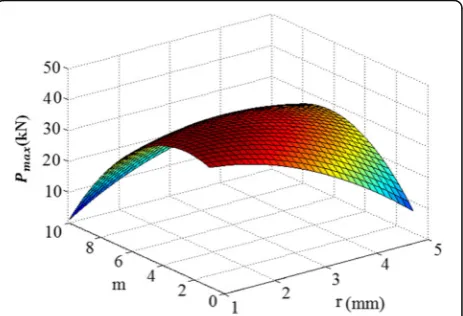
Table 4Optimum frictionμdand exponent gradientmobtained through MDO for FGT inversion tube
Number of cycle Design parameter interval Optimal exponent gradientm Optimal frictionμd SEA (kJ/kg) Pmax(kN)
1 3 < m < 4 0.01 <μd< 0.02
4 0.02 44.16 49.51
2 4 <m< 5 0.02 <μd< 0.03
5 0.029 48.2 43.29
3 5 <m< 6 0.03 <μd< 0.04
5.8 0.031 51.3 39.43
4 6 <m< 8 0.03 <μd< 0.035
7.3 0.03 54.6 35.18
5 7 <m< 8 0.03 <μd< 0.033
property of concave distribution of thicknessm>1 is bet-ter than the convex patbet-tern m<1. This effect can be re-lated to the smooth rising in the load displacement of the FGT tube, rising the interaction between the tube and die, and the higher plastic energy damping of concave FGT structures.
Design optimization of DAF for coefficient of frictionμd
and exponent gradientm
As shown in the previous section, the thickness distribu-tion has great influence on the dynamic responses of FGT inversion tubes, and in this section, a fundamental optimization problem is solved and the influences of thickness variables on DAF of the structure are analyzed. In order to find the best tube configuration, MDO pro-cedure has been applied to maximize DAF(m, μd) and minimize dynamic Pmax(m, μd) of the FGT tubes with coefficient of frictionμd and exponent gradientmas de-sign variable. The optimum value of dede-sign variables cal-culated from MDO is given in Table 6. Crashworthiness optimization for FGT inversion tube shows that nonlin-ear concave thickness distribution m>1 is found to show the maximum efficiency.
Design optimization of DAF for die radiusrand exponent gradientm
The influence of die radius and exponent gradient mon dynamic response of FGT inversion tube is analyzed based on the approximate function derived by surrogate model.
In order to find the best inversion tube configuration, the geometrical average method has been applied to maximize DAF(m,r) and minimize dynamicPmax(m,r) of the FGT
tubes with coefficient of die radiusrand exponent gradi-entmas design variable. Based on optimization study car-ried out in the“Design optimization of DAF for coefficient of frictionμdand exponent gradientm”section, coefficient
of frictionμdis selected 0.033.
In the geometrical average method, the cost function of relative efficiency of each objective is constructed in terms of a geometrical average as (Hou et al. 2008):
MinimizeFg ¼
ffiffiffiffiffiffiffiffiffiffi dDAF
p
dp
St xl≤x≤xu :
8 <
: ð15Þ
To maximize DAF, the efficiency coefficient dDAF is
expressed in terms of a relative distance from the lower bound, through:
dDAF¼ f1ð Þx−fl1
fu1−fl1 : ð16Þ
And to minimize the peak crushing force, the effi-ciency coefficientdpis written as follows:
dp¼1− f2ð Þx−fl2
fu2−fl2 ; ð17Þ
where fl and fu, correspondingly, are the lower and upper bounds of the objective function in the design Table 5Optimization results of SEA for FGF filled conical tube with peak crushing force constraint
Type of optimization method Optimal design variable SEA (kJ/kg) Fmax(kN)
Peak load constraint m= 7.33,r= 3.13 mm 64.8 34.2
SEA constraint m= 7.41,r= 3.18 mm 58.2 31.7
space. Furthermore, the overall efficiency coefficient Fg
= 1 indicates the optimal solution andFg= 0 corresponds
to the worst solution. In this paper, f1is the DAF(m, r), f2is Pmax(m, r), and x1, x2, respectively, are the design
variablesmandr.
It must be emphasized that in order to optimize the two DAF(m,r) andPmax(m, r) objectives by the geomet-rical average method, the Fg(m,r) is maximized and for the best design, the values of dDAF and dP are required to be as large as possible. The efficiency cost function Fg(m,r) vs. design variables m and r are displayed in Fig. 16. It is observed that the shape of cost function is varied by changing the design variable. The optimization data which are obtained from the geometrical average method are tabulated in Table 7. The results yielded from the optimization indicate that the FGT inversion is
superior to its counterparts (“Design optimization of DAF for coefficient of friction μdand exponent gradient
m”section) in overall crashworthiness.
Conclusions
In this paper, a new type of structure called functionally graded thickness inversion tubes subjected to axial load-ing has been investigated by employload-ing finite element code LS-DYNA. Energy absorption response was quanti-fied with respect to variations in the parameter of die ra-dius, coefficient of friction, and tube thickness variation pattern. The results have demonstrated the feasibility and superior performance of FGT tubes with optimum design variables as energy absorbers. Some optimization tools such as the weighted average method and multi-Fig. 15The effect of impact velocity on DAF for UT and FGT with various exponent gradientm.av¼5m=s:bv¼10m=s:cv¼20m=s:
dv¼30m=s
Table 6Optimum die radiusrand exponent gradientmobtained through MDO for FGT inversion tube
Number of cycle Design parameter interval Optimal exponent gradientm Optimal die radiusrðmmÞ DAF Pmax(kN)
1 3 <m< 4 0.01 <μd< 0.02
4 0.02 1.2 59.66
2 4 < m < 5 0.02 <μd< 0.03
4.8 0.028 1.3 57.34
3 5 < m < 6 0.03 <μd< 0.04
5.7 0.031 1.4 52.23
4 6 < m < 8 0.03 <μd< 0.035
6.3 0.031 1.5 50.42
5 6 < m < 7 0.03 <μd< 0.033
design objective technique utilized to optimize the FGT inversion tubes. The primary conclusions and design in-formation this study outlined as follows:
(1)Sensitivity analysis indicates that several design parameters (die radiusr, coefficient of frictionμd, tube thickness variation pattern) have significant effect on SEA and peak force, which justify the selection of these parameters in multi-objective optimization.
(2)Friction between the die-tube interfaces plays a key role in the overall development of inversion process. In fact, a successful inversion mode of deformation easily switches into an unacceptable mode by simply changing this parameter. Optimization results show that the reduction of friction coefficient to less than 0.04 during inversion leads to the drastic improvement of crashworthiness performance.
(3)Experimental and numerical results present that the peak load in FGT inversion tubes obviously
decreases, and simultaneously the load level increases steadily.
(4)The results achieved from multi-objective crash-worthiness optimization show that using concave function for thickness distribution of tubes improves SEA without significant growth of initial peak force. (5)The nonlinear thickness distribution exponent
gradientmand die radiusrare important parameters to control the DAF of FGT inversion
response under dynamic loading. The optimum DAF of FGT inversion tube has different behavior and it increases at the dynamic deformation.
Briefly, this research introduces new designs of inver-sion tubes as energy absorber with superior characteris-tics with respect to UT tubes, under uniaxial loading. The multi-objective optimization method introduced here gives valuable information to develop and design of FGT inversion tubes in applications involving crush loading, such as automotive, aerospace, transportation, and defense industries.
Authors’contributions
Both authors read and approved the final manuscript.
Received: 2 August 2016 Accepted: 15 September 2016
References
Ahmad, Z., & Thambiratnam, D. (2009a). Application of foam-filled conical tubes in enhancing the crashworthiness performance of vehicle protective structures.International Journal of Crashworthiness, 14(4), 349–363. Ahmad, Z., & Thambiratnam, D. P. (2009b). Dynamic computer simulation and
energy absorption of foam-filled conical tubes under axial impact loading.
Computers & Structures, 87(3–4), 186–197.
Ahmad, Z., & Thambiratnam, D. P. (2009c). Crushing response of foam-filled conical tubes under quasi-static axial loading.Materials and Design, 30(7), 2393–2403.
Aktay, L., Kröplin, B. H., Toksoy, A. K., & Güden, M. (2008). Finite element and coupled finite element/smooth particle hydrodynamics modeling of the quasi-static crushing of empty and foam-filled single, bi tubular and constraint hexagonal- and square-packed aluminum tubes.Materials and Design, 29(5), 952–962.
Al-Hassani, S. T. S., Johnson, W., & Lowe, W. T. (1972a). Characterization of inversion tubes under axial loading.Journal of Mechanical Engineering Sciences, 14, 370–381.
Al-Hassani, S. T. S., Johnson, W., & Lowe, W. (1972b). Characteristics of inversion tubes under axial loading.Journal of Mechanical Engineering Science, 14, 370–381. ASTM Standard E8/E8M-08. (2003).Standart test methods for tension testing of
metallic materials. PA, West Conshohocken: ASTM international. Bisagni C. Crashworthiness of helicopter subfloor structures. Int J Impact Eng
27(10):1067–82.
Chirwa, E. C. (1993). Theoretical analysis of tapered thin-walled metal inverbuck tube.International Journal of Mechanical Sciences, 35(3-4), 325–351. Colokoglu, A., & Reddy, T. Y. (1996). Strain rate and inertial effects in free external
inversion of tubes.International Journal of Crashworthiness, 1(1), 93–106. Guist LR, Marble DP (1966) Prediction of the inversion load of a circular tube.
NASATND 3622.
Hanssen, A. G., Langseth, M., & Hopperstad, O. S. (2000). Static and dynamic crushing of square aluminium extrusions with aluminium foam filler.
International Journal of Impact Engineering, 24(4), 347–383.
Hou, S. J., Li, Q., Long, S. Y., Yang, X. J., & Li, W. (2008). Multiobjective optimization of multi-cell sections for the crashworthiness design.International Journal of Impact Engineering, 35(11), 1355–1367.
Karagiozova, D., Alves, M., & Jones, N. (2000). Inertia effects in axisymmetrically deformed cylindrical shells under axial impact.International Journal of Impact Engineering, 24, 1083–1115.
Liao, X. T., Li, Q., Yang, X. J., Zhang, W. G., & Li, W. (2008). Multiobjective optimization for crash safety design of vehicles using stepwise regression model’.Struct. Multidisc. Optim., 35, 561–569.
Marsolek, J., & Reimerdes, H. (2002). Energy absorption of metallic cylindrical shells with induced non-axisymmetric folding patterns.International Journal of Impact Engineering, 30(8), 1209–1223.
Masmoudi, M., Ketata, H., & Krichen, A. (2016). External curling process of thin tubes: finite element and experimental investigation.International Journal of Advanced Manufacturing Technology. doi:10.1007/s00170-016-8742-x.
Table 7Optimum die radius and gradient thickness obtained through the geometrical average method
Optimal values Fg(m,r) dDAF DAF Pmax(kN)
m= 6.4,μd=.034 0.7358 0.8451 0.8342 1.75 44.32 Fig. 16The efficiency cost functionFg(m,r) vs. design variablesm
Reddy, T. Y. (1992). Guist and Marble revisited—on the natural knuckle radius in tube inversion.International Journal of Mechanical Sciences, 34(10), 761–768. Saleh ghaffari, S., Tajdari, M., Panahi, M., & Mokhtarnezhad, F. (2010). Attempts to improve energy absorption characteristics of circular metal tubes subjected to axial loading.Thin Walled Structures, 48(6), 379–390.
Sun, G. Y., Li, G. Y., Hou, S. J., Zhou, S. W., Li, W., & Li, Q. (2010). Crashworthiness design for functionally graded foam-filled thin-walled structures.Materials Science and Engineering A, 527(7–8), 1911–1919.
Zarei, H., & Kroger, M. (2008). Optimum honeycomb filled crash absorber design.
Materials and Design, 29(1), 193–204.
Zhang, X., & Huh, H. (2009). Energy absorption of longitudinally grooved square tubes under axial compression.Thin Walled Structures, 47(12), 1469–1477. Zhang, X., & Zahng, H. (2015). Relative merits of conical tubes with graded
thickness subjected to oblique impact loads.International Journal of Mechanical Sciences, 98, 111–125.
Zhang, X., & Zhang, H. (2013). Energy absorption of multi-cell stub columns under axial compression.Thin Walled Structures, 68, 156–163. Zhang, X., & Zhang, H. (2014). Axial crushing of circular multi-cell columns.
International Journal of Impact Engineering, 65, 110–125.
Zhang, X., Cheng, G., You, Z., & Zhang, H. (2007). Energy absorption of axially compressed thin-walled square tubes with patterns.Thin Walled Structures, 45(9), 737–746.
Submit your manuscript to a
journal and benefi t from:
7Convenient online submission
7Rigorous peer review
7Immediate publication on acceptance
7Open access: articles freely available online
7High visibility within the fi eld
7Retaining the copyright to your article