ORIGINAL ARTICLE
X. Yang · T. Amano · Y. Ishimaru (*) · I. Iida
Laboratory of Wood Technology, Faculty of Agriculture, Kyoto Prefectural University, Kyoto 606-8522, Japan
Tel. 81-75-703-5639; Fax 81-75-703-5639 e-mail: [email protected]
Part of this report was presented at the 50th Annual Meeting of the Japan Wood Research Society, Kyoto, April 2000. This article is trans-lated from the Japanese version, which was published in Mokuzai Gakkaishi 47(5), 2001
Xiaoyang Yang · Takuro Amano · Yutaka Ishimaru Ikuho Iida
Application of modal analysis by transfer function to nondestructive testing
of wood II: modulus of elasticity evaluation of sections of differing quality in
a wooden beam by the curvature of the flexural vibration wave
Received: March 22, 2002 / Accepted: May 15, 2002
Abstract The shape of the flexural vibration wave of
wooden beams at the first mode was detected using the transfer function. The dynamic modulus of elasticity (MOE) of beam sections of differing quality was estimated from the ratio of the curvature of the wave shape in this section to that of a clear beam. The results were as follows: (1) If a section with a lower dynamic MOE was introduced into a clear wooden beam, the curvature of the wave shape in that section became higher. (2) The ratio of the MOE and the reciprocal of the curvature ratio were highly correlated. (3) The MOE of a defect could be estimated, and the posi-tion of the defect could be determined accurately by exam-ining the curvature of the flexural vibration wave shapes.
Key words Nondestructive testing · Modal analysis ·
Flex-ural vibration · Modulus of elasticity · Transfer function
Introduction
The modulus of elasticity (MOE) of wood, an important measure that shows the wood’s resistance to transforma-tion, is usually used for nondestructive testing of wood be-cause of its high correlation with the wood’s strength.1
The strength of wood is usually determined at its weakest site, but the ordinary method of testing longitudinal vibration at the first mode shows, rather, that the average MOE is in the middle part of the wood. In wood that does not contain
defects, the average MOE has a comparatively high correla-tion with the strength, as the MOEs at various sites are almost identical. In contrast, in wood that contains defects the MOEs at defective sites are lower than the average MOE, so the MOE at the weakest site must be obtained to estimate the wood’s strength.
In our previous study2
the flexural wave shape at the first mode generated by tapping was measured by transfer func-tion and then compared with the theoretical wave shape to detect the presence of defects. It was shown that the defects in the wood could be detected on the basis of the change in the wave shape; that is, the modal analysis method3
could be applied to nondestructive testing of wood with defects. In this study, the curvatures of the flexural vibration wave shape at the first mode of a wooden beam with sections of differing quality (e.g., knots) were obtained, and the rela-tion between the curvature and the MOE was noted. In addition, the MOEs of the sections of differing quality were estimated based on the relation between the curvature and the MOE, and the accuracy was estimated.
Materials and methods
Materials
Wood beams were cut from a sugi (Cryptomeria japonica) log from Miyama-cho, Japan that was 76 years old and had a diameter of 130 cm at breast height. Fifteen beams 100 (L) 4 (R) 4 (T) cm, free of defect, were cut from the air-dried sapwood and heartwood of the log. Two of them had straight grain (called a “uniform beam” hereafter), and one had a relatively higher MOE. These three beams were used for this study. In addition, 15 sections, each 15 (L) 4 (R) 4 (T) cm and containing a knot with a diameter of 1–5 cm near the center of the longitudinal direction, were also used. These beams and sections were stored in an air-conditioned room at 20°C and 65% relative humidity (RH) for at least 4 weeks. The wood density after conditioning ranged from 0.32 to 0.38 g/cm3
measured by an accelerometer placed at a definite location on the same surface of the wooden beam. Depending on the response, the shape of the end-free flexural vibration wave at the first mode was determined. Then, part of an uniform (100 cm) beam was cut off (45–60 cm or 55–70 cm), and a section with a knot or a higher MOE was introduced in its place; it was fixed into the uniform beam by epoxy resin to determine the qualities of the wave shape of beams with varied MOEs. The wave shape of the beam in which a section of differing quality had been introduced was ob-tained. All of the measurements were carried out in an air-conditioned room at 20°C and 65% RH.
Measurement of dynamic MOE using the longitudinal vibration
To obtain the MOEs of the clear beams and the beams glued with sections, a sensor was attached at the center of a cut-end, and the other cut-end was tapped by an impulse force hammer. The resonance frequency of longitudinal vi-bration at the first mode was obtained using the apparatus as described in a previous study.2
The resonance frequency of longitudinal vibration at the first mode of the sections were determined by the analysis of tapping tones.4
The dynamic MOE was calculated using the following equation.
El 4frl1 l
2 2
◊ ◊r (1)
where El is the dynamic MOE (Pa); fr/l is the resonance frequency of longitudinal vibration at the first mode (Hz); l is the length of the beam or section (m); and r is the average density (kg/m3
).
The dynamic MOE and the densities of a clear beam and sections of differing quality glued between 55 and 70 cm are shown in Table 1, and those glued between 45 and 60 cm are shown in Table 2.
Treatment of experimental data
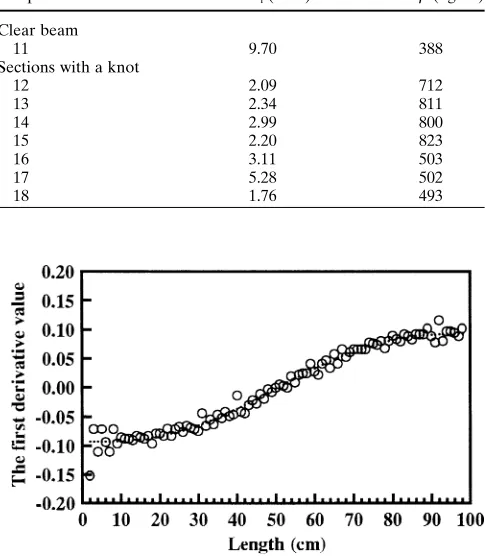
Calculation of curvature curve. To obtain the curvatures of the wave shape, it is necessary to differentiate the wave shape twice. The error in measurement was enlarged when the wave shape was differentiated the first time, as shown in Fig. 1. Thus, to obtain accurate curvatures of the wave shape, the first derivative of the wave shape was smoothed using the Fourier transform method from the software Mathematica 4.0. The points obtained by Mathematica 4.0
were printed on graph paper, and a smooth curve was drawn manually on the basis of the points. Subsequently, the curve was differentiated again, and the curvatures (the second derivatives) of the wave shape were derived. The curve was obtained by connecting the curvatures. Figure 2 is an example of the smoothed result of the no. 1 beam.
Modal normalization of the curvature curve. For the pur-pose of comparing the curvature curve of each tested beam
9 5.21 563
Clear section
10 11.18 538
El, longitudinal vibration; r, density
Table 2. El and r of a clear beam and sections of differing quality glued between 45 and 60 cm
Sample no. El (GPa) r (kg/m
3)
Clear beam
11 9.70 388
Sections with a knot
12 2.09 712
13 2.34 811
14 2.99 800
15 2.20 823
16 3.11 503
17 5.28 502
18 1.76 493
with the theoretical curvature curve, the curvature curves of beams were normalized to a curvature curve of the theoreti-cal wave shape [i.e. the area enclosed by the curvature curve of the uniform parts and the x-axis (the integral of the amplitudes of the uniform part to the longitudinal direction of the beam)] and the area enclosed by the same parts of the curvature curve of the theoretical wave and the x-axis were computed. The ratio was thus obtained. Then, each curva-ture of the measuring point of the beam was multiplied by the ratio of the latter to the former, and the normalized curvature curve was obtained.
Results and discussion
Curvature curve of the wave shape of the uniform beam
As shown in a previous study, the wave shape of flexural vibration at the first mode of the uniform beam coincided with the theoretical wave shape. In the present study, the curvature curve of the wave shape of a uniform beam was compared with the curvature curve of the theoretical wave shape. As shown in Fig. 2, the curvature curve of the uni-form beam also coincided with the curvature curve of the theoretical wave shape. This result shows that the curvature curve of the theoretical wave shape can be used instead of the curvature curve of the uniform beam. In the following discussions, the theoretical curvature curve is the criterion used for all comparisons.
Wave shape and curvature curve of the beam containing sections of differing quality
Effect of glue on wave shape
Prior to discussing the wave shape and the curvature curve of beams that have a section with a different MOE, the effect of the glue must be considered. A section between 55 and 70 cm of the 100-cm uniform beam no. 1 was cut off and
then reincorporated into the uniform beam using glue. The wave shape of the introduced section was detected and compared with the wave shape of the formerly uniform beam. As shown in Fig. 3, the two wave shapes are identical, which suggests that the glue does not affect the wave shape of beams.
Effect of MOE on wave shape and curvature curve
To discuss the wave shape of a beam containing a section with a lower MOE, a section (no. 4) containing a knot was introduced into a uniform beam between 55 and 70 cm, and the wave shape of the refashioned beam was determined. The results shown in Fig. 4 indicate that the wave shape of the beam into which a section with a lower MOE had been introduced differed greatly from the wave shape of the uniform beam. Next, the wave shape of the beam into which the no. 4 section had been introduced was differentiated twice to obtain curvatures crossing the length of the beam. The result can be seen in Fig. 5, where the curvatures of the theoretical wave shape are shown for comparison. As Fig. 2. Comparison of the curvature of the flexural vibration wave
shape at the first mode of a clear beam with the theoretical wave shape. Open symbols, curvature of the wave shape of a clear beam; broken line, curvature of the theoretical wave shape
Fig. 3. Influence of glue lines on the flexural vibration wave shape at the first mode. Open symbols, wave shape of a clear beam containing glue lines; broken line, wave shape of a clear beam
shown in Fig. 5, the curvatures of the section with a lower MOE that was introduced into a uniform beam between 55 and 70 cm (i.e., curvatures of the section of differing quality incorporated into the beam) were obviously higher than those of the same portion of the uniform beam. In addition, to examine the effect of the location of a section of differing quality section, a section (no. 15) containing a knot was introduced into a uniform beam (no. 11) between 45 and 60 cm, and the changes in the curvatures of the refashioned beam were evaluated. Figure 6 shows that the curvatures of the section introduced were obviously higher than the cur-vatures of the same portion of the uniform beam regardless of the location at which the section of differing quality was introduced.
To discuss the wave shape and curvatures of a beam containing a section with a higher MOE, a uniform section (no. 10) with a higher MOE was introduced into a uniform beam (no. 1) between 55 and 70 cm, and the curvatures of the beam were determined. The result, shown in Fig. 7, suggests that if the section introduced into the uniform
beam has a higher MOE the curvatures of the section with a higher MOE are obviously lower than those of the same portion of the uniform beam.
The above results show that when a section with a lower MOE is introduced into a uniform beam the curvatures of that section are higher than those of the same portion of the uniform beam; and when a section with a higher MOE was introduced into a uniform beam, the curvatures of that sec-tion are lower than those of the same porsec-tion of the uniform beam. It was also clarified that when a beam contained a section of differing quality the curvatures of that beam should be markedly different from that of a uniform beam.
Estimate of MOE from changes of curvatures of wave shape
In terms of mechanical properties of the materials, flexural elasticity is inversely proportional to the curvature of the flexural transformation of a beam at the same part. There-fore, if there are two identical beams, the ratio of the MOEs is inversely proportional to the ratio of the curvatures at the same portion. The bending moment generated by flexural vibration should be different between a uniform beam and a beam containing defects, in the strictest sense, though it can be considered that the ratio of the MOEs is approxi-mately inversely proportional to the ratio of the curvatures at the same portion.
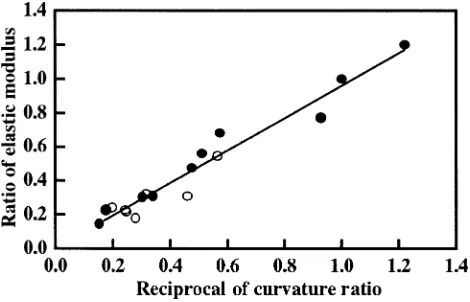
Thus, the curvature curves of each beam into which a section of differing quality had been introduced were deter-mined, and the relation in the section of differing quality between the curvatures and the MOE was determined. The relation is shown in Fig. 8. Note that the reciprocal ratios of the average curvatures of the sections of differing quality to those of the same portion of a uniform beam are directly proportional to the ratios of the MOEs of the sections of the same portion of a uniform beam. Equation (2) describes this linear regression relation.
E E
C
C R
¢
¢
0 957. 0 0004. 0 976. (2) Fig. 5. Influence of a section of differing quality on the curvature of the
flexural vibration wave shape at the first mode. Solid line, curvature of the wave shape of the wooden beam containing a section of differing quality; broken line, curvature of the wave shape of a clear beam
Fig. 6. Curvature of the flexural vibration wave shape at the first mode of a wooden beam with a knot inserted near the center. Solid line, curvature of the wave shape of a wooden beam with a knot inserted near the center; broken line, curvature of the wave shape of a clear beam
Fig. 8. Relation between the dynamic MOE and the curvature of the flexural vibration wave shape at the first mode. Solid circles, section of differing quality located between 55 and 70 cm; open circles, section of differing quality located between 45 and 60 cm
where E is the MOE of the section introduced into a uni-form beam; E is the MOE of the uniuni-form beam; C is the average curvature of the section introduced into the uni-form beam; and C is the average curvature of the uniuni-form beam.
This indicates a high correlation. The results suggest that the MOE of a portion containing defects could be estimated with high accuracy by the curvature curve of that portion, which is obtained from the flexural vibration of a beam with a uniform cross section. Based on the above results, it is thought that the accuracy for detecting the differing quality, such as knots or decays, and the confidence of grading wood can be improved using the wave shape and the curvature curve. However, near the ends of a beam, due to the fact that the curvatures of the wave shape are so small, the accuracy of estimating the MOE and detecting the presence of the defects is thought to have some limitation. The MOE of the defective portion and the distribution of the elasti-city of the wooden beam will be pursued in future studies.
Conclusions
The wave shapes of the flexural vibration at the first mode were determined using the transfer function, and the wave shapes and curvatures of the wave shapes were compared with the theoretical wave shape and the theoretical curva-ture. Based on the results of these comparisons, detection of the portion with the differing quality and the accuracy of estimating the elasticity of that portion were evaluated. The results can be summarized as follows: (1) When a beam contains a portion with a low MOE, such as one containing knots, the curvatures of that portion were higher than the curvatures of the theoretical wave shape of the same por-tion. In contrast, when a beam contains a portion of differ-ing quality with a high MOE, the curvatures of that portion were lower than the curvatures of the theoretical wave shape of the same portion. (2) The relation between the ratios of the MOEs and the inverse ratios of the curvatures indicated a high correlation. (3) The MOE of a defect could be estimated, and the position of the defect could be deter-mined accurately by examining the curvature of the flexural vibration wave shapes.
References
1. Sobue N (1986) Measurement of Young’s modulus by the transient longitudinal vibration of wooden beams using a fast Fourier trans-formation spectrum analyzer (in Japanese). Mokuzai Gakkaishi 32:744–747
2. Yang X, Ishimaru Y, Iida I, Urakami H (2001) Application of modal analysis by transfer function to nondestructive testing of wood. I. Determination of localized defects in wood by the shape of the flexural vibration wave (in Japanese). Mokuzai Gakkaishi 47:304– 310
3. Nagamatsu A (1993) Introduction to modal analysis (in Japanese). Coronasha, Tokyo, pp 221–351