R E S E A R C H
Open Access
Lossy image compression based on
prediction error and vector quantisation
Mohamed Uvaze Ahamed Ayoobkhan
*, Eswaran Chikkannan and Kannan Ramakrishnan
Abstract
Lossy image compression has been gaining importance in recent years due to the enormous increase in the volume of image data employed for Internet and other applications. In a lossy compression, it is essential to ensure that the compression process does not affect the quality of the image adversely. The performance of a lossy compression algorithm is evaluated based on two conflicting parameters, namely, compression ratio and image quality which is usually measured by PSNR values. In this paper, a new lossy compression method denoted as PE-VQ method is proposed which employs prediction error and vector quantization (VQ) concepts. An optimum codebook is generated by using a combination of two algorithms, namely, artificial bee colony and genetic algorithms. The performance of the proposed PE-VQ method is evaluated in terms of compression ratio (CR) and PSNR values using three different types of databases, namely, CLEF med 2009, Corel 1 k and standard images (Lena, Barbara etc.). Experiments are conducted for different codebook sizes and for different CR values. The results show that for a given CR, the proposed PE-VQ technique yields higher PSNR value compared to the existing algorithms. It is also shown that higher PSNR values can be obtained by applying VQ on prediction errors rather than on the original image pixels.
Keywords: Image compression, Artificial neural network, Prediction errors, Vector quantization, Artificial bee colony algorithm and genetic algorithm
1 Introduction
In recent decades, since huge volumes of image data are transmitted over networks, image compression has be-come one of the most important research areas [1, 2]. With the rapid development of digital image technology, the demand to save raw image data for further image processing or repeated compression is increasing. More-over, the recent growth of large volume of image data in web applications has not only necessitated the need for more efficient image processing techniques but also for more efficient compression methods for sto-rage and transmission applications[1, 2]. The goal of the image compression is not only to reduce the quantity of bits needed to represent the images but also to adapt the image quality in accordance with the users’ requirements [3, 4].
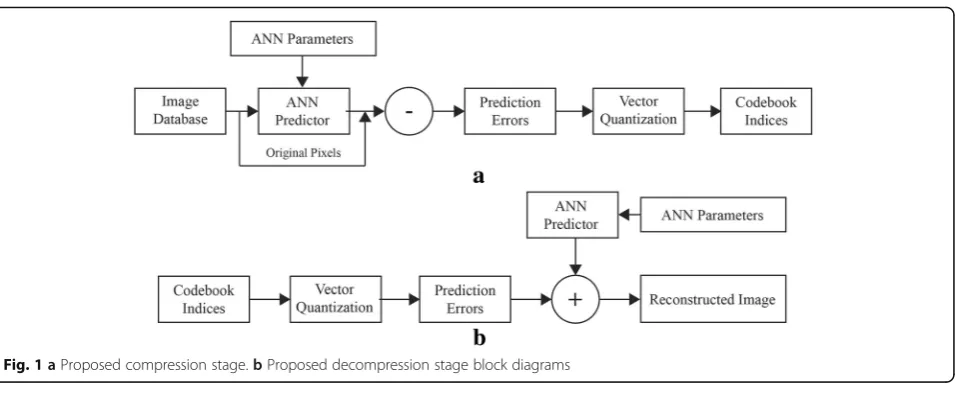
A variety of compression techniques has been pro-posed in the recent years [2, 4, 5]. Similarly, prediction techniques have been widely used in many applications including video processing [6, 7]. A new algorithm which makes use of prediction error and vector quantization concepts, denoted as PE-VQ method is proposed in this paper. Artificial neural network (ANN) [8, 9] is employed for prediction. Instead of the original image pixel value, only the prediction error (PE) which is the difference between the original and predicted pixel values are used in the compression process. Identical ANNs are employed both at the compression and de-compression stages. In order to achieve de-compression, vector quantization (VQ) is applied to the prediction er-rors. Vector quantization has become one of the most popular lossy image compression techniques due to its simplicity and capability to achieve high compression ra-tios [10, 11]. VQ involves finding the closest vector in the error codebook to represent a vector of image pixels. When the closest vector is identified, only the index of the vector in the codebook is transmitted thus achieving * Correspondence:[email protected]
Centre for Visual Computing, Faculty of Computing and Informatics, Multimedia University, Jalan Multimedia, Cyberjaya 63100, Selangor, Malaysia
EURASIP Journal on Image
and Video Processing
© The Author(s). 2017Open AccessThis article is distributed under the terms of the Creative Commons Attribution 4.0 International License (http://creativecommons.org/licenses/by/4.0/), which permits unrestricted use, distribution, and reproduction in any medium, provided you give appropriate credit to the original author(s) and the source, provide a link to the Creative Commons license, and indicate if changes were made.
Ayoobkhanet al. EURASIP Journal on Image and Video Processing (2017) 2017:35
compression. It is found that higher PSNR values can be obtained by applying VQ on the prediction errors in-stead of on the original image pixels.
The VQ approach employed in this paper makes use of a novel technique [12]which applies a combination of two algorithms, namely, artificial bee colony (ABC) algorithm [13] and genetic algorithm (GA) [14] for constructing the codebook. It is shown that the use of this new method yields a better optimised error codebook compared to the existing methods.
The remaining of the paper is organised as follows: Section 2 describes the related works. The proposed methodology is discussed in Section 3. Section 4 describes the databases used for the evaluation of the proposed method. Experimental results and discussions are given in Section 5 and conclusions presented in Section 6.
2 Related work
Generally compression methods can be categorised into two classes as lossy and lossless methods. Lossy pression can achieve high compression ratios (CR) com-pared to lossless compression methods. Several lossy methods which focus mostly on compression ratios without much consideration for image quality have been published [15, 16]. A lossy hyperspectral image compres-sion scheme, which is based on intra-band prediction and inter-band fractal encoding has been reported in [17]. Chen Yaxiong et al. (2016) [18] have proposed a lossy image compression scheme which combines principal component analysis and countourlet transform to achieve high compression ratio along with better image quality.
Engelson et al. (2000) [19] have proposed lossless and lossy delta compression schemes for time series data. Lindstrom et al. (2006) [20] have proposed a prediction-based lossless and lossy floating-point compression schemes for 2D and 3D grids in which the authors have used Lorenzo predictor and fast entropy encoding scheme. In [21], Zhang et al. (2008) have presented an image compression method, called prediction by partial approximate matching (PPAM) method which involves four basic steps, namely, preprocessing, prediction, con-text modelling, and arithmetic coding. In [22], B.T.A Munteanu, and Peter Schelkens (2015) have proposed a lossy compression scheme for medical images which makes use of a generic codec framework that supports JPEG 2000 with its volumetric extension (JP3D), and di-rectional wavelet transforms.
In [10], L. T. Chuen and C.Y. Chang (2010) have surveyed the recent developments in vector quantization codebook generation schemes which include enhanced Linde-Buzo-Gray method, neural network and genetic based algorithms. H.S Morteza and A.R.N. Nilchi (2012) [23] have proposed a context-based method to overcome the contextual vector quantization challenges. In this
paper, the authors have identified the regions of interest first, applied low compression to the identified regions with high compression applied to the background re-gions. Horng and Ming-Huwi (2012) [24] have pro-posed a method based on the firefly algorithm to construct the codebook. Thepade Sudeep and Ashish Devkar (2015) [25] have proposed a vector quantization (VQ)-based lossy image compression method. In this paper, the authors have used a new codebook gene-ration technique called Thepade’s Hartley error vector rotation method.
In [12], Mohamed Uvaze et al. have proposed a code-book based compression method called IP-VQ method where the codebook is constructed based on the original image pixels. A new method called PE-VQ method is presented in this paper which differs from the IP-VQ method in the sense that the codebook construction is done based on the prediction errors rather on the image pixels. It is expected that a prediction error based code-book can achieve higher compression ratios as well as higher PSNR values compared to the image pixel based codebook due to the following reasons: (i) In the PE-VQ method, the size of the code words in the codebook will be less compared to the size in the IP-VQ since they represent only the error values instead of the actual pixel values. (ii) In the PE-VQ method, since the error values use less number of bits compared to the IP-VQ method, the code word computation will be more accurate. It may be noted that in both PE-VQ and IP-VQ methods, the codebook construction is based on the same hybrid method which makes use of a combination of ABC and genetic algorithms.
3 Proposed methodology
The proposed PE-VQ method makes use of a combi-nation of two algorithms [12], namely, artificial bee colony (ABC) algorithm [13], and genetic algorithm (GA) [14].
3.1 Artificial neural network
In the proposed work, an artificial neural network (ANN) [8, 9] comprising three layers, namely, input, hidden and output layers is employed as a predictor at the compression and decompression stages. Figure 2 shows a typical three layer ANN. The ANN is trained in the first phase in-order to determine the optimum
edge weight vectors γ and β. Different activation
functions such as linear, sigmoid and hyperbolic tan-gent functions as well as different training algorithms such as Levenberg-Marquardt, Resilient Backpropa-gation, and BFGS quasi-Newton backpropagation are tested initially in-order to identify the best combi-nation which yields the minimum root-mean-square error (RMSE) during the training phase.
The predicted valueYis given by Eq. (1).
Y¼Ω β0þ Xh
j¼1
βjΦ γj0þ Xd
i¼1
γjiAi !
( )
ð1Þ
where (β0, β1, …, βh, γ10, γ11…, γhd) represent the bias and weight parameters. The functions Φ and Ω in Eq. (1) represent the activation functions applied at the hidden and output layer neurons respectively.
3.1.1 Prediction process
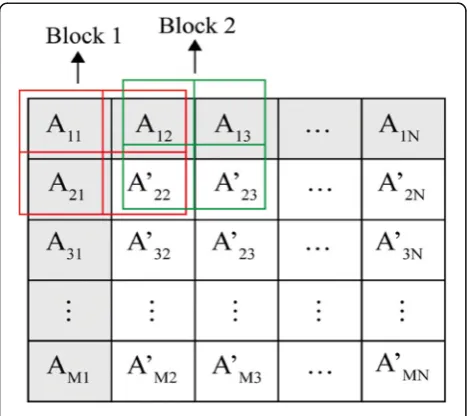
Figures 3 and 4 show, respectively, a M x N image matrix A and the corresponding predicted matrix A’. It may be noted from Fig. 4 that the values in the first row and the first column cells represent the original image pixel values and the values in the remaining cells, namely, Amn (m, n> 1) represent the predicted pixel
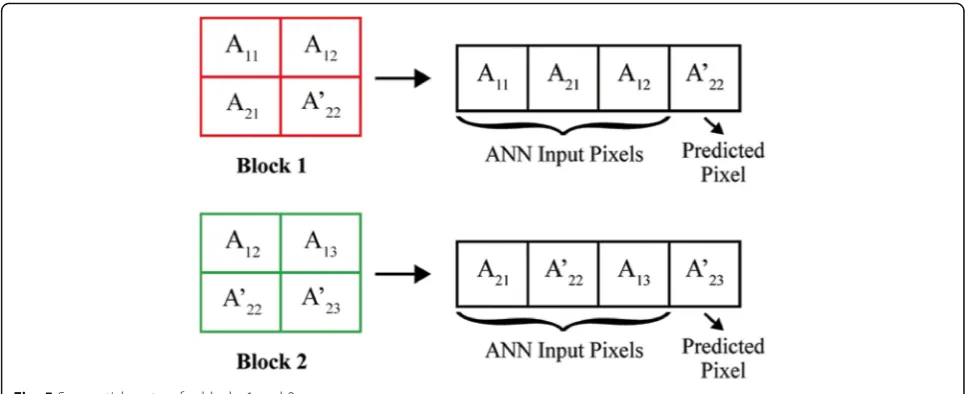
values. The prediction process is illustrated in Fig. 4. The M × N image matrix is split up into 2 × 2 overlapped blocks as shown in Fig. 4. Each block is represented as a sequential vector of size 4 as shown in Fig. 5, in which the first 3 pixel values form the input vector and the last value Fig. 1aProposed compression stage.bProposed decompression stage block diagrams
Fig. 2Neural network structure
represents the predicted value of the fourth pixel. In other words, the predicted value of A22 represented as A’22 is
obtained by using the pixel values A11, A21, and A12.
Similarly, the predicted value of A23represented as A’23is
obtained by using the pixel values A12, A’22, and A13. This
process continues for the remaining pixels.
The prediction error matrix PE = {PEij} of size (M-1) x
(N-1) is determined as shown in Eq. (2) [26].
PEij ¼Amn‐A’mn; fori¼m‐1;j¼n‐1 andm;n>1 ð2Þ
The prediction process is implemented in a lossless manner as follows:
The predicted values are rounded-off to the nearest in-tegers in order to make the prediction error values also
integers. The rounding-off operation is carried out both at the compression and decompression stages.
In the proposed method, the loss occurs only during the vector quantization process.
3.2 Vector quantization of prediction errors based on codebook
Vector quantization based on a error codebook (ECB) is applied to the prediction errors. In this work, a new method called ABC-GA technique which makes use of a combination of ABC [13] and GA [14] algorithms is employed for ECB generation. The flow diagram of ECB generation is shown is Fig. 6.
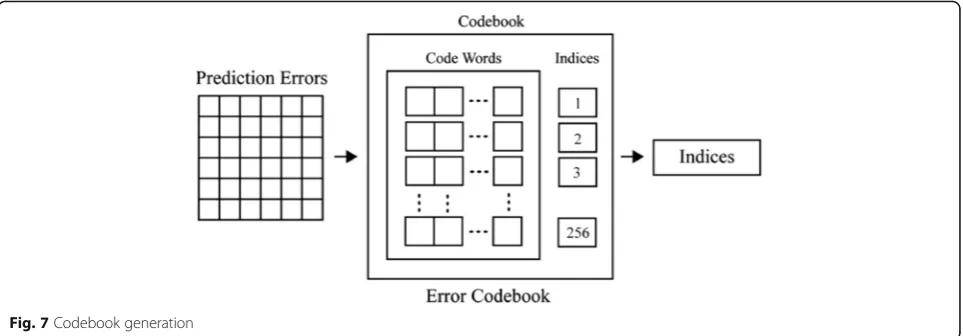
The prediction error matrix PE is decomposed into a set of non-overlapping blocks of size p x q pixels. Each error block represents an error code vector (ECV) with length L=p × q. Let us assume that a PE matrix con-tainsλnumber of ECVs. Based on these ECVs, a signifi-cantly reduced number of (say S) representative ECVs called error code words (ECW) are obtained using an optimization procedure to form an error codebook (ECB) of size S. The optimization procedure adopted in the proposed method makes use of a combination of ABC and GA algorithms which is described in Session 3.3. Figure 7 illustrates the steps involved in quantizing the prediction errors. For each ECV in the PE matrix, the best matching ECW in the ECB is identified based on the Euclidian measure which is defined as in Eq. (3)
whereXandCdenote ECV and ECW, respectively.
Eu ¼ XLi¼1ðXui − CviÞ 2
ð3Þ
where Εu is the error or distortion between the error code vector Xuand the error code wordCv.
Eq. (3) is computed for v= 1, 2…S where S is the size of the error codebook. The matching ECW (Cv) for the error code vector Xu(i.e., error block u) is identified as the one corresponding to the index value v which yields the minimum value forΕu. This index value will then be stored in the memory instead of the error blocku.
Compression ratio (CR) is defined as in Eq. (4):
CR¼ Input file size bitsð Þ
Output file size bitsð Þ ð4Þ
In the proposed method, CR can be calculated as shown in Eq. (5).
CR¼ LK
log2ð ÞS ð5Þ
where L represents the error code vector, K represents the number of bits used to represent a image pixel and S represents the codebook size.
Fig. 3Original image matrix
Codebooks of sizesS= 128, 256 and 512 are considered in this work withK= 8 bits. The compression ratios obtained for these cases will be (8/7) L, L and (8/9) L respectively.
3.3 ABC-GA technique for error codebook formation
In the proposed method, ABC-GA technique [12] is used to determine the error code words which constitute the error codebook. The proposed ABC-GA technique combines the best features of the two algorithms, namely ABC and GA algorithms [13, 14].
ABC algorithm employs three types of bees or phases, namely, employed bees (EB), onlookers bees (OB) and scout bees (SB). In the EB phase, initial set of ECVs, among the available ECVs is selected based on fitness value. In the OB phase, the best ECVs among the set of ECVs are identified using the greedy approach. In the SB phase, ECWs are selected based on the ECVs identified in the EB and OB phases. The problem with ABC algorithm is that the best ECVs may not get selected in the OB phase due to local minima problem. In-order to overcome this problem, the OB phase is replaced by GA. The GA method uses genetic operands (crossover and mutation) to determine the best ECVs from a set of ini-tial and new crossover ECVs. On the other-hand, if GA method is applied independently for ECW selection, it will take more memory space and will also take longer time for computation since new ECVs are to be gene-rated based on the crossover of all the original ECVs.
In general, the GA method takes more time to converge, though its accuracy is high. On the other hand, the ABC method takes less time for convergence but its accuracy of convergence is low as it suffers from the problem of falling into local minima values. The efficiencies of these two algorithms can be improved by overcoming the limitations cited above. For this purpose, we make use of a combi-nation of ABC and GA algorithms called ABC-GA method in which the GA is introduced in the OB phase of the ABC algorithm.
In ABC-GA method, initially the centroids of the clus-ters obtained in the EB phase are selected. These cen-troids form the inputs for the GA, where the crossover and mutation processes are applied to obtain the next generation ECVs. The optimal cluster centers are then identified based on the initial and new set of ECVs by using the Linde-Buzo-Gray algorithm [27]. Finally, in the Fig. 5Sequential vectors for blocks 1 and 2
Fig. 6Error codebook generation
SB phase, the centroids obtained in the EB and OB phases are compared based on the fitness values to se-lect the final set of code words. Pseudocode.1 shows the steps involved in the implementation of the ABC-GA method [12] for error codebook formation.
3.4 Computational complexity
The proposed method involves computationally intensive operations such as prediction and vector quantization both at the encoding and decoding stages. The prediction process makes use of ANNs which require training using algorithms such as Levenberg-Marquardt, Resilient Back-propagation, and BFGS quasi-Newton backpropagation and also trial and error experiments to identify the opti-mal configuration based on the root mean square error (RMSE) values. Similarly the vector quantization process involves codebook generation using ABC and genetic algorithms. Hence it is expected that the computational complexity of the proposed method will be higher when compared to JPEG 2000.
4 Database description
The performance of the proposed PE-VQ method is evaluated using three test databases, namely, CLEF med 2009 database (DB1) [28], Corel database (DB2) [29] and standard test images database (DB3) [30] in terms of CR and peak signal-to-noise ratio (PSNR) [31] values. These results are compared with those obtained by the existing algorithms, namely, IP-VQ method [12], JPEG2000 method [32], singular value decomposition and wave dif-ference reduction (SVD & WDR) method [33].
4.1 CLEF med2009 database (DB1)
The CLEF med 2009 [28] is a medical dataset containing more than 15 K images, in which 1000 images of 12 classes are selected manually. The following are the details of the 12 classes:
1. Chest (100) 2. Neck (50) 3. Leg (100)
4. Skull front view (100) 5. Skull left view (100) 6. Skull right view (50) 7. Radius and ulna bones (100) 8. Mammogram right (100) 9. Mammogram left (100) 10.Pelvic girdle (100) 11.Hand X-ray images (50) 12.Pelvic girdle + back bone (50)
Figure 8 shows some random sample images selected from the CLEF med 2009 dataset.
4.2 Corel database (DB2)
The Corel dataset [29] contains 1000 images of 10 clas-ses with 100 images in each class. Figure 9 shows some sample images in the dataset.
Fig. 7Codebook generation
Pseudocode.1. Steps to implement ABC-GA
1: Acquire the set of ECVs
2: Initialize one EB for each ECV
a) Determine neighbour vectors of EB
b) Approximately calculate the fitness for each ECV
3: Apply genetic algorithm in OB phase
a) Produce new ECV from existing ECVs by crossover operation
b) Compute the best fitness value (BFV) and normalize the probability value
c) Apply mutation to form new set of ECW based on BFV
4: Generate a next combination of ECV in place of rejected ECV on scout bees phase and repeat 2 and 3 until requirements are met
The following are the details of the 10 classes from Corel 1 K dataset.
1. African People 2. Beach
3. Building 4. Bus 5. Dinosaur 6. Elephant 7. Flower 8. Horse 9. Mountain 10.Food.
4.3 Standard images (DB3)
Figure 10 shows some standard benchmarking images [30] such as Lena, Barbara, Cameraman, Peppers, Man,
Goldhill, and Boats that are used for testing the pro-posed system.
5 Experimental results and discussion
In the experiments conducted, it is assumed that the original image is grey scale image with each pixel repre-sented by 8 bits. From the experimental results, it is
found that the error values range from −32 to 32 and
hence the prediction errors are represented with 6 bits. Different values of CR are obtained by varying the size of ECV (L) in Eq. (5). The ANN parameters such as weights and biases, activation functions, training algorithm used, number of input and hidden layer neurons are assumed to be available both at the compression and decompression stage, hence their values are not considered while comput-ing the CR values. For codebook generation, 60% of the total available images (100) are used for training and all the 100 images are used for testing for group images such Fig. 8aChest.bLeg.cRadius and Ulna bones.dPelvic Girdle.eSkull.fHand palm
Fig. 9a–cSample images of the COREL dataset
as DB1 and DB2. In the case of individual images, the same image is used for training as well as for testing.
5.1 Performance evaluation using DB1
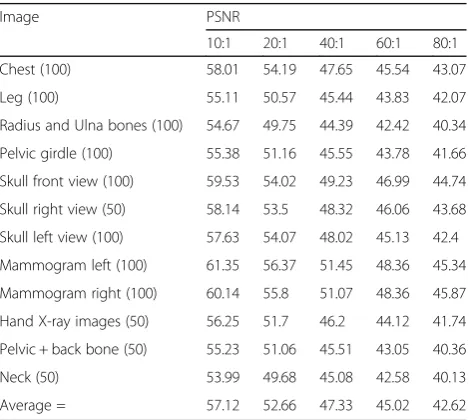
Table 1 shows the CR and PSNR values obtained for DB1using the proposed PE-VQ method. The number of randomly selected images in each class is also indicated in brackets in Table 1.
The results in Table 1 show that the proposed PE-VQ method performs well with the medical images, since PSNR values greater than 57, 52, 47, 45, and 42 are achieved for CR = 10, 20, 40, 60, and 80, respectively.
The experiment was repeated for error codebook sizes of 512 and 128 also. Figure 11 shows the average com-pression ratio versus average PSNR for the three error codebook sizes for DB1 using the PE-VQ method.
It is clear from Fig. 11 that the PSNR values increase with increasing ECB sizes. Figure 12 compares the CR and PSNR values obtained for error codebook size =256 by using PE-VQ and IP-VQ methods.
Fig. 10a–fStandard images for testing
Table. 1CR and PSNR values obtained for DB1 (codebook size = 256)
Image PSNR
10:1 20:1 40:1 60:1 80:1
Chest (100) 58.01 54.19 47.65 45.54 43.07
Leg (100) 55.11 50.57 45.44 43.83 42.07
Radius and Ulna bones (100) 54.67 49.75 44.39 42.42 40.34
Pelvic girdle (100) 55.38 51.16 45.55 43.78 41.66
Skull front view (100) 59.53 54.02 49.23 46.99 44.74
Skull right view (50) 58.14 53.5 48.32 46.06 43.68
Skull left view (100) 57.63 54.07 48.02 45.13 42.4
Mammogram left (100) 61.35 56.37 51.45 48.36 45.34
Mammogram right (100) 60.14 55.8 51.07 48.36 45.87
Hand X-ray images (50) 56.25 51.7 46.2 44.12 41.74
Pelvic + back bone (50) 55.23 51.06 45.51 43.05 40.36
Neck (50) 53.99 49.68 45.08 42.58 40.13
Average = 57.12 52.66 47.33 45.02 42.62
We note from Fig. 12 that by applying VQ on predic-tion errors, we are able to get higher PSNR values com-pared to those obtained by applying VQ on original pixel values.
5.2 Performance evaluation using DB2
Table 2 shows the PSNR values obtained by the pro-posed method for the Corel 1 K database (DB2)
Table 2 results show that the proposed PE-VQ method performs well with the DB2, since PSNR values greater than 51, 48, 45, 42, and 39 are achieved for CR = 10, 20, 40, 60, and 80, respectively.
Figure 13 shows the average compression ratio versus average PSNR for the error codebook (ECB) size = 512, 256 and 128, respectively, for Corel 1 K database (DB2).
Figure 14 compares the CR and PSNR values obtained for error codebook size =256 by using IP-VQ and PE-VQ methods.
The results shown in Figs. 13 and 14 for DB2 are simi-lar to those obtained for DB1.
5.3 Performance evaluation using DB3
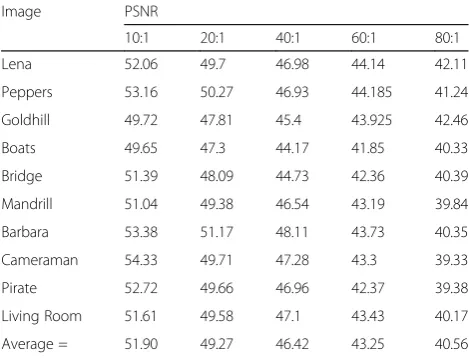
Table 3 shows the PSNR values obtained by the pro-posed method for the standard images (DB3).
Table 3 results show that the proposed PE-VQ method performs well with the DB3, since PSNR values greater than 51, 49, 46, 43, and 40 are achieved for CR = 10, 20, 40, 60, and 80, respectively.
Figure 15 shows the average compression ratio versus average PSNR for the error codebook (ECB) size = 512, 256 and 128, respectively, for standard images (DB3).
Figure 16 compares the CR and PSNR values obtained for error codebook size =256 by using image pixel and prediction error-based methods.
The results obtained for DB3 are also similar to those obtained for DB1 and DB2. From Figs. 11, 13, and 15 Fig. 12Comparison of PE-VQ and IP-VQ methods for DB1
with ECB = 256
Table. 2CR and PSNR values obtained for DB2 (codebook size = 256)
Image PSNR
10:1 20:1 40:1 60:1 80:1
African People 49.88 47.39 44.54 41.42 38.11
Beach 52.26 49.65 46.67 43.40 39.93
Building 48.46 46.04 43.27 40.25 37.03
Bus 51.17 48.61 45.69 42.50 39.10
Dinosaur 54.96 52.21 49.08 45.64 41.99
Elephants 51.09 48.54 45.62 42.43 39.04
Flower 50.92 48.37 45.47 42.29 38.91
Horse 49.86 47.37 44.52 41.41 38.10
Mountain 51.41 48.84 45.91 42.70 39.28
Food 50.62 48.09 45.20 42.04 38.68
Average = 51.06 48.51 45.60 42.41 39.01
Fig. 13Average CR Vs Average PSNR graph for ECB size = 512, 256, and 128 for DB2 using PE-VQ method
Fig. 14Comparison of PE-VQ and IP-VQ methods for DB2 with ECB = 256
(corresponding to DB1, DB2, and DB3 respectively), it is clear that higher PSNR values are obtained for ECB size = 512 compared to 256 and 128. It is due to the fact that for a given ECV, the probability of finding a more optimum error code word in ECB increases with in-creasing ECB size which results in higher PSNR values. In other words, a more optimum codebook is obtained with higher ECB size.
From Figs. 12, 14, and 16 (corresponding to DB1, DB2, and DB3, respectively), it may be noted that PE-VQ method yields higher PSNR values compared to IP-VQ method. As the size of the error code word in PE-VQ method (6 bits) is less compared to the image pixel code word size in IP-VQ method (8 bits), the distortion error Eu given in Eq. (5) is reduced resulting in higher PSNR values. In other words, a more optimum error codebook is obtained in the PE-VQ method when compared to IP-VQ method.
Figure 17 shows a comparison of the proposed PE-VQ method with other known methods, namely, IP-VQ [12], JPEG2000 [32], SVD and WDR [33] for DB3.
From Fig. 17, it is clear that the proposed PE-VQ method yields better PSNR values compared to other known methods. The reason for achieving higher PSNR values using the proposed PE-VQ method can be ex-plained as follows.
Compression is achieved in the PE-VQ method in two stages, namely, prediction and vector quantization (codebook formation). As mentioned in section 3.1.1, the prediction process is implemented in a lossless man-ner and hence no quality degradation occurs due to this process. In the second stage, the codebook is formed based on prediction errors and not based on original image pixels as in the other methods [12, 32, 33]. Due to this, the sizes of the clusters in the codebook formation process become smaller and hence it
Table. 3CR and PSNR values obtained for standard images (DB3)
Image PSNR
10:1 20:1 40:1 60:1 80:1
Lena 52.06 49.7 46.98 44.14 42.11
Peppers 53.16 50.27 46.93 44.185 41.24
Goldhill 49.72 47.81 45.4 43.925 42.46
Boats 49.65 47.3 44.17 41.85 40.33
Bridge 51.39 48.09 44.73 42.36 40.39
Mandrill 51.04 49.38 46.54 43.19 39.84
Barbara 53.38 51.17 48.11 43.73 40.35
Cameraman 54.33 49.71 47.28 43.3 39.33
Pirate 52.72 49.66 46.96 42.37 39.38
Living Room 51.61 49.58 47.1 43.43 40.17
Average = 51.90 49.27 46.42 43.25 40.56
Fig. 15Average CR Vs average PSNR graph for ECB size = 512, 256, and 128 for DB3 using PE-VQ method
Fig. 16Comparison of PE-VQ and IP-VQ methods for DB3 with ECB = 256
becomes possible to identify a more accurate code word for each cluster. In addition, in the proposed method, an efficient algorithm (ABC-GA) is used to locate the cluster centres more accurately. Since the overall loss is minimized in the compression process, the PE-VQ method is able to achieve higher PSNR values compared to other methods.
The proposed PE-VQ method can be extended to color images also by decomposing it into the three basic color components R, G, and B and applying the pro-posed method to each color component separately.
5.4 Discussion
The results presented in Section 5.1, Section 5.2, Section 5.3 are obtained without considering the additional side
parameters to be transmitted. We need to transmit the following ANN and VQ parameters.
ANN Parameters:
1. Number of input neurons (3) = 2 bits 2. Input edge weights (30*32) = 120 bytes 3. Output edge weights 10*32 = 40 bytes 4. Bias at hidden layer (10*32) = 40 bytes 5. Transfer (activation) function index = 2 bits 6. Training function index = 4 bits
7. Initial image sample inputs(512 + 512) = 1024 bytes
Number of bytes needed to transfer ANN parameters are 1225 bytes.
VQ parameters: Fig. 18Comparison of CR and PSNR values of PE-VQ method with existing methods using Lena image
Fig. 19Comparison of CR and PSNR values of PE-VQ method with existing methods using Peppers image
VQ parameter values vary according to the sizes of codebook and code word.
1. Maximum number of bits required for the PE’s = 6 bits
2. Size of code word = 10,20,40,60,80 3. Codebook size = 128,256,512
Number of bytes needed to transfer VQ parameters vary from 960 (6*10*128) to 30,720 (6*80*512)
It is found that when sending group of images (such as DB1), the CR values in the lower range 10 to 40 are not affected significantly. For CR values in the higher range (40-80), the maximum reduction in CR values is around 8%.
The effect of side parameters on Lena and Pepper images are shown in Figs. 18 and 19 respectively
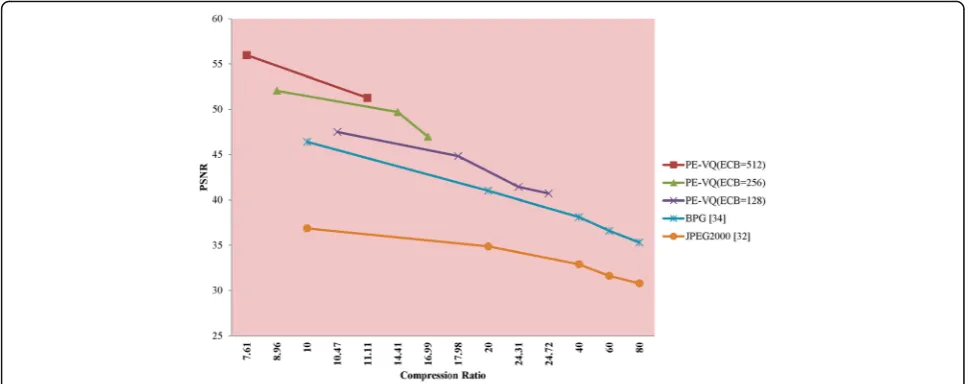
It is noticed from the Figs. 18 and 19, the maximum CR value that can be obtained with the proposed method is only 25(approx.). For CR values >25, the sig-nificant increase in the number of side parameters causes a reduction in the CR value. Further it may be observed that for CR values up to 25, the PE-VQ method yields higher PSNR values compared to the existing methods, namely, BPG [34] and JPEG2000 [32].Thus, it can be concluded that the proposed method can be used with advantage for applications where the CR values are less than 25. On the other hand, there is no such constraint for the PE-VQ method when sending group of images such as DB1 since the side parameters do not make any significant change. Hence, when sending group of images, the proposed method has an advantage over the other methods as it yields higher PSNR values without any restriction on the CR value.
6 Conclusions
A new lossy image compression scheme called PE-VQ method which makes use of prediction errors with a codebook has been presented. The codebook has been constructed using a combination of artificial bee colony and genetic algorithms. The proposed method has been tested using three types of image databases, namely, CLEF med 2009, Corel 1 k database and standard images. The experimental results show that the pro-posed PE-VQ method yields higher PSNR value for a given compression ratio when compared to the existing methods. The prediction error-based PE-VQ method is found to achieve higher PSNR values compared to those obtained by applying VQ on the original image pixels.
Acknowledgements
The authors thank Multimedia University, Malaysia for supporting this work through Graduate Research Assistantship Scheme. They also wish to thank
the anonymous reviewers for their comments and suggestions which helped in enhancing the quality of the paper.
Funding
This work is supported by the Multimedia University, Malaysia.
Authors’contributions
CE contributed towards the general framework of the proposed prediction based model for image compression. AMUA carryout the implementation of the research idea and tested the proposed method using three different datasets. RK carried out the analysis of the experimental results and checked the correctness of the algorithms applied. All the three authors took part in writing and proof reading the final version of the paper.
Competing interests
The authors declare that they have no competing interests.
Publisher’s Note
Springer Nature remains neutral with regard to jurisdictional claims in published maps and institutional affiliations.
Received: 15 July 2016 Accepted: 10 May 2017
References
1. DM Chandler,“Seven challenges in image quality assessment: past, present, and future research,”ISRN Signal Processing, 2013
2. G Vijayvargiya, S Silakari, R Pandey,“A survey: various techniques of image compression,”arXiv preprint arXiv:1311.687, 2013
3. D Taubman, High performance scalable image compression with EBCOT. IEEE Trans. Image Process. 9(7), 1158–1170 (2000)
4. S Masood, M Sharif, M Yasmin, M Raza, S Mohsin, Brain image compression: a brief survey. Res. J. Appl. Sci. 5, 49–59 (2013)
5. Blelloch GE, "Introduction to data compression," Computer Science Department, Carnegie Mellon University, 2001. https://karczmarczuk.users. greyc.fr/matrs/Dess/RADI/Refs/compression.pdf.
6. C Yan, Y Zhang, F Dai, X Wang, L Li, Q Dai, Parallel deblocking filter for HEVC on many-core processor. Electron. Lett. 50(5), 367–368 (2014) 7. C Yan, Y Zhang, F Dai, J Zhang, L Li, Q Dai, Efficient parallel HEVC
intra-prediction on many-core processor. Electron. Lett. 50(11), 805–806 (2014) 8. D Svozil, V Kvasnicka, J Pospichal, Introduction to multi-layer feed-forward
neural networks. Chemom. Intel. Lab. Syst. 39(1), 43–62 (1997) 9. B Karlik, AV Olgac, Performance analysis of various activation functions in
generalized MLP architectures of neural networks. Int. J. Artif. Intell. Expert. Syst. 1(4), 111–122 (2011)
10. TC Lu, CY Chang, A survey of VQ codebook generation. J. Inf. Hiding Multimedia Signal. Process. 1(3), 190–203 (2010)
11. HB Kekre, T Sarode, Two level vector quantization method for codebook generation using Kekre’s proportionate error algorithm. Int. J. Image Process. 4(1), 1–10 (2010)
12. Mohamed Uvaze Ahamed A, Eswaran C and Kannan R, "Lossy Image Compression based on Vector Quantization using Artificial Bee Colony and Genetic Algorithms," International Conference on Computational Science and Technology, Kota Kinabalu, Sabah, November 2016.(To be published in the journal: Advanced Science Letters)
13. D Karaboga, B Basturk, Artificial bee colony (ABC) optimization algorithm for solving constrained optimization problems, inInternational fuzzy systems association world congress(Springer, Berlin Heidelberg, 2007), pp. 789–798 14. U Maulik, S Bandyopadhyay, Genetic algorithm-based clustering technique.
Pattern Recognit. 33(9), 1455–1465 (2000)
15. CH Son, JW Kim, SG Song, SM Park, YM Kim, Low complexity embedded compression algorithm for reduction of memory size and bandwidth requirements in the JPEG2000 encoder. IEEE Trans. Consum. Electron. 56(4), 2421–2429 (2010)
16. YX Lee, TH Tsai, An efficient embedded compression algorithm using adjusted binary code method, inProceedings of the IEEE international symposium on circuits and system, 2008, pp. 2586–2589
18. Chen Y, Huang Z, Sun H, Chen M and Tan H, "Lossy Image Compression Using PCA and Contourlet Transform," In MATEC Web of Conferences, Vol. 54, EDP Sciences, 2016. http://search.proquest.com/openview/
18817d58241afa784bacda038cedfb0c/1?pq-origsite=gscholar&cbl=2040549. 19. V Engelson, D Fritzson, P Fritzson, Lossless compression of high-volume
numerical data from simulations, inData Compression Conference, 2010, p. 574
20. P Lindstrom, M Isenburg, Fast and efficient compression of floating-point data. IEEE Trans. Vis. Comput. Graph. 12(5), 1245–1250 (2006)
21. Y Zhang, DA Adjeroh, Prediction by partial approximate matching for lossless image compression. Image Processing. IEEE Trans. Image Process. 17(6), 924–935 (2008)
22. T Bruylants, A Munteanu, P Schelkens, Wavelet based volumetric medical image compression. Signal Process. Image Commun. 31, 112–133 (2015) 23. SM Hosseini, AR Naghsh-Nilchi, Medical ultrasound image compression using
contextual vector quantization. Comput. Biol. Med. 42(7), 743–750 (2012) 24. MH Horng, Vector quantization using the firefly algorithm for image
compression. Expert Syst. Applications 39(1), 1078–1091 (2012)
25. S Thepade, A Devkar, Appraise of similarity measures in image compression using vector quantization codebooks of Thepade's Cosine and Kekre's Error Vector Rotation, inIEEE International Conference on Pervasive Computing (ICPC), 2015, pp. 1–6
26. A Mohamed Uvaze Ahamed, C Eswaran, R Kannan, CBIR system based on prediction errors. J. Inf. Sci. Eng. 33(2), 347–365 (2017)
27. Y Linde, A Buzo, R Gray, An algorithm for vector quantizer design. IEEE Trans. Commun. 28(1), 84–95 (1980)
28. TM Deserno, S Antani, L Rodney Long, Content-based image retrieval for scientific literature access. Methods Inf. Med. 48(4), 371 (2009) 29. Database URL http://wang.ist.psu.edu/docs/related/
30. Database URL http://sipi.usc.edu/database/database.php?volume=misc 31. Olson DL and Delen D, "Advanced data mining techniques," Springer
Science & Business Media, 2008, pp. 138-145. https://books.google.com/ books?hl=en&lr=&id=2vb-LZEn8uUC&oi=fnd&pg=PA2&dq=Olson+DL+and +Delen+D,+%22Advanced+data+mining+techniques,&ots=zVa-W92RoP&sig=kEiFlEf6-rdNUAAAFJ5JM4Z7Pcs.
32. NN Ponomarenko, VV Lukin, KO Egiazarian, L Lepisto, Adaptive visually lossless JPEG-based color image compression. SIViP 7(3), 437–452 (2013) 33. AM Rufai, G Anbarjafari, H Demirel, Lossy image compression using singular
value decomposition and wavelet difference reduction. Digital Signal Process. 24, 117–123 (2014)
34. E Kougianos, SP Mohanty, G Coelho, U Albalawi, P Sundaravadivel, Design of a high-performance system for secure image communication in the Internet of Things. IEEE Access 4, 1222–1242 (2016)