R E S E A R C H
Open Access
Wood density and carbon
concentration of coarse woody debris in
native forests, Brazil
Andréa B. Moreira
1,2*, Timothy G. Gregoire
2and Hilton Thadeu Z. do Couto
1Abstract
Background: With the objective of increasing knowledge on biomass and carbon stocks, and thus improving the accuracy of published estimates, the present study explored wood density and carbon concentration of coarse woody
debris (diameter≥10) by decay class in a Seasonal Semi-deciduous Forest (SSF) area in the Atlantic Rain Forest and in
a Cerradosensu-stricto(CSS) area (Brazilian savanna), in Brazil. Two strata were identified in each area and ten sampling units were systematic located in each stratum. Data were collected according to the line intersect sampling method. Each tallied element, the diameter, length, and perpendicular width were recorded at the transect intersection point. Each element was classified into a decay class, and the species was identified when possible. Sample discs were cut from each element, from which cylindrical samples were extracted and oven-dried to determine density. These cylinders were milled and analyzed using a LECO-C632 to determine carbon concentration as percentage of mass. Results: In both areas, wood density decreased as the decay class increased. For SSF the mean carbon concentration of all analyzed samples was 49.8% with a standard deviation of 3.3, with a range of 27.9–57.0% across 506
observations. For CSS the general mean was 49.6% with a standard deviation of 2.6, with a range of 31.2–54.5% over 182 observations. Carbon concentration barely change between decay classes. Carbon stock was estimated at 3.3 and 0.7 MgC/ha for the SSF and the CSS, respectively. Similar results were obtained when using a 50% conversion constant. Conclusions: The present study concludes that wood density decreases as the woody debris becomes more decomposed, a pattern found in many previous studies. The carbon concentration, however, barely changes between decay classes, and that result is consistent with most of the literature reviewed. Our carbon concentrations are very close to the 50% used most commonly as a conversion factor. We strongly recommend that future studies of CWD evaluate wood density and carbon concentration by decay class to address the uncertainty still found in the literature.
Keywords: Carbon concentration, Wood density, Coarse woody debris, Seasonal semi-deciduous forest, Brazilian savanna
Background
Forests play a main role in the carbon cycle, contribut-ing to a substantial portion of the world’s carbon stocks. Collectively, the world’s forests store more than 650 billion tons of carbon: 44% in biomass, 11% in dead wood and litter, and 45% in the soil (FAO 2010). Dead woody debris thus constitutes an important component
*Correspondence:[email protected]
1Department of Forestry Sciences - Luiz de Queiroz College of Agriculture
(ESALQ) - University of São Paulo (USP), Rua Pádua Dias, 11 - 13418-900, Piracicaba, SP, Brazil
2School of Forestry & Environmental Studies, Yale University, 06511 New
Haven, CT, USA
of the carbon sequestration and carbon stocks occur-ring in forests, and its quantification in forest inventories becomes even more relevant due to forests’ interactions with the greenhouse effect and climate change (Smith et al.2004). As such, the assessment of dead woody debris comprises an essential component of efficient forest man-agement. Moreover, quantifying carbon stocks improves our understanding of climate change and the role of for-est carbon dynamics in various future scenarios, and a more accurate quantification of dead woody material only increases the accuracy of overarching carbon estimates (Woodall and Williams2005).
Despite this importance, carbon stock data for dead wood and litter remain vague (FAO 2010). The woody debris studies that do exist focus on volume and biomass inventories, eschewing calculations for actual carbon concentrations (Russell et al. 2015). Instead, carbon stocks are indirectly estimated through volume estima-tors and biomass-carbon conversion constants (Woodall and Monleon2008). Because vegetation sequesters atmo-spheric carbon in biomass, which is commonly expressed as a dry weight per unit area, changes in net primary productivity values over time often indicate changes in forest structure (Brown1997). Biomass values are usually converted to carbon values by multiplying by the con-stant 0.50 (i.e., computed as 50% of the biomass value). The IPCC (2006) recommends the use of a 47% biomass-carbon conversion factor for tropical rainforests when there is a dearth of data specific to this forest type.
Estimates of the carbon in dead woody debris could be improved by better understanding how carbon concen-tration varies in woody detritus, and necromass estimates can become more precise when estimating wood den-sity by decay class, species, position with respect to the soil surface, and tissue type (Harmon et al.2013). Carbon stocks can only be estimated precisely and in large-scale if there are detailed forest-type specifications for carbon concentration values (IPCC2006).
Coarse woody debris (CWD), one of many forms of dead woody debris, is generally defined as fallen dead wood, in various stages of decomposition, located above the soil. Studies of carbon concentration in the CWD of tropical forests by Chao et al. (2017) note four previ-ous publications pertinent to this type of research (Clark et al. 2002; Iwashita et al. 2013; Meriem et al. 2016; Wilcke et al.2005). No studies were found for the Cer-rado ecosystem of Brazil, however. With the objective of increasing knowledge on biomass and carbon stocks, and thus improving the accuracy of published estimates, the present study explored wood density and carbon concen-tration of coarse woody debris by decay class in a Seasonal Semi-deciduous Forest area in the Atlantic Rain Forest and in a Cerradosensu-stricto(Brazilian savannah) area.
Methods Study sites
This study was conducted at two different areas located in separate ecoregions of the São Paulo State, Brazil. The first area was within the Brazilian Atlantic Forest in a Seasonal Semi-deciduous Forest (SSF), also known as tropical seasonal forest, located inside the borders of the Caetetus Ecological Station. The second area was within the Cerrado ecoregion in an area classified as Cerrado sensu-stricto(CSS) located on the Mogi Guaçu Biological Reserve. In each area two strata were chosen for stratified systematic sampling.
The forest at the Caetetus Ecological Station consti-tutes one of the most significant remaining areas of SSF in Brazil. The “semi-deciduous” denomination refers to the seasonal cold weather and the reduced water availability in the soil, alongside other environmental factors. As such, most of the arborescent species lose their leaves in winter to reduce water consumption and decrease their rates of growth (Tabanez et al.2005). According to the Manage-ment Plan, the Conservation Unit covers the cities of Galia and Alvinlândia with a total area of 2178 ha. Its elevation ranges from 520-680 m above sea level, and it is relatively flat (less than 6%). It is located on the northern border area of the hydrographic basin of the Paranapanema river. The climate according to the Köeppen (1948) classification is “Cwa”: mesothermal dry winter with temperatures below 18◦C and above 22◦C in summer; total precipitation in the driest month is only 30 mm, and total annual precipi-tation is between 1100 and 1700 mm (Tabanez et al.2005). In this area, stratum I (SSF1) and stratum II (SSF2) were selected.
The SSF1 stratum was characterized by arboreal vegeta-tion of large stature with sparse herbaceous and graminoid vegetation. SSF1 contained predominantly deciduous species and has experienced anthropogenic disturbance; it occupies the interfluves and the tops of plateaus with a total area of 777.8 ha (area “L" in the Management Plan map). The SSF2 stratum was an area containing dense arboreal vegetation of large stature with a smaller number of deciduous species. Overall, SSF2 was a well-preserved forest occupying high escarpments and plateau edges across a total area of 439.4 ha (area “M" in the Management Plan map) (Tabanez et al.2005).
The Mogi-Guaçu Biological Reserve, the location of the cerrado field site, is part of the old Campininha Farm located in the Martin Prado Junior district of the city of Mogi Guaçu in the São Paulo State. With a total area of 470 hectares, the landscape is relatively flat (less than a 15% slope). In the area of the Campininha Farm, the ele-vation ranges from 566 to 724 meters above sea level. The climate is mesothermal with two well defined seasons: a dry winter (from the months of April to September) and a hot summer (from October to March). The annual aver-age rainfall is 1335 mm, and the averaver-age temperature is 20.5◦C (São Paulo 2015). The unit is divided into two main sections: one designated as area “A” and the other as area “B”.
vegetation near the watercourse. Two strata were also selected in this area: CSS1 and CSS2. The CSS1 stratum is characterized as a forested savannah in an advanced suc-cessional stage with an area of 136.5 ha; and the CSS2 stra-tum is a forested savannah in an intermediate successional stage with an area of 197.5 ha (São Paulo2015).
Field measurements and sample collection
In the field survey, dead woody debris was classified into size classes according to the Keller et al. (2004) classifica-tion: small (branches or bamboo with diameter between 2 and 5 cm); medium (branches or bamboo with diame-ter between 5 and 10 cm); and large (woody madiame-terial with diameter greater than 10 cm). In this study, only the large elements were measured. Data were collected according to the line intersect sampling (LIS) method, in which an element of downed dead wood was tallied if it was com-pletely intersected by a transect or if it intersected the front end of a transect, following the protocol detailed by Gregoire and Valentine (2008). A professional compass (Suunto KB-20) was used to alignment the transects along the cardinal directions. A 50 m tape measure was used to lay out the transects, with corrections for slope when nec-essary. Additional details about the field protocols can be found in Moreira (2017) and Moreira et al. (2019).
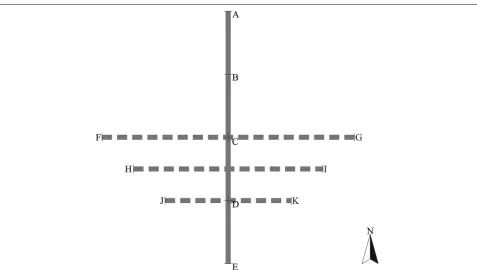
In each stratum of each area, ten sampling units (Fig.1) were installed according to a systematic sampling pro-tocol, with 300 m distance between the center points of each sampling unit (point C - Fig.1). Each sampling unit spans 650 m of transect segments: one 200 m transect seg-ment in the North-South direction (segseg-ment AE - Fig.1); one 200 m transect segment in the East-West direction, crossing the center point of the N-S transect (segment FG - Fig. 1); a 150 m segment crossing the N-S segment in the East-West direction at 25 m south of the center point (segment HI - Fig. 1); and a 100 m East-West segment crossing the N-S segment at 50 m south of the center point (segment JK - Fig.1).
A caliper was used to measure each element’s diame-ter, perpendicular to the central axis, at the point where the segment intersected the element. If bark remained attached to the element, the diameter was measured with it. The length of the element was recorded using a tape measure along the central axis of the element (regardless of its shape). Furthermore, each element’s width perpen-dicular to the transect segment direction was measured according to Gregoire and Valentine (2008). Each element was classified into one of five decay classes according to Harmon et al. (1986). Decay class 1: woody material consisting of solid wood with leaves and/or fine twigs attached to the principal part without noticeable degrada-tion; decay class 2: solid wood material with intact bark but no leaves or fine twigs; decay class 3: solid wood material similar to class 2 except with rotting bark; decay
class 4: partially rotten material that can be broken when kicked; and decay class 5: material that is rotten, friable, and can be broken with bare hands.
Though species identification for debris material is diffi-cult, this data was collected for CWD elements whenever possible – most frequently when the presence of bark and attached branches exhibited particular characteristics of certain species (e.g., a specific odor). For each element, a disc sample was collected at the transect intersection point, perpendicular to the central axis. These samples were taken using either a chain saw or a manual saw (for elements that had a high degree of decomposition). Sam-ples were packaged, tagged, and carefully transported to the laboratory.
Laboratory analysis
For density calculations from disc samples, the cylinder extraction method proposed by Keller et al. (2004) was used, with the only variation in this study being that the cylinders were removed in a laboratory setting. The extraction of the cylinders was performed using a bench-mounted drill with a hole saw that produced samples of known diameter. For elements with a high level of decay, sample cylinders were removed manually using an alu-minum cylinder. The length of the cylinders was measured and confirmed with a digital caliper; although the hole saw (drill bit) had a known volume, the length of the sam-ple cylinders it produced varied according to the width of the disc brought from the field. The sample cylinders were oven-dried at 65◦C to a constant weight. Dry cylinders were removed from the oven and weighed to four decimal places on an analytical scale to compute final dry weight.
The sample cylinders from each disc were milled in a knife mill (Wileytype), and sieved through a no. 40 mesh, with equipment being vacuum-cleaned between samples to avoid contamination. Carbon concentration measure-ments were achieved withLECO-C632carbon combus-tion and analysis equipment; i.e., samples are placed in a ceramic chamber that reaches a temperature of approx-imately 1000◦C for about one minute, undergoing com-bustion in the presence of oxygen. The LECO system uses infrared sensors to detect elemental carbon in the out-flow of gas from the combustion system, and results are delivered as percentage mass values. For each sample, two replicates were made to determine final carbon concen-trations. All laboratory analyses were performed in the Department of Forest Sciences at the University of São Paulo (ESALQ/USP).
Data analysis
The data from the sampling units (650 m of transect seg-ments) were used to calculate wood density and carbon concentration. The wood density (ρk) of eachkthelement
Fig. 1Sampling unit with a transect in the North-South direction (continuous line, 200 m), and three transects in the East-West direction (dashed lines)
densities, calculated as the dry weight (g) divided by fresh volume (cm3); average densities were computed for each decay class. For the volume calculation, discs with hollow sections were photographed, and the hollow areas were measured usingImageJ(Rasband2016). Thus, the volume for each element (vk) was calculated as: the cross-sectional
area of thekthelement minus the hollowed cross-sectional area of the kth element then multiplied by the length of thekthelement.
The biomass (bk) value for eachkthelement was
deter-mined as the product of the element’s volume and its density:bk = Vk.ρk. The carbon stock in each kth ele-ment was calculated as the product of its biomass and the carbon concentration average computed via the lab-oratory analysis by LECO-C632 equipment then aver-aged according to decay class. From the SSF area, n = 506 elements were analyzed for density d carbon
con-centration; from the CSS area, n = 182 elements
were analyzed.
From the sampling unit scheme, Moreira et al. (2019) tested different configurations and segments length, selecting the design based on the estimates with the small-est standard error, narrowsmall-est confidence interval, and lowest relative error. The cross-shaped with 150 m seg-ment length (segseg-ments BE and HI - Fig.1) was selected for CSS type, and cross-shaped with 200 m segment length (segments AE and FG - Fig.1) for SSF.
The total estimation of biomass/carbon stock per hectare by sampling units
ˆ λyπs
was calculated using the
estimatorλˆc yπs =
Uk∈s yk
wk(θs)L
, whereLis the length
of both segments that makes the cross shaped design,yk
is the parameter of interest (biomass or carbon stock), andwk is the perpendicular width to the transect
direc-tion, (θs). The estimation for each unit was replicated,
and all estimates were combined for the whole popula-tion. See details about the estimators in Moreira (2017), Moreira et al. (2019), as well as Gregoire and Valentine (2008). All data were processed and analyzed using R (R Core Team2018).
Results
For both areas, as the decay class increases (from freshest to most decomposed material), wood
den-sity decreases. Table 1 shows the woody density
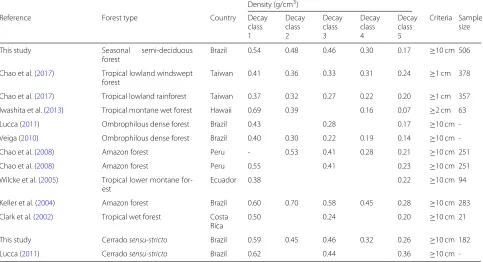
by decay class results by stratum, as well as com-bined for each of the two study areas. Table 2 com-pares density values with other tropical forest and Cerrado studies.
Table 1Average wood density (g/cm3), by decay class, of coarse woody debris in the strata of the two study areas, the Seasonal Semi-deciduous Forest (SSF) and the Cerradosensu-stricto(CSS)
Decay Wood density (g/cm3)
class n1 SSF1 n2 SSF2 n SSF Overall
1 3 0.48 (0.22) 10 0.55 (0.13) 13 0.54 (0.15)
2 14 0.45 (0.13) 19 0.50 (0.12) 33 0.48 (0.12)
3 130 0.46 (0.15) 174 0.46 (0.17) 304 0.46 (0.16)
4 61 0.32 (0.16) 63 0.28 (0.13) 124 0.30 (0.15)
5 17 0.19 (0.15) 15 0.15 (0.07) 32 0.17 (0.12)
CSS1 CSS2 CSS Overall
1 1 0.69 (0.00) 1 0.49 (0.00) 2 0.59 (0.14)
2 12 0.44 (0.12) 6 0.46 (0.10) 18 0.45 (0.11)
3 71 0.46 (0.16) 38 0.45 (0.19) 109 0.46 (0.17)
4 28 0.32 (0.16) 18 0.33 (0.17) 46 0.32 (0.17)
5 4 0.25 (0.24) 3 0.26 (0.05) 7 0.26 (0.17)
The table shows the average wood density values with the calculated standard deviations in parentheses (withnbeing the sample sizes)
49.6% with a standard deviation of 2.6, with a range of 31.2–54.5% over 182 observations. Table 3 shows the carbon concentration by decay class found in both strata of both areas of the present study, and Table 4
compares these results with other studies in tropical forests.
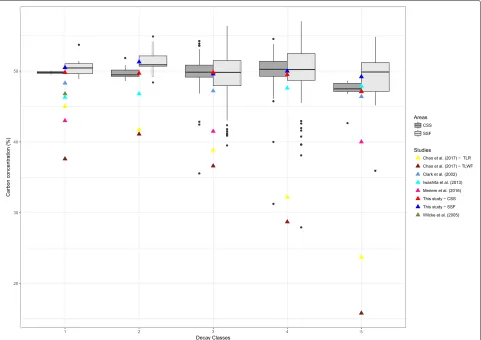
Figure2is a box plot with SSF and CSS data, with the average values from the studies mentioned in Table 4. No study was found to have investigated carbon concen-tration of dead woody debris in a Cerrado sensu-stricto ecosystem. Table5shows wood density and carbon con-centration values by species and by decay class (but only when the species in the determined class was sampled five or more times).
Biomass per unit of area was estimated at 6.7 with a standard error of 0.83 Mg/ha (n=319), and 1.3 with a stan-dard error of 0.25 Mg/ha (n=92) for the SSF and the CSS areas, respectively. Carbon stock were 3.3 with a stan-dard error of 0.42 MgC/ha, and 0.7 with a stanstan-dard error of, 0.12 MgC/ha for the SSF and the CSS, respectively. With a conversion constant of 50%, similar results of car-bon stock were obtained: 3.33 with a standard error of 0.41 MgC/ha for the SSF, and 0.67 with a standard error of 0.12 MgC/ha for the CSS.
Discussion
Our results for wood density follow the general pat-tern observed in previous studies in which wood den-sity decreases as decay class increases (i.e., the woody debris becomes more decomposed). Only Keller et al. (2004) shows an exception to this trend: class 2 exhib-ited a larger value than class 1; however, the authors did not propose an explanation for this observation. In decay class 5, the SSF exhibited lower densities compared to
Table 2Wood density (g/cm3) of woody debris found in the literature for Tropical Forests and Cerrado ecosystems
Density (g/cm3)
Reference Forest type Country Decay
class 1
Decay class 2
Decay class 3
Decay class 4
Decay class 5
Criteria Sample size
This study Seasonal semi-deciduous
forest
Brazil 0.54 0.48 0.46 0.30 0.17 ≥10 cm 506
Chao et al. (2017) Tropical lowland windswept forest
Taiwan 0.41 0.36 0.33 0.31 0.24 ≥1 cm 378
Chao et al. (2017) Tropical lowland rainforest Taiwan 0.37 0.32 0.27 0.22 0.20 ≥1 cm 357
Iwashita et al. (2013) Tropical montane wet forest Hawaii 0.69 0.39 0.16 0.07 ≥2 cm 63
Lucca (2011) Ombrophilous dense forest Brazil 0.43 0.28 0.17 ≥10 cm
-Veiga (2010) Ombrophilous dense forest Brazil 0.40 0.30 0.22 0.19 0.14 ≥10 cm
-Chao et al. (2008) Amazon forest Peru - 0.53 0.41 0.28 0.21 ≥10 cm 251
Chao et al. (2008) Amazon forest Peru 0.55 0.41 0.23 ≥10 cm 251
Wilcke et al. (2005) Tropical lower montane for-est
Ecuador 0.38 0.22 ≥10 cm 94
Keller et al. (2004) Amazon forest Brazil 0.60 0.70 0.58 0.45 0.28 ≥10 cm 283
Clark et al. (2002) Tropical wet forest Costa Rica
0.50 0.24 0.20 ≥10 cm 21
This study Cerradosensu-stricto Brazil 0.59 0.45 0.46 0.32 0.26 ≥10 cm 182
-Table 3Average carbon concentration (%), by decay class, of coarse woody debris in the strata of the two study areas, the Seasonal Semi-deciduous Forest (SSF) and the Cerrado sensu-stricto(CSS)
Decay Carbon concentration (%)
class n1 SSF1 n2 SSF2 n SSF Overall
1 3 50.7 (0.36) 10 50.4 (1.46) 13 50.5 (1.27)
2 14 51.2 (1.46) 19 51.4 (1.42) 33 51.3 (1.42)
3 130 49.3 (3.20) 174 49.8 (2.92) 304 49.6 (3.05)
4 61 50.4 (3.64) 63 49.6 (4.42) 124 50.0 (4.06)
5 17 48.8 (4.02) 15 49.7 (3.04) 32 49.3 (3.56)
CSS1 CSS2 CSS Overall
1 1 50.0 (0.00) 1 49.5 (0.00) 2 49.8 (0.35)
2 12 49.8 (0.81) 6 49.5 (0.80) 18 49.7 (0.80)
3 71 50.1 (1.46) 38 49.4 (3.13) 109 49.8 (2.19)
4 28 49.0 (4.40) 18 50.4 (2.01) 46 49.5 (3.68)
5 4 46.1 (2.32) 3 48.4 (0.35) 7 47.1 (2.06)
The table shows carbon concentration averages and the calculated standard deviations in parentheses (withnbeing the sample sizes)
the CSS, which matched the results from Lucca (2011) in an Ombrophilous Dense Forest (0.17 g/cm3). The SSF value was also similar to density values from other stud-ies such as Chao et al. (2017); Chao et al. (2008); Wilcke et al. (2005), and Clark et al. (2002). In terms of the present study, the two were similar except for decay class 5 where the CSS had 0.26±0.17 g/cm3and the SSF had 0.17±0.12 g/cm3. Iwashita et al. (2013) was the only study that showed a very low value for decay class 5 (0.07 g/cm3) compared to the other studies.
As in the current study, most studies classify CWD into five decay classes based on physical properties. Table 2
shows that some studies divide decay status into three or four classes, making the comparison more difficult.
Our study produced results similar to those of Chao et al. (2008) who investigated CWD (≥10 cm) in the Peruvian Amazon. They first divided elements into five decay classes, but they did not show data for decay class 1, because there was only one sample, as happened with both strata in the CSS area. However, Chao et al. (2008) combined decay classes 1 and 2, and also 4 and 5, to form a system with three classes. That studies produced results similar to our decay classes 1, 3 and 5. Comparing our results from the CSS with Lucca (2011), the values are sim-ilar for decay classes 1 and 3, but Lucca’s are higher for decay class 5.
The range of wood density in our data and other stud-ies highlights the importance of measuring wood density to achieve better accuracy for estimates of CWD biomass (Chao et al.2017; Harmon et al.2008; Harmon et al.2013). In the field, we were able to identify 38 different species in the SSF area and 18 in the CSS. The species was most eas-ily identified in decay classes 1 and 2, whereas the species could be identified on only about 50% of the samples in decay class 4 and 5. If we restrict the list to those with more than five observation, then there only 11 species from SSF and 5 from CSS from Table 5. Of those, only five species have density estimates from more than one decay class. The densities generally decline with increasing decay class, but the patterns vary, as also observed by Harmon et al. (2008) who speculated that the patterns were influenced by many environmental conditions.
Though species identification for CWD is very dif-ficult, if measurements on woody debris for specific species are available this data might help better under-stand variance patterns (Chao et al. 2017). Table 5
demonstrates how few opportunities there are to exam-ine species-level trends across decay class in CWD sam-ples collected in tropical, mixed-species forests. This is
Table 4Carbon concentration (%) of woody debris found in the forestry literature for Tropical Forests and Cerrado ecosystems
Carbon concentration (%)
Reference Forest type Country Decay
class 1
Decay class 2
Decay class 3
Decay class 4
Decay class 5
Criteria Sample size
This study Seasonal semi-deciduous forest Brazil 50.5 51.3 49.6 50.0 49.2 ≥10 cm 506
Chao et al. (2017) Tropical lowland windswept for-est
Taiwan 37.6 41.1 36.6 28.7 15.8 ≥1 cm 95
Chao et al. (2017) Tropical lowland rainforest Taiwan 45.0 41.7 38.8 32.2 23.7 ≥1 cm 95
Meriem et al. (2016) Tropical lowland rainforest Indonesia 43.0 41.5 40.0 ≥10 cm 261
Iwashita et al. (2013) Tropical montane wet forest Hawaii 46.3 46.8 47.6 47.9 ≥2 cm 48
Wilcke et al. (2005) Tropical lower montane forest Ecuador 46.8 47.2 ≥10 cm 16
Clark et al. (2002) Tropical wet forest Costa
Rica
48.3 47.2 46.4 ≥10 cm 21
Fig. 2Box plot from the data collected in the seasonal semi-deciduous forest (SSF) and in the Cerradosensu-stricto(CSS); where the triangles are the averages from reference studies (Table4)
particularly true when the focus of the study is estimating biomass and carbon and not specifically the den-sity pattern by decay class. A study focused on the pattern likely restrict the scope to a small num-ber of species that are well represented in a several decay classes.
In the few studies reporting carbon concentration (Table 4 and Fig. 2) for tropical forests there are few contradictory results. The present study’s results par-allel Iwashita et al. (2013); Meriem et al. (2016), and Wilcke et al. (2005) where the carbon concentration barely changes within the decay classes. Clark et al. (2002) showed a small decrease in carbon concentration with an increase in decay class, and Chao et al. (2017) found in both areas that the carbon concentration decreases notably with the decay class.
Chao et al. (2017) and Clark et al. (2002) found that the variance of carbon concentration increases with decay classes; i.e., the higher the class, the higher the vari-ability. Our results showed that the variance of carbon concentration increased until decay class 4, and then
started to decreased. Chao et al. (2017) hypothesized that the fraction of fixed carbon is unlikely to be main-tained in tropical forests with high biodiversity because of the many decomposition trajectories involving woody debris substrate quality, the myriad of microorganism activities, and the climatic conditions. Harmon et al. (1986) concludes decomposition is summarized in two major processes: physical/biological fragmentation of the material and mineralization (i.e., soil leaching and respiration).
Table 5Wood density (g/cm3) and carbon concentration (%) averages of coarse woody debris by species and decay class for the Cerradosensu-sctricto(CSS) and Seasonal Semi-deciduous Forest (SSF) areas, with sample sizen≥5, standard deviation in the parenthesis
Area Specie Decay class n Density (g/cm3) Carbon concentration (%)
CSS Anadenanthera falcataSpeg. 3 11 0.60 (0.14) 52.4 (1.36)
Copaifera langsdorffiiDesf. 3 5 0.48 (0.08) 49.5 (0.68)
Qualeasp. 3 24 0.47 (0.21) 49.0 (3.75)
Tapirira guianensisAubl. 2 8 0.39 (0.05) 49.2 (0.30)
Tapirira guianensisAubl. 3 20 0.40 (0.15) 49.0 (1.15)
Tapirira guianensisAubl. 4 7 0.35 (0.11) 49.0 (1.31)
Vochysia tucanorumMart. 3 7 0.40 (0.06) 49.8 (0.68)
SSF Aspidosperma polyneuronMüll.Arg. 3 28 0.55 (0.09) 50.1 (3.17)
Centrolobium tomentosumGuill. ex Benth. 3 7 0.58 (0.14) 50.8 (2.62)
Croton floribundusSpreng. 2 5 0.35 (0.08) 51.6 (1.87)
Croton floribundusSpreng. 3 20 0.35 (0.07) 50.0 (2.48)
Croton floribundusSpreng. 4 6 0.23 (0.03) 50.2 (0.89)
Croton floribundusSpreng. 5 6 0.22 (0.14) 49.6 (2.32)
Esenbeckia leiocarpaEngl. 3 5 0.64 (0.10) 49.1 (2.44)
Inga striataBenth. 3 10 0.26 (0.10) 49.8 (2.26)
Machaerium brasilienseVogel 3 5 0.47 (0.06) 47.8 (2.19)
Ocoteasp. 2 7 0.47 (0.11) 51.3 (2.25)
Ocoteasp. 3 68 0.53 (0.17) 50.0 (3.05)
Ocoteasp. 4 25 0.36 (0.15) 50.3 (4.42)
Ocoteasp. 5 6 0.22 (0.22) 50.5 (7.24)
Piptadenia gonoacantha(Mart.) J.F.Macbr. 3 19 0.35 (0.11) 48.9 (3.61)
Piptadenia gonoacantha(Mart.) J.F.Macbr. 4 12 0.22 (0.10) 52.0 (3.34)
Piptocarpha sellowii(Sch. Bip.) Baker 3 5 0.34 (0.05) 48.3 (1.98)
Savia dictyocarpaMüll.Arg. 3 10 0.38 (0.12) 47.8 (2.47)
Savia dictyocarpaMüll.Arg. 4 5 0.43 (0.21) 47.8 (0.99)
Senegalia polyphylla(DC.) Britton & Rose 3 5 0.43 (0.08) 50.4 (2.88)
would be in the range of 4-7% (Harmon et al.2008) but could be as high as 50% when using external estimates such as models. Those biomass errors, of course, would lead directly to carbon errors of similar magnitude.
In contrast, Chao et al. (2017) showed that they had overestimated carbon stock values by 17-36% when using the constant of 50%. They strongly recommended the evaluation of carbon concentration for CWD at the site-level, especially for tropical forests. Chao et al. (2017) did note that their results diverged from those obtained in other studies and recommend further investigations, suggesting that some underlying mechanisms may have been different. This divergence of trends both in the behavior of wood density in some species and in the variance of carbon concentration might be related not only to species, but also to different vegetation type, different environmental factors, such as temperature,
rainfall, moisture, ground mineralization conditions, fire frequency, fungal and insect activity, and other factors, but unfortunately we cannot address those issues with our data.
Conclusions
interpretation to facilitate comparisons between studies. Until we have more confidence about applying published values of density, it seems prudent to recommend that subsampling for wood density by decay class become a standard component of CWD inventories, especially in complex mixed-species forests. The density estimates are so important, the patterns by decay class are so vari-able and the species identification of dead material is so often problematic that subsampling for density is worth the additional cost and effort.
Very few studies were found that measured the car-bon concentration of coarse woody debris, as most use the common conversion factor of 50%. The carbon con-centrations reported in this study are not meaning-fully different from the conventional conversion factor of 50% in any of our decay classes, but there are a few studies that contradict these findings. We recom-mend, therefore, that there should be more studies of carbon concentration in decay classes to explore those differences.
Abbreviations
CSS: Cerradosensu stricto; CWD: Coarse woody debris; LIS: Line intersect sampling; SSF: Seasonal semi-deciduous forest
Acknowledgments
The authors would like to thank São Paulo Research Foundation (FAPESP) for the financial support given to this project.
Funding
This study was funded by the São Paulo Research Foundation (FAPESP) through a doctorate scholarship (Grant no. 2013/10922-2) and a Research Internship Abroad (Grant no. 2014/14213-9).
Availability of data and materials
The data cannot be shared at the moment of this manuscript’s publication because the authors are still working on supplementary analyses to be published at a later date.
Use of plants
This research involves working with plants through the collection of coarse dead woody debris samples from two remnant areas of the Brazilian Atlantic Forest and Brazilian Savanna, both of which are administered by the government of the State of São Paulo. All local, national and international guidelines and laws have been followed, including the acquisition of appropriate required permissions for the fieldwork.
Authors’ contributions
ABM, TGG and HTZC conceived and designed the field and laboratory protocol; ABM performed the field work and laboratory analysis; ABM analyzed the data; TGG and HTZC contributed to the analysis; and ABM wrote the paper. All co-authors assisted the lead author in writing and revising the manuscript. Finally, all authors read and approved the final manuscript.
Ethics approval and consent to participate
Not applicable.
Consent for publication
All authors consent to the publication of this manuscript.
Competing interests
The authors declare that they have no competing interests.
Received: 16 October 2018 Accepted: 8 March 2019
References
Brown S (1997) Estimating biomass and biomass change of tropical forests: a primer. FAO, Rome, Italy. FAO Forestry Paper n. 134
Chao KJ, Phillips OL, Baker TR (2008) Wood density and stocks of coarse woody debris in a northwestern amazonian landscape. Can J For Res 38:795–805 Chao KJ, Chen YS, Song GZM, Chang YM, Sheue CR, Phillips OL, Hsieh C-F
(2017) Carbon concentration declines with decay class in tropical forest woody debris. Forest Ecol Manag 391:75–85
Clark DB, Clark DA, Brown S, Oberbauer SF, Veldkamp E (2002) Stocks and flows of coarse woody debris across a tropical rain forest nutrient and topography gradient. For Ecol Manag 164:237–48
FAO (2010) Food Agriculture Organization of the United Nations. Global Forest Resource Assessment 2010, Rome
Gregoire TG, Valentine HT (2008) Sampling Strategies for Natural Resources and the Environment. Chapman & Hall/CRC, Applied Environmental Statistics, Boca Raton
Harmon ME, Franklin JF, Swanson FJ, Sollins P, Gregory SV, Lattin JD, Anderson NH, Cline SP, Aumen NG, Sedell JR, Lienkaemper GW, Cromack JR, Cummins KW (1986) Ecology of coarse woody debris in temperate ecosystems. Adv Ecol Res 15:133–302
Harmon ME, Woodall CW, Fasth B, Sexton J (2008) Woody detritus density and density reduction factors for tree species in the united states: a synthesis. U.S. Department of Agriculture, Forest Service, Northern Research Station, Newtown Square, PA. Gen. Tech. Rep. NRS-29
Harmon ME, Fasth B, Woodall CW, Sexton J (2013) Carbon concentration of standing and downed woody detritus: Effects of tree taxa, decay class, position, and tissue type. Forest Ecol Manag 291:259–67
IPCC (2006) Intergovernmental Panel on Climate Change. 2006 IPCC Guidelines for National Greenhouse Gas Inventories vol. 4: Agriculture, forestry and other land use. IPCC, Japan
Iwashita DK, Litton CM, Giardina CP (2013) Coarse woody debris carbon storage across a mean annual temperature gradient in tropical montane wet forest. Forest Ecol Manag 291:336–43
Keller M, Palace M, Asnerz GP, Pereira RJR, Silva JNM (2004) Coarse woody debris in undisturbed and logged forests in the eastern brazilian amazon. Global Change Biol 10:784–95
Köeppen W (1948) Climatologia: Com Um Estúdio de Los Climas de la Tierra. Fundo de Cultura Economica, Mexico
Lucca FS (2011) Estoques de necromassa em um cerrado sensu stricto e uma floresta ombrófila densa montana, no estado de São Paulo. Dissertação de mestrado, Instituto de Botânica da Secretaria de Estado do Meio Ambiente Mantovani W, Martins FR (1993) Florística do cerrado na reserva biolôgica de
moji guaçu, sp. Acta Bot Bras 7(1):33–60
Meriem S, Tjitrosoedirjo S, Kotowska MM, Hertel D, Triadiati T (2016) Carbon and nitrogen stocks in dead wood of tropical lowland forests as dependent on wood decay stages and land-use intensity. Ann For Res 59(2):299–310 Moreira AB (2017) Estimation of volume, biomass, and carbon of coarse woody
debris in native forests in São Paulo state, Brazil. Thesis (doctorate in science), Universidade de São Paulo, Piracicaba
Moreira AB, Gregoire TG, Couto HTZ (2019) Estimation of the volume, biomass, and carbon content of coarse woody debris within two forest types in the state of São Paulo, Brazil. Forestry. (in press)
R Core Team (2018) R Foundation for Statistical Computing. R: A Language and Environment for Statistical Computing. R Core Team, Vienna, Austria.
https://www.R-project.org. Accessed 12 Dec 2016
Rasband (2016) W.S.: U. S. National Institutes of Health. ImageJ - Image Processing and Analysis in Java. Rasband, Bethesda, Maryland, USA.http:// imagej.nih.gov/ij/. Accessed 20 Feb 2016
Russell MB, Fraver S, Aakala T, Gove JH, Woodall CW, D’Amato AW, Ducey MJ (2015) Quantifying carbon stores and decomposition in dead wood: a review. Forest Ecol Manag 350:107–28
São, Paulo (2015) Governo do Estado São Paulo. Instituto de Botânica e Instituto Florestal. Secretaria do Meio Ambiente do Estado de São Paulo. Plano de Manejo Integrado Das Unidades de Conservação de Mogi Guaçu: Reserva Biológica e Estação Ecológica. Secretaria do Meio Ambiente do Estado de São Paulo. http://jardimbotanico.sp.gov.br/2016/02/plano-de-manejo-da-reserva-biologica-de-mogi-guacu-2/. Accessed 07 Mar 2016 Smith WB, Miles PD, Vissage JS, Pugh SA (2004) Forest Resources of the United
Tabanez MF, Durigan G, Keuroghlian A, Barbosa AF, Freitas CA, Silva CEF, Silva DA, Eaton DP, Brisolla G, Faria HH, Mattos IFA, Lobo MT, Barbosa MR, Rossi M, Souza MG, Machado RB, Pfeifer RM, Ramos VS, Andrade WJ, Contieri WA (2005) Plano de manejo da estação ecológica dos caetetus. Instituto Florestal. Série Registros No. 29
Veiga LG (2010) Estoque de Madeira Morta ao Longo de um Gradiente Altitudinal de Mata Atlântica no Nordeste do Estado de São Paulo, Dissertação (mestrado em biologia vegetal). Universidade Estadual de Campinas, Campinas
Wilcke W, Hess T, Bengel C, Homeier J, Valarezo C, Zech W (2005) Coarse woody debris in a montane forest in Ecuador: mass, c and nutrient stock, and turnover. Forest Ecol Manag 205:139–47
Woodall CW, Monleon (2008) Sampling protocol, estimation, and analysis procedures for the down woody materials indicator of the fia program. U.S. Department of Agriculture, Forest Service, Northern Research Station, Newtown Square, PA. Gen. Tech. Rep. NRS-22
Woodall CW, Williams MS (2005) Sampling, estimation, and analysis