Transcriptome analysis of the ark shell
Scapharca
1subcrenata
: De novo assembly, identification of genes
2
and pathways involved in growth
3
Qingzhi Wang1,2,*, Weiming Teng2, Xiujun Sun3, Miao Liang4, Shangkun Du5, Zunchun Zhou2, Xi Xie2
4
and Qi Li1,*
5
6
1. Key Laboratory of Mariculture, Ministry of Education, Ocean University of China, Qingdao 266003, 7
China; 8
2. Liaoning Ocean and Fisheries Science Research Institute, Dalian 116023, China; 9
[email protected] (W.T.); [email protected] (Z.Z.); [email protected] (X.X.) 10
3. Yellow Sea Fisheries Research Institute, Chinese Academy of Fishery Sciences, Qingdao, 266071, China; 11
[email protected] (X.S.) 12
4. National Marine Environmental Monitoring Center, Dalian 116023, China; [email protected] 13
(M.L.) 14
5. Jinzhou Ocean and Fisheries Science Research Institute, Jinzhou, 121007, China; [email protected] 15
(S.D.) 16
* Correspondence: [email protected], Tel./Fax: +86-411-8469-1600; [email protected]; Tel./Fax: 17
+86-532-8203-1622; 18
Abstract
19
To understand the molecular mechanism associated with growth variability in bivalves, the 20
Solexa/Illumina technology was employed to analyze the transcriptomic profiles of extreme 21
growth rate differences (fast- VS. slow-growing individuals) in one full-sib family of the ark 22
shell Scapharca subcrenata. De novo assembly of S. subcrenata transcriptome yielded 23
276,082,016 raw reads, which were assembled into 98,502 unique transcripts by Trinity 24
strategy. A total of 6,357 differentially expressed genes (DEGs) were obtained between fast- 25
and slow-growing individuals, with 580 up-regulated expression and 5777 down-regulated 26
expression. Functional annotation revealed that the largest proportion of DEGs were 27
classified to the large or small subunit ribosomal protein, all of which showed significantly 28
lower expression levels in fast-growing group than those in slow-growing group. GO 29
enrichment analysis identified the maximum of DEGs to biological process, followed by 30
molecular function and cellular component. Most of the top enriched KEGG pathways were 31
related to energy metabolism, protein synthesis and degradation. These findings reveal the 32
link between gene expression and contrasting phenotypes in ark shells, which support that 33
fast-growing individuals may be resulted from decreased energy requirements for metabolism 34
maintenance, accompanying with greater efficiency of protein synthesis and degradation in 35
bivalves. 36
Key words: ark shell; transcriptome; growth; metabolism; differentially expressed genes 37
1. Introduction
38
Growth is considered as a trait of great economic importance for cultured animals, which 39
has a major influence on the profitability of food animal production. In aquatic markets, 40
larger animals usually attain a higher price per unit of weight compared to smaller ones [1]. 41
Thus, as for bivalve molluscs, growth is a highly desired trait in shellfish culture industry, and 42
successful selection for fast growth is a key objective in aquaculture breeding programs. As 43
reported, the growth trait of bivalves is indeterminate and has great variability, which is 44
consistent with the different growth rate among different individuals under identical 45
environmental conditions [2-7]. Understanding the basis of underlying growth variability in 46
bivalves is essential for the selective breeding of commercial species and improvement of 47
bivalve production. 48
For bivalves, the inter-individual growth variability are highly complex processes that are 49
regulated by both endogenous biological and exogenous environmental factors, called as 50
“Nature and Nurture” [8]. To date, extensive studies have been carried out to investigate the 51
effects of environmental factors (i.e., temperature, salinity and food) on growth rates of 52
bivalves [9-11]. However, the relatively less attention has been paid to endogenous biological 53
factors regulating their growth variability when they are exposed to identical controlled 54
conditions. Previous studies about bivalve molluscs indicate that physiological differences 55
are responsible for growth variability between fast and slow growers, and confirmed the 56
existence of an endogenous physiological component for growth differentiation [12-17]. 57
Recent years, molecular genetics have been used to identify a number of candidate genes and 58
markers associated with growth traits in bivalves [18-20]. Moreover, the in-depth analyses of 59
the transcriptome of Pacific oyster Crassostrea gigas have identified the ribosomal proteins, 60
which demonstrates that the efficiency of protein metabolism plays an important role in 61
growth heterosis [21]. Despite this, scant progress has been made on the molecular basis 62
The ark shell Scapharca subcrenata is a commercially important bivalve species in Asian 64
countries, such as China, Japan and Korea. Recently, natural resource of the ark shells has 65
been declining dramatically, mainly due to the high demands in markets and their 66
over-exploitation in the shallow coasts [22-23]. As one of the important maricultural bivalve 67
species, due to the lack of genetic and genomic information, the molecular mechanisms 68
involved in their growth regulation are poorly understood. Recent advances in 69
next-generation sequencing technologies allow for rapid generation of extensive genomic 70
resources at affordable cost to perform omics level studies in bivalve molluscs [24-26]. To 71
better understand the molecular basis of underlying growth variability in the ark shell, our 72
study investigates the transcriptome profiles and screens genome-wide differentially 73
expressed genes (DEGs) associated with growth variability in one full-sib family of the ark 74
shell reared under the uniform conditions. The aim of this study is to investigate the gene 75
expression pattern underlying these extreme differences in growth rate among siblings, assist 76
our understanding of the sophisticated processes of growth regulation in this species as well 77
as other bivalves, and provide useful information for the selective breeding of bivalve 78
species. 79
2. Results and Discussion
80
2.1 Sequence Analysis and De Novo Assembly 81
There was a total of 276,082,016 raw reads generated by Illumina sequencing for the three 82
sequencing samples (Table 1). The raw reads used in this study have been deposited in the 83
NCBI SRA database (accession number: SRP067102). To ensure the data quality, raw reads 84
were filtered by removing reads containing adapters, ambiguous nucleotides and low-quality 85
reads. After filtering, there were a total of 264,369,458 clean reads remained and 86
26,415,046,707 clean bases produced, with the ratio of valid bases were more than 95.5%. 87
For the three samples, Q30 percentages were detected to have 89.01%, 89.18%, and 88.95%, 88
respectively. The average percentage of GC content for the clean reads is37.67%, ranging 89
from 37% to 38%. These results suggest that the present sequencing is necessary for accurate 90
determination of the expression level of genes in all the samples. 91
Overall, the clean reads had been assembled into 98,502 unique transcripts. The mean 92
length of transcripts is 994 nucleotides, ranging from 301 to 36,344 nucleotides, with N50 of 93
likely to be assembled into unigenes (data not shown). There were 70.38% of short reads 95
(<=1000 nt) were assembled into unigenes, while less than one-sixth (11.30%) of long reads 96
(> 2000 nt) were assembled into unigenes. 97
2.2 Functional Annotation of Unigenes 98
The highest percentage of unigenes annotated in the NR database accounted for 33.19% of 99
all unigenes, followed by 30.58% annotated in the SWISSPROT database and 25.63% in 100
KOG database. In contrast, there were only 13.04% of unigenes annotated in the KEGG 101
database. For NR annotations, there were 67.45% (22,055 unigenes) of all annotated unigenes 102
observed to have strong homology with E-value < 10-30, while there were only 15.60% 103
unigenes annotated in NR with E-value between 10-15 and 10-5. The maximum number of the 104
annotations (37.32%; 12,204) is homologous to the proteins from the Pacific oyster 105
Crassostrea gigas, followed by 7.27% from Lingula anatina and 6.45% from Capitella 106
teleta. 107
A total of 28663 annotated unigenes were assigned to the 25 ortholog group in KOG 108
database (Fig. 2). More than 30% of the annotated unigenes were grouped into two 109
subcategories: (R) General function prediction only (17.10%), and (T) Signal transduction 110
mechanisms (16.37%). In contrast, less than 10% of the unigenes were distributed unevenly 111
in the remaining subcategories. For GO annotation, a total of 25,246 unigenes are assigned to 112
three main functional categories, including biological process (BP), cellular component (CC), 113
and molecular function (MF). For the category of biological process, there were more than 114
50% unigenes involved in the subcategories of metabolic process, cellular process, and 115
single-organism process. For the category of cellular component, more than 25% genes were 116
involved in the subcategories of cell and cell part. For the category of molecular function, 117
most genes were assigned to the subcategories of binding (61.39%) and catalytic activity 118
(40.38%). The biological pathways determined by KEGG analysis yielded 12,847 unigenes 119
assigned to 377 different pathways, which were classified into five specific pathway groups, 120
including metabolism, genetic information processing, environmental information processing, 121
cellular processes, and organismal systems. 122
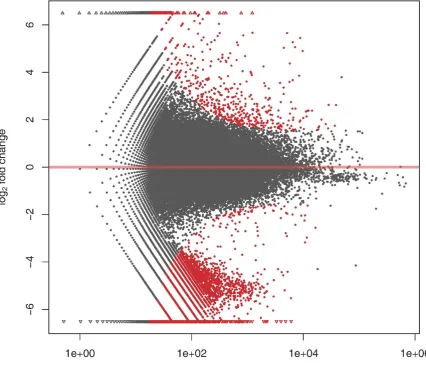
2.3 Analysis of differentially expressed genes in fast- and slow-growing groups 123
The count of the expressed tags was separately calculated for each library and used to 124
We compared the expression level between fast- and slow-growing groups, and detected a 126
total of 6,357 differentially expressed genes (DEGs), with the filter criteria of fold changes at 127
least 2-fold up- or down-regulated with the p-value < 0.05 (Figure 3). The MA-plot-based 128
method was used to visualize the gene expression differences between the two groups [27]. 129
Of the 6,357 DEGs, 580 showed significantly up-regulated expression and 5,777 showed 130
down-regulated expression in the slow VS. fast groups. The gene expression was compared 131
between fast- and slow-growing groups, exhibiting a maximum upregulation of 8.6-fold and a 132
maximum down-regulation of 9.3-fold, in term of log2 (fold change). 133
To narrow down the considerable number of differentially expressed genes, a more strict 134
algorithm with FDR < 0.05 was used to screen the DEGs between the two groups. The 135
comparison of gene expression identified 914 DEGs, with log2 (fold change) ranged from -9.3 136
to 8.6 (Supplement Table 1). Among these DEGs, 68 showed significantly up-regulated 137
expression, while 846 were observed to have down-regulated expression in the fast-growing 138
group. The largest number of the DEGs (82; 9.0%) were related to large or small subunit 139
ribosomal protein, which showed down-regulated pattern in the fast-growing group compared 140
to the slow one. In contrast, the other DEGs were associated with a variety of genes, such as 141
trypsin, pancreatic elastase, carboxypeptidase, acetylcholinesterase, notch, collagen, and 142
cofilin. 143
The eukaryotic ribosome, composed of four rRNAs and 79-80 ribosomal proteins, is 144
responsible for protein synthesis and its translational regulation, which controls cell growth, 145
division and development [28-30]. Despite this, the contribution of ribosomal proteins to 146
ribosome assembly and function is often not well understood. In the present study, a large 147
number of DEG identified as ribosomal proteins suggest their important roles for protein 148
metabolism in the inter-individual growth variability. The findings are consistent with 149
previous results that showed many of the annotated sequences with matches to ribosomal 150
proteins, which support the efficiency of protein metabolism responsible for playing a role in 151
growth heterosis [21]. 152
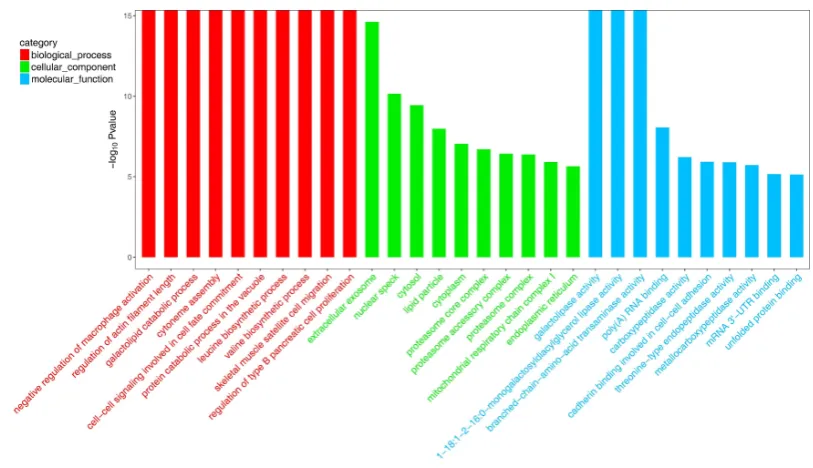
2.4 GO and KEGG pathway enrichment analysis of DEGs 153
The enrichment analysis of DEGs was used to explore the functional roles of DEGs in 154
growth regulation of S. subcrenata. The enrichment analysis for these DEGs revealed that 155
they were assigned to 1,054 GO terms with the FDR lower than 0.05. Of these enriched GO 156
category (Fig. 4). For the category of biological process, the enriched DEGs were mainly 158
associated with macrophage activation, cytoneme assembly, protein synthesis and catabolism, 159
muscle growth,and cell-cell signaling. For the category of molecular function, the enriched 160
DEGs were largely related to the activities of enzymes, such as lipase, transaminase, 161
carboxypeptidase, endopeptidase and metallocarboxypeptidase. For the category of cellular 162
component, the enriched DEGs were referred to extracellular exosome, nuclear speck, lipid 163
particle, cytoplasm, proteasome complex, mitochondrial respiratory chain, and endoplasmic 164
reticulum. 165
The DEGs were also subjected to KEGG pathway enrichment. As a result, DEGs were 166
annotated to 64 signaling pathways with FDR < 0.05. The most enriched pathways (FDR < 167
0.01; DEGs number > 10) including 1613 DEGs in 29 pathways (Table 2). The enriched 168
pathways were mainly classified into three groups, including energy metabolism (oxidative 169
phosphorylation, citrate cycle, carbon metabolism, transport and catabolism, and fatty acid 170
metabolism), protein synthesis and degradation (amino acid biosynthesis, amino acid 171
degradation, proteasome, protein processing, protein export, protein digestion and absorption), 172
and others (nervous system, endocrine system, and immune system). 173
The citrate cycle (TCA) and oxidative phosphorylation are central biochemical pathways 174
in cellular energy metabolism [31]. Among the DEGs detected in this study, the largest 175
proportion of 30.25% (488 DEGs) was significantly enriched in metabolism-related pathways. 176
Oxidative phosphorylation and TCA are two closely linked pathways involved in oxidation of 177
nutrients for producing usable chemical energy in the form of ATP, which take place in 178
mitochondria of eukaryotic cells [32]. For almost all aerobic organisms, oxidative 179
phosphorylation is the process in which energy is formed [33]. In the present study, oxidative 180
phosphorylation is identifed as the top enriched pathway, which includes 88 transcripts with 181
the lowest FDR value of 1.80E-11. Functional annotation in the pathway of oxidative 182
phosphorylation reveals that DEGs are mainly associated with mitochondrial genes, such as 183
NADH dehydrogenase, NADH-ubiquinone oxidoreductase, cytochrome c oxidase, 184
mitochondrial F1F0-ATP synthase, and cytochrome b. Citrate cycle, also known as TCA 185
cycle, is an important pathway used by all aerobic organisms to generate energy for the 186
oxidation of carbohydrates and fatty acids, which supplies NADH for use in the oxidative 187
phosphorylation and other metabolic processes [34]. In the pathway of citrate cycle, 33 DEGs 188
are significantly enriched, which encode for succinate dehydrogenase, ATP-citrate lyase, 189
synthase, etc. The enriched metabolism-related pathways in this study are consistent with 191
previous studies, which indicate that metabolic efficiencies are responsible for growth rate 192
differences in clam R. philippinarum [17], and oyster C. gigas [35]. For instance, high growth 193
rates of clams are achieved through a combination of faster feeding and higher digestive 194
performance, which result in the increased growth efficiency, mainly based on reduced 195
metabolic costs of growth [17]. 196
Protein is a dietary component essential for nutritional homeostasis in animals, and 197
ingested protein undergoes a complex series of degradative processes. Protein synthesis is 198
one of the dominant ATP-consuming processes in both of vertebrates and invertebrates [8, 36, 199
37]. In the present study, a total of 317 DEGs (19.65%) are identified to be involved in 200
protein synthesis and degradation. The findings indicate that there might be a dramatic 201
change in efficiency of amino acid and protein metabolism between fast and slow growing 202
individuals. Moreover, the pathway of proteasome had 44 DEGs, which mainly encoded for 203
20S and 26S proteasome. The 26S proteasome is responsible for the degradation of most 204
ubiquitylated proteins by an ATP-dependent mechanism, relying on proper interactions 205
between multiple subunits of the enzyme and between multiple modules [38]. Additionally, 206
the pathway of protein folding, sorting and degradation plays an essential role in invertebrate 207
physiology as the site of nutrient digestion and absorption [37, 39]. For instance, the 208
physiological bases of growth heterosis for oyster larvae are enhanced feeding rate and 209
metabolic efficiency, which are potentially realized through different protein depositional 210
efficiencies [37]. Moreover, much of the differences in metabolic rates of fast- and 211
slow-growing mussels could be ascribed to differences in protein turnover [39].Compared to 212
slow-growing individuals, fast growers usually have higher energy gain rates coupled with 213
lower metabolic costs of growth [15,17, 21]. Consistently, our findings of DEGs enrichment 214
in protein metabolism also shed lights on that efficiency of protein synthesis and degradation 215
may contribute to the growth rate differences in fast and slow growers in the ark shell. It is 216
therefore suggested that relatively higher rates of protein digestion, absorption, processing in 217
fast growers of bivalves result in higher energy gain rates and lower metabolic costs, 218
compared to those in slow growers. 219
In conclusion, the patterns of gene expression may be related to physiological differences 220
underlying growth variability, in accordance with previous reports on other bivalve species. 221
According to the evidences of gene expression in the contrasting individuals from a full-sib 222
energy requirements for metabolism maintenance, accompanying with greater efficiency of 224
protein synthesis and degradation in ark shells. However,further study is needed to examine 225
the physiological basis of extreme growth differences in the ark shell. 226
3. Methods
227
3.1 Sample prepare and collection 228
One full-sib family of the ark shell was produced in the hatchery in Jinzhou City through a 229
stimulated spawning of one male and one female parents collected from a wild population. 230
The larvae and spats were cultivated in a single family tank. After two-month rearing, two 231
groups were segregated by successive selection of spats chosen from the extremes of the sizes 232
from the same family. The average shell length of fast- and slow-growing individuals were 233
4.120±0.58 mm and1.50±0.25 mm, respectively. Both of fast and slow growers were 234
maintained in the rearing container under the identical feeding and environmental conditions. 235
The spats were fed with a mixture of the algae of Isochrysis galbana and Nitzschia closterium 236
supplied at a ration of 100,000-150,000 cells mL−1. The spats from fast- and slow-growing 237
groups were dissected and tissues were stored in RNAlater (Ambion) at -70°C for RNA 238
extraction. 239
3.2 cDNA Library preparation and Solexa sequencing 240
Total RNA was extracted using Trizol according to the manufacturer's instructions. The 241
RNA purity was evaluated by using Agilent Bioanalyzer 2100 system (Agilent Technologies, 242
CA, USA). The degradation and contamination of RNA was monitored on 1% agarose gels. 243
RNA samples from the fast- and slow-growing groups were pooled separately to make two 244
sequencing cDNA libraries (fast VS. slow groups). In addition, RNA samples from five 245
tissues, including adductor muscle, gill, mantle, hepatopancreas and foot, were pooled in 246
equal amounts to generate a mixed sample for library construction. The three libraries for 247
transcriptome analysis were prepared using Illumina’s kits following manufacturer’s 248
recommendations and then sequenced on the Illumina HiSeq 2000 platform. 249
3.3 Unigene assembly and functional annotation 250
quality reads before assembly. Paired-end reads were used for the gap filling of scaffolds to 252
get the transcripts that could not be extended on either end. The longest transcript in a 253
clustering unit was selected as unigene. Q20, Q30 and GC-content of the data were calculated 254
to estimate the quality of data for the downstream analyses. The unigenes were further 255
submitted to Blastn and Blastx searches with annotation against the databases, including the 256
National Center for Biotechnology Information (NCBI) Nr database, the Swiss-Prot protein 257
database, the Eukaryotic Orthologous Groups (KOG) protein database, and the Kyoto 258
Encyclopedia of Genes and Genomes (KEGG) pathway database with a E-value cut-off of 259
10-5. Functional annotation by Gene Ontology (GO) terms was analyzed by Blast2GO 260
(http://www.blast2go.com) software at default settings [40]. 261
3.4 Differentially expressed genes (DEGs) and pathway enrichment analysis 262
The RPKM (reads per kilobase of exon model per million mapped reads) method was used 263
to calculate the expression levels of the unigenes [41]. To identify the genes with significantly 264
different expression levels between fast- and slow-growing individuals, differential gene 265
expression analysis was performed to uncover the gene expression profiles of the samples 266
from fast- and slow-growing groups using the DESeq [42]. The false discovery rate (FDR) 267
was used to determine the threshold of the P values in multiple tests [43]. The significant 268
differences of gene expression between the two groups were determined with a cut-off 269
threshold of P < 0.05 and log2|FoldChange| > 1. GO and KEGG enrichment analyses were 270
performed using the hypergeometric distribution test to identify significantly enriched 271
functional classification or metabolic pathways. The significantly enriched unigenes were 272
selected based on the adjusted P values using an optimized FDR. The resulted DEGs were 273
classified for the categories using the annotation of GO and KEGG pathways. 274
4. Conclusions
275
In conclusion, we report the first comprehensive transcript dataset of the transcriptome for 276
the ark shell S. subcrenata. The identified and annotated transcripts will provide valuable 277
genomic resources for the understanding of its biological characteristics. Comparison of the 278
transcriptomes of fast- and slow-growing individuals derived from one full-sib family 279
revealed many differentially expressed genes potentially related to growth variability in this 280
species. GO and KEGG enrichment analysis shed lights on that metabolism, protein synthesis 281
accordance with previous reports on growth regulation of other bivalve species, suggesting 283
that the pattern of gene expression may be related to their physiological differences, with 284
greater efficiencies of protein synthesis and degradation in fast growers. The present 285
investigation highlights the molecular basis of growth variability in the ark shell, provides a 286
few candidate genes for growth regulation in bivalves. Further analyses are thus needed to 287
investigate the physiological traits of growth variability. 288
Acknowledgements: This research was supported by National Natural Science Foundation 289
of China (31302186), Cultivation Plan for Innovative and High-level Talents of Dalian City 290
(2016RQ081), Modern Agro-industry Technology Research System of China (CARS-49), 291
Cultivation Plan for Youth Agricultural Science and Technology Innovative Talents of 292
Liaoning Province (2014013), Liaoning Fisheries Science and Technology Program (201209) 293
and Liaoning Science and Technology Project (2015103044). 294
Author Contributions: Qingzhi Wang and Qi Li conceived and designed the experiments; 295
Weiming Teng performed the experiments; Qingzhi Wang analyzed the data and wrote the 296
paper; Xiujun Sun revised the paper; Miao Liang, Shangkun Du, Zunchun Zhou, Xi Xie 297
contributed reagents/materials/analysis tools. 298
Conflicts of Interest: The authors declare no conflict of interest. 299
References
300
1. Gjerde, B. Growth and reproduction in fish and shellfish. Aquaculture. 1986, 57, 37-55. 301
2. Newkirk, G.F. Review of the genetics and the potential for selective breeding of 302
commercially important bivalves. Aquaculture 1980, 19, 209-228. 303
3. Newkirk, G. F.; Haley, L. E. Progress in selection for growth rate in the European oyster 304
Ostrea edulis. Mar. Ecol. Prog. Ser. 1982, 10, 77-79. 305
4. Mallet, A. L.; Haley, L. E. Growth rate and survival in pure population matings and 306
crosses of the oyster Crassostrea virginica. Can. J. Fish. Aquat Sci. 1983, 40, 948-954. 307
5. Brown, J.R. Multivariate analyses of the role of environmental factors in seasonal and 308
site-related growth variation in the Pacific oyster Crassostrea gigas. Mar. Ecol. Prog. Ser. 309
1988, 45, 225-236. 310
Quantitative and molecular genetic analyses of heterosis in bivalve molluscs. J. Exp. Mar. 312
Biol. Ecol. 1996, 203, 49-59. 313
7. Evans, S.; Langdon, C. Direct and indirect responses to selection on individual body 314
weight in the Pacific oyster (Crassostrea gigas). Aquaculture 2006, 261, 546-555 315
8. Applebaum, S.L.; Pan, T.C.F.; Hedgecock, D.; Manahan, D.T. Separating the nature and 316
nurture of the allocation of energy in response to global change. Integr. Comp. Biol. 2014, 317
54, 284-295. 318
9. Anger, K. Salinity as a key parameter in the larval biology of decapod crustaceans. 319
Invertebr. Reprod. Dev. 2003, 43, 29-45. 320
10.Beaumont, A.R.; Turner, G.; Wood, A.R.; Skibinski, D.O. Hybridisations between Mytilus 321
edulis and Mytilus galloprovincialis and performance of pure species and hybrid veliger 322
larvae at different temperatures. J. Exp. Mar. Biol. Ecol. 2004, 302, 177-188. 323
11.Gosling, E. Bivalve molluscs: Biology, ecology and culture. John Wiley & Sons, 2003. 324
12.Bayne, B.L. Physiological components of growth differences between individual oysters 325
(Crassostrea gigas) and a comparison with Saccostrea commercialis. Physiol. Biochem. 326
Zoo. 1999, 72, 705-713. 327
13.Bayne, B.L. Relations between variable rates of growth, metabolic costs and growth 328
efficiencies in individual Sydney rock oysters (Saccostrea commercialis). J. Exp. Mar. 329
Biol. Ecol. 2000, 251, 185-203. 330
14.Bayne, B.L. Phenotypic flexibility and physiological tradeoffs in the feeding and growth 331
of marine bivalve molluscs. Integr. Comp. Biol. 2004, 44, 425-432. 332
15.Pace, D.A.; Marsh, A.G.; Leong, P.K.; Green, A.J.; Hedgecock, D.; Manahan, D.T. 333
Physiological bases of genetically determined variation in growth of marine invertebrate 334
larvae: a study of growth heterosis in the bivalve Crassostrea gigas. J. Exp. Mar. Biol. 335
Ecol. 2006, 335, 188-209. 336
16.Pernet, F.; Tremblay, R.; Redjah, I.; Sévigny, J.M.; Gionet, C. Physiological and 337
biochemical traits correlate with differences in growth rate and temperature adaptation 338
among groups of the eastern oyster Crassostrea virginica. J. Exp. Mar. Biol. Ecol. 2008, 339
211, 969-977. 340
inter-individual growth variability in the spat of clams (Ruditapes philippinarum). 342
Aquaculture 2011. 321, 113-120. 343
18.Jiao, W.; Fu, X.; Dou, J.; Li, H.; Su, H.; Mao, J.; Yu, Q.; Zhang, L.; Hu, X.; Huang, X.; 344
Wang, S.; Bao, Z. High-resolution linkage and quantitative trait locus mapping aided by 345
genome survey sequencing: building up an integrative genomic framework for a bivalve 346
mollusc. Dna. Res. 2013a. 21, 85-101. 347
19.Jiao, W.; Fu, X.; Li, J.; Li, L.; Feng, L.; Lv, J.; Zhang, L.; Wang, X.; Li, Y.; Hou, R.; 348
Zhang, L.; Hu, X.; Wang, S.; Bao, Z. Large-scale development of gene-associated 349
single-nucleotide polymorphism markers for molluscan population genomic, comparative 350
genomic, and genome-wide association studies. Dna. Res. 2013b. 21, 183-193. 351
20.Guan, Y.; He, M.; Wu, H. Differential mantle transcriptomics and characterization of 352
growth-related genes in the diploid and triploid pearl oyster Pinctada fucata. Mar. Genom. 353
2017, 33, 31-38. 354
21.Hedgecock, D.; Lin, J.Z.; DeCola, S.; Haudenschild, C.D.; Meyer, E.; Manahan, D.T. 355
Transcriptomic analysis of growth heterosis in larval Pacific oysters (Crassostrea gigas). 356
P. Natl. Acad. Sci. 2007, 104, 2313-2318. 357
22.Park, H.J.; Lee, W.C.; Choy, E.J.; Choi, K.S.; Kang, C.K. Reproductive cycle and gross 358
biochemical composition of the ark shell Scapharca subcrenata (lischke, 1869) reared on 359
subtidal mudflats in a temperate bay of Korea. Aquaculture 2011, 322, 149-157. 360
23.Wang, Q.; Zhang, M.; Teng, H.; Zhou, Z.; Tan, K.; Du, S. A review: research progress of 361
biology in ark shell Scapharca subcrenata insight from aquaculture. J. Dalian. Ocean. 362
Univ. 2015, 30, 437-443. 363
24.Sun, X.; Yang, A.; Wu, B.; Zhou, L.; Liu, Z. Characterization of the mantle transcriptome 364
of Yesso scallop (Patinopecten yessoensis): identification of genes potentially involved in 365
biomineralization and pigmentation. PLoS One 2015. 10, e0122967. 366
25.Yue, X.; Nie, Q.; Xiao, G.; Liu, B. Transcriptome analysis of shell color-related genes in 367
the clam Meretrix meretrix. Mar. Biotechnol. 2015, 17, 364-374. 368
26.Liu, H.; Zheng, H.; Zhang, H.; Deng, L.; Liu, W.; Wang, S.; Meng, F.; Wang, Y.; Guo, Z.; 369
Li, S.; Zhang, G. A de novo transcriptome of the noble scallop, Chlamys nobilis, focusing 370
on mining transcripts for carotenoid-based coloration. BMC Genom. 2015, 16, 44. 371
identifying differentially expressed genes from RNA-seq data. Bioinformatics 2010, 26, 373
136-138. 374
28.Terzian, T.; Box, N. Genetics of ribosomal proteins: “curiouser and curiouser”. PLoS. 375
Genet. 2013. 9, e1003300. 376
29.de la Cruz, J.; Karbstein, K.; Woolford Jr, J.L. Functions of ribosomal proteins in 377
assembly of eukaryotic ribosomes in vivo. Annu. Rev. Biochem. 2015, 84, 93-129. 378
30.Yusupova, G.; Yusupov, M. Ribosome biochemistry in crystal structure determination. 379
RNA, 2015. 21, 771-773. 380
31.Oexle, H.; Gnaiger, E.; Weiss, G. Iron-dependent changes in cellular energy metabolism: 381
influence on citric acid cycle and oxidative phosphorylation. Biochim Biophys Acta., 1999, 382
1413, 99-107. 383
32.Cooper GM. The Cell: A Molecular Approach. 2nd edition. Metabolic Energy. Sunderland 384
(MA): Sinauer Associates, 2000. 385
33.Balaban, R.S. Regulation of oxidative phosphorylation in the mammalian cell. Am. J. 386
Physiol-Cell. Ph. 1990, 258, 377-389. 387
34.Atkinson, D.E. Citrate and the citrate cycle in the regulation of energy metabolism. 388
Biochemical Society symposium 1967, 27, 23-40. 389
35.Tamayo, D.; Ibarrola, I.; Urrutxurtu, I.; Navarro, E. Physiological basis of extreme growth 390
rate differences in the spat of oyster (Crassostrea gigas). Mar. Biol. 2014, 161, 391
1627-1637. 392
36.Buttgereit, F.; Brand, M.D. A hierarchy of ATP-consuming processes in mammalian cells. 393
Biochem. J. 1995, 312, 163-167. 394
37.Pace, D.A.; Manahan, D.T. Fixed metabolic costs for highly variable rates of protein 395
synthesis in sea urchin embryos and larvae. J. Exp. Mar. Biol. Ecol. 2006. 209, 158-170. 396
38.Gaczynska, M.; Osmulski, P.A. Targeting protein-protein interactions in the proteasome 397
super-assemblies. Curr. Top. Med. Chem.2015, 15, 2056-2067. 398
39.Hawkins, A.J.S.; Bayne, B.L.; Day, A.J. Protein turnover, physiological energetics and 399
heterozygosity in the blue mussel, Mytilus edulis: the basis of variable age-specific 400
growth. Proceedings of the Royal Society of London B: Biological Sciences, 1986, 229, 401
40.Conesa, A.; Götz, S.; García-Gómez, J.M.; Terol, J.; Robles, M. Blast2GO: a universal 403
tool for annotation, visualization and analysis in functional genomics research. 404
Bioinformatics 2005, 21, 3674-3676. 405
41.Mortazavi, A.; Williams, B.A.; McCue, K.; Schaeffer, L.; Wold, B. Mapping and 406
quantifying mammalian transcriptomes by RNA-Seq. Nat. Methods. 2008, 5, 621-628. 407
42.Anders, S.; Huber, W. Differential expression of RNA-Seq data at the gene level–the 408
DESeq package. EMBL, 2013. 409
43.Benjamini, Y.; Hochberg, Y. Controlling the false discovery rate: a practical and powerful 410
approach to multiple testing. J. R. Stat. Soc. B. 1995, 57, 289-300. 411
Table 1. Summary statistics for sequencing and data quality of RNA-Seq 413
414
Sample Raw
reads Raw bases
Clean reads
Clean bases
Valid ratio
Q30 (%)
GC (%)
Fast-growing 89567538 8956753800 85867622 8579632864 95.78% 89.01% 38%
Slow-growing 91586960 9158696000 87694654 8762340824 95.67% 89.18% 37%
Mixed tissues 94927518 9492751800 90807182 9073073019 95.57% 88.95% 38%
Table 2. List of most enriched pathways for DEGs between the fast- and slow-growing groups
416
KEGG Pathway Pathway ID Class DEG number p FDR Enrichment score
Oxidative phosphorylation ko00190 Energy metabolism 88 4.94E-14 1.80E-11 2.13
Proteasome ko03050 Protein folding, sorting and degradation 44 1.91E-13 3.49E-11 2.88
Non-alcoholic fatty liver disease (NAFLD) ko04932 Endocrine and metabolic diseases 84 1.09E-08 1.33E-06 1.77
Citrate cycle (TCA cycle) ko00020 Carbohydrate metabolism 33 2.80E-08 2.56E-06 2.46
Protein processing in endoplasmic reticulum ko04141 Protein folding, sorting and degradation 104 8.56E-08 6.25E-06 1.61
Parkinson's disease ko05012 Endocrine and metabolic diseases 85 6.46E-07 3.93E-05 1.63
Th1 and Th2 cell differentiation ko04658 Immune system 49 7.28E-06 3.79E-04 1.78
Endocrine resistance ko01522 Drug resistance 66 1.30E-05 5.46E-04 1.61
Thyroid hormone signaling pathway ko04919 Endocrine system 99 1.35E-05 5.46E-04 1.47
Carbon metabolism ko01200 Carbon metabolism 80 3.85E-05 1.41E-03 1.50
Prion diseases ko05020 Neurodegenerative diseases 46 4.49E-05 1.49E-03 1.70
Vibrio cholerae infection ko05110 Infectious diseases 48 5.35E-05 1.63E-03 1.67
T cell receptor signaling pathway ko04660 Immune system 36 6.16E-05 1.73E-03 1.81
Carbon fixation pathways in prokaryotes ko00720 Energy metabolism 17 7.63E-05 1.99E-03 2.34
ErbB signaling pathway ko04012 Signal transduction 36 9.61E-05 2.34E-03 1.77
Protein digestion and absorption ko04974 Digestive system 63 1.07E-04 2.45E-03 1.53
Valine, leucine and isoleucine degradation ko00280 Amino acid metabolism 41 1.47E-04 3.11E-03 1.68
Endocytosis ko04144 Transport and catabolism 104 1.53E-04 3.11E-03 1.38
Tight junction ko04530 Cellular community - eukaryotes 91 1.69E-04 3.26E-03 1.41
Retrograde endocannabinoid signaling ko04723 Nervous system 56 1.91E-04 3.48E-03 1.54
Fatty acid metabolism ko01212 Fatty acid metabolism 44 2.02E-04 3.51E-03 1.63
Dorso-ventral axis formation ko04320 Development 51 3.62E-04 6.00E-03 1.54
Synaptic vesicle cycle ko04721 Synaptic vesicle cycle 32 4.94E-04 7.84E-03 1.70
2-Oxocarboxylic acid metabolism ko01210 Fatty acid metabolism 16 5.78E-04 8.12E-03 2.10
Renin-angiotensin system ko04614 Endocrine system 18 5.64E-04 8.12E-03 2.01
Biosynthesis of amino acids ko01230 Biosynthesis of amino acids 48 5.48E-04 8.12E-03 1.54
Protein export ko03060 Protein folding, sorting and degradation 17 6.75E-04 8.79E-03 2.03
Regulation of actin cytoskeleton ko04810 Cell motility 87 6.67E-04 8.79E-03 1.36
Adipocytokine signaling pathway ko04920 Endocrine system 30 7.39E-04 9.30E-03 1.70
417
418
Figure legends
419
420
Fig. 1. Histogram presentation of Gene Ontology (GO) classification in Scapharca 421
subcrenata transcriptome. The y-axis on the right represents the number of genes in 422
each category. The y-axis on the left indicates the percentage of genes in the main 423
category. 424
425
427
Fig. 3. Analysis of differentially expressed genes between the fast- and slow-growing groups. 428
The red dots represent the transcripts with significant expression between the two 429
431
Fig. 4. Histogram presentation of enriched GO terms. The different expressed genes are 432
summarized in three main categories: biological process (A), molecular function (B) 433
and cellular component (C). 434