ORIGINAL RESEARCH
Macular sensitivity and fixation patterns in normal eyes
and eyes with uveitis with and without macular edema
Yasir J. Sepah&Elham Hatef&Elizabeth Colantuoni&Jianmin Wang& Mathew Shulman&Fatima Idrees Adhi&Abeer Akhtar&Mohamed Ibrahim& Afsheen Khwaja&Roomasa Channa&Raafay Sophie&Millena Bittencourt& Jangwon Heo&Diana V. Do&Quan Dong Nguyen
Received: 19 September 2011 / Accepted: 9 November 2011 / Published online: 14 December 2011
#The Author(s) 2011. This article is published with open access at SpringerLink.com
Abstract
Purpose This study aims to investigate the relationship between macular sensitivity and thickness in eyes with uveitic macular edema (UME).
Design This study is a prospective observational case series. Methods The setting for this study was clinical practice. The study included 59 (28 with UME, 31 without UME) eyes of 26 patients with uveitis and 19 eyes of 10 normal subjects. The procedure followed was fundus-related perimetry and retinal thickness map with an automated fundus perimetry/tomogra-phy system. Main outcome measures included quantification of macular sensitivity, fixation pattern, and relationship between macular sensitivity and thickness.
ResultsFixation stability revealed that 56 eyes (93.44%) had stable fixation (>75% within the central 2° of point of fixation); three eyes (6.56%) were relatively unstable (<75% of fixation points located within 2°, >75% located within 4°); and no eye had unstable fixation (<75% of fixation points located within 4°). Evaluation of fixation location revealed that 45 eyes (76.27%) had central fixation location (>50% of fixation point within 0.5 mm of foveal center); seven eyes (11.86%) had
peri-central fixation location (25%<<50% within 0.5 mm); and seven eyes (11.86%) had eccentric (<25% of fixation point within 0.5 mm) fixation location. We measured macular sensitivity and corresponding thickness in 1,708 loci of 61 study eyes. Macular sensitivity increased by 0.02 dB (95%
confidence interval, 0.00, 0.06) per 1 μm increase in the
thickness for the thickness values≤280μm. Macular sensitivity
decreased by 0.04 dB (95% CI, −0.08, −0.01) per 1 μm
increase in the thickness for the thickness values >280μm.
Conclusions Perimetry quantification of macular sensitivity and retinal thickness, in association with other factors, may offer novel information regarding the impact of UME on retinal function.
Keywords Uveitis . Uveitic macular edema . Microperimetry . Retinal thickness
Introduction
Uveitis accounts for 300,000 new cases of legal blindness
and 2.8–10% of all cases of blindness in the USA every
year [1, 2]. Uveitis is known to cause a spectrum of
morphological changes in the retina. Macular edema (ME) remains the leading cause of decreased vision in these patients and may be responsible for permanent visual
impairment in 8.5% of the cases [3]. Although reversible
in early stages, as the macular edema becomes chronic, it leads to permanent damage of the photoreceptor layer with
progression to fibrosis [4]. Since chronic edema is a
vision-threatening complication, the importance of effective monitoring strategies for uveitic macular edema (UME) becomes even more important.
Clinical suspicion of UME can be confirmed with the aid of a variety of investigations, including fluorescein angiography Y. J. Sepah
:
E. Hatef:
J. Wang:
M. Shulman:
F. I. Adhi:
A. Akhtar
:
M. Ibrahim:
A. Khwaja:
R. Channa:
R. Sophie:
M. Bittencourt:
J. Heo:
D. V. Do:
Q. D. NguyenRetinal Imaging Research and Reading Center, Wilmer Eye Institute, Johns Hopkins University School of Medicine, Baltimore, MD, USA
E. Colantuoni
Bloomberg School of Public Health, Johns Hopkins University, Baltimore, MD, USA
Q. D. Nguyen (*) Johns Hopkins Hospital,
600 North Wolfe Street Maumenee 745, Baltimore, MD 21287, USA
(FA), optical coherence tomography (OCT), and scanning laser ophthalmoscope (SLO), among others. FA has long been used to assess macular edema qualitatively. However, recently, OCT has been established to be of great value in the diagnosis and monitoring of macular edema, as it provides quantitative assessment of the retinal thickness at various
locations [5]. Similarly, visual acuity (VA) is considered as
the gold standard in assessing retinal function. However, change in retinal thickness resulting from the presence of ME does not necessarily correlate with the VA change in
patients with UME [6]. Given that the functional outcome is
the focus of interest and its improvement the objective of treatment for UME, such disconnect between VA and UME limits the use of OCT as a definitive tool to measure response to therapy. Moreover, central VA is not sufficient to
fully characterize macular function [5,7].
We investigate the effects of UME on macular functional parameters quantified by an automated microperimetry system [scanning laser ophthalmoscope/spectral domain optical coherence tomography (SLO/OCTTM)®, OPKO/ OTI, Toronto, Canada] and correlate it with retinal thickness.
Methods
The index prospective study was approved by the Johns Hopkins Medicine Institutional Review Board. Adult patients with uveitis who were evaluated at the Wilmer Eye Institute, Johns Hopkins University (Baltimore, MD, USA) were eligible for participation. The diagnosis of uveitis and macular edema was made by a uveitis specialist (QDN) using slit-lamp examination, contact lens biomicro-scopy, and indirect ophthalmobiomicro-scopy, and confirmed with optical coherence tomography (OCT), fundus photography, and fluorescein angiography (FA).
Additional study assessment included the Early Treat-ment Diabetic Retinopathy Study (ETDRS) best-corrected visual acuity (BCVA). The duration of uveitis, disease status (quiescent or active), presence of macular edema, and anatomical location of the disease (intermediate, posterior, or pan-uveitis), among others, were collected. Healthy adults with no known ocular diseases were enrolled in the study as controls. The OCT imaging and microperimetry were performed on healthy adults using same protocol as participants with uveitis.
OCT imaging was performed with the spectral-domain OCT module integrated in the OPKO/OTI® device. The spectral OCT/SLO module of the device generated three-dimensional (3D) retinal maps. It captured 28,000 A scans per second, which enabled the acquisition of up to 128 longitudinal OCT scans in 2s over a 5-mm area in the macula. The distance between the retinal nerve fiber layer
and the hyporeflective line above the retinal pigment epithelium was measured automatically by the retinal
thickness algorithm [8].
To perform microperimetry, a circular test pattern, the POLAR 3 (28 dots: four central, 12 mid, and 12 outer rings) was used for all patients. The following features were incorporated in the POLAR 3 pattern: Goldman-III stimulus size, 200-ms stimulus duration, and a 1,000-ms interval between stimuli presentation. Fundus localization based on retinal vessel alignment was automatically tracked by the spectral OCT/SLO system. The images from retinal topography and microperimetry were aligned, and 3D overlay images were created. For each of the 28 loci of the POLAR 3 test pattern, retinal thickness values were obtained. The paired data of microperimetry threshold and corresponding retinal thickness measurements were used to evaluate the relationship between retinal thickness and
macular sensitivity [8].
The fixation pattern was evaluated as fixation location
and fixation stability [9]. Fixation stability was classified
into three categories: stable, relatively unstable, or unstable. If >75% of fixation points were located within a 2° diameter circle, regardless of the position of the foveal
center, the fixation was classified as stable. If <75% of
fixation points were located within a 2° circle, but >75% of fixation points were located within a 4°circle, fixation was
classified asrelatively unstable. If <75% of fixation points
were located within a 4° circle, fixation was classified as unstable. Fixation location was documented in three categories: central, pericentral, and eccentric. If >50% of fixation points were within 0.5 mm of the foveal center,
fixation was classified ascentral. If 25–50% of the fixation
points were within 0.5 mm of the foveal center, fixation
was classified as pericentral. If <25% of fixation points
were within 0.5 mm of foveal center, fixation was classified aseccentric.
Statistical analysis
Uveitic macular edema Exploratory data analyses included graphical (histograms, tables, side-by-side boxplots, and scatterplots) and statistical summaries (means, standard deviations, quantiles, and correlation coefficients) for (a) the distribution of each study variable, (b) the relationship between macular sensitivity and retinal thickness and potential confounding variables, and (3) the relationship between retinal thickness and potential confounding varia-bles. The potential confounding variables include disease duration and status, underlying diseases and anatomical type of the disease, BCVA, fixation stability, fixation location, age, and gender. Age was treated as a categorical
Linear mixed models were used to estimate the mean macular sensitivity as a function of retinal thickness adjusting for the potential confounding variables. The relationship between the mean macular sensitivity and retinal thickness was estimated
sepa-rately for retinal thickness≤350 and >350 μm; the
cut-point of 350μm was selected based on the exploratory
data analysis.
There were several potential sources of correlation within the data set: measurements correlated within subjects, visits, eyes, and circular test pattern (central, mid-, and outer rings around the foveal center). Exploratory analysis of the potential sources of correlation was performed by fitting the mean model described above, assuming the data were independent and examining the residuals of that model for the various sources of correlation. The linear mixed model included random intercepts for subject, visits, eye, and circular test pattern
[10].
Several sensitivity analyses were performed. The linear mixed model was fit, allowing the cut-point to vary from
340 to 370μm. In addition, an analysis was performed to
evaluate the effect of potential influential observations of retinal thickness by removing the upper and lower 1% of retinal thickness values from the data.
Normal eyes and those with uveitis but no UMEWith the same approach, the linear mixed models were used to estimate the mean macular sensitivity as a function of retinal thickness, BCVA, fixation stability, fixation location, age, gender, and ethnicity in eyes with uveitis and without macular edema comparing to healthy participants. The linear mixed model included random intercepts for subject, visits, eye, and circular test pattern. Age was treated as a
categorical variable with levels: age <30,≥30 to <40, ≥40
to <50, and≥50 years. The relationship between the mean
macular sensitivity and retinal thickness was estimated
separately for retinal thickness ≤280 and >280 μm. To
consider the effect of uveitis on the function of retina, an interaction term for disease presence (including those with macular edema and those without) and retinal thickness was considered in the model. The linear mixed model included random intercepts for subject, visits, and circular test
pattern [10].
Several sensitivity analyses were performed. The linear mixed model was fit, allowing the cut-point to vary from
270 to 310μm. In addition, an analysis was performed to
evaluate the effect of potential influential observations of retinal thickness by removing the upper and lower 1% of retinal thickness values from the data.
Statistical analysis was performed using STATA version 10.1 (STATACORP, College Station, TX, USA). Statistical
significance was reported ifp<0.05.
Results
Description of uveitis patients
A total of 26 patients (59 eyes) with the diagnosis of uveitis were enrolled in the study. Among these 26 patients, 14 patients contributed both eyes (28 eyes), and 12 patients contributed one eye at the initial visit, and eight patients (19 eyes) had follow-up visits. Tweny-eight eyes had UME, while 31 eyes with uveitis did not have macular edema. The
age range was 16–86 years with a median of 45.50 years
among the 26 patients. There were 15 women (57.69%) in our study. Of the total 26 patients, 11 (42%) had idiopathic posterior or pan-veitis, seven (26%) multifocal choroiditis, two (8%) punctate inner choroiditis, and additional two (8%) had birdshot choroidopathy. The remaining four (16%) patients had uveitis secondary to Lyme disease, sarcoidosis, autoimmune retinopathy, and ocular toxoplas-mosis. Of type, uveitis was intermediate in nine (35%) patients and posterior in 14 (54%) patients; pan-uveitis was diagnosed in three (11%) of the patients. Disease duration at the time of microperimetry measurement ranged from 1 month to 27 years with median disease duration of 20 months. BCVA ranged from 20/12.5 to 20/500 in the study eye (median, 20/40). In 38 (65.52%) eyes, the uveitic disease was quiescent at the time of microperimetry measurement; 28 (47.46%) eyes had macular edema.
Of the total 59 examined uveitic eyes (28 with macular edema; 31 eyes without), 45 eyes (76.27%) had stable fixation; seven eyes (two eyes with ME and five without ME) (11.86%) had relatively unstable fixation; and seven eyes (all eyes without ME) (11.86%) had unstable fixation. The evaluation of fixation location revealed that 56 eyes (94.92%) had central fixation, and three eyes had (5.08%) peri-central fixation. There was no eye with eccentric fixation. The mean retinal thickness in an area within
3 mm of the foveal center was 311.03 μm [standard
deviation (SD), 66.96 μm]; the mean macular sensitivity
was 11.79 dB (SD, 4.98 dB).
Description of normal participants
A total of 10 normal participants (19 eyes) were enrolled in
the study. The age range was 25–63 years with a median of
42.5 years. There were seven women (70.0%) among the participants with no known ocular diseases. The normal participants and patients with uveitis were matched with
regard to their age and gender distribution (p=0.3270 and
276.10 μm (SD, 33.57 μm), and the mean macular sensitivity was 16.48 dB (SD, 2.06 dB).
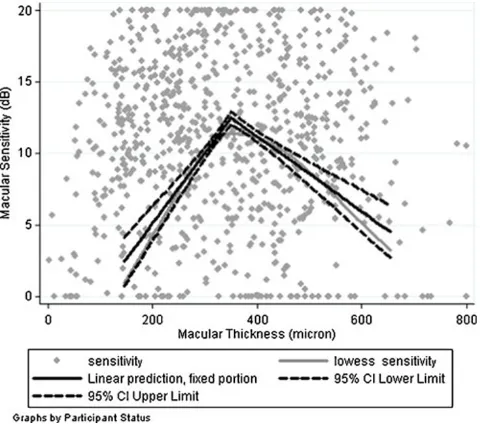
Macular sensitivity and retinal thickness in eyes with UME
Macular sensitivity and corresponding retinal thickness were measured for 28 loci located on one of the three circular patterns of each of the 28 eyes with active macular edema at the time of microperimetry measurement, with a total number of 784 pair measurements of macular sensitivity and retinal thickness. The mean retinal thickness
was 350.08 μm (SD, 69.33 μm), and the mean macular
sensitivity was 10.61 dB (SD, 4.67 dB). Figure1 displays
the relationship between the mean macular sensitivity as a function of retinal thickness estimated by a locally weighted scatterplot smoothing (LOWESS) smooth
func-tion (thick gray line). At a thickness of 200μm, the mean
sensitivity was approximately 4 dB and then rises linearly
to 11 dB by a thickness of 350 μm, but then decreases
linearly to 6 dB by a thickness of 600μm. It also presents
the fitted model for relationship between macular sensitiv-ity and retinal thickness (thick black line) as well as 95% CI
(dash lines). Table 1 displays the estimated relationships
between the macular sensitivity and retinal thickness as well as the potential confounders based on the linear mixed effects model. After removing the effects of retinal thickness and the potential confounders, approximately 4% of the variation in macular sensitivity could be attributed to differences across patients, and 31% of the variation could be attributed to differences between two
eyes of each patient. An additional 3% of the variation could be explained by variation across different visits and microperimetry measurement on each eye; an additional 3% was due to variation across macular areas on three rings around the foveal center in each eye.
After accounting for the potential confounding variables, the macular sensitivity increased by an average of 0.02 dB
(95% CI, 0.01, 0.03) per 1 μm increase in the retinal
thickness for the thickness values of 350 μm or less
measured with the OPKO/OTI spectral-domain OCT. Macular sensitivity decreased by an average 0.02 dB
(95% CI, −0.03,−0.01) per 1μm increase in the thickness
for thickness values of more than 350 μm. The estimated
change in mean macular sensitivity for retinal thickness of
350μm or less was different from the estimated change for
values >350μm (p<0.0001).
The adjusted mean macular sensitivity decreased with age. Specifically, the adjusted mean macular sensitivity for
patients 50–70 years of age was 0.12 dB smaller than those
50 years of age or younger (95% CI, −4.42, 4.17). The
adjusted mean macular sensitivity among those older than 70 years was 1.26 dB smaller than the adjusted mean for
patients of 50 years old or younger (95% CI,−8.70, 6.19).
Overall, the main findings were not sensitive to varying
the cut-point (340–370 μm) for the association between
mean macular sensitivity and retinal thickness. After removing the observations with the smallest and largest 1% of retinal thickness, the mean macular sensitivity was
estimated to increase by 0.02 per 1μm of retinal thickness
for retinal thickness <350 μm, while macular sensitivity
was estimated to decrease by 0.02 per 1 μm of retinal
thickness for retinal thickness >350μm.
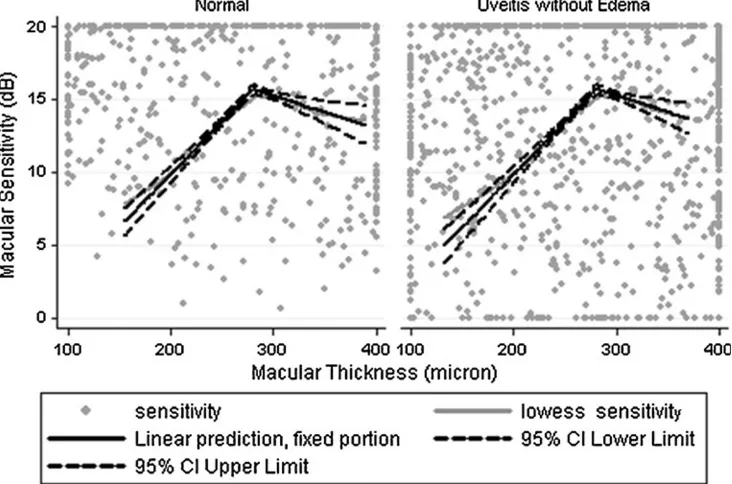
Macular sensitivity in eyes with uveitis compared to normal participants
Macular sensitivity and corresponding retinal thickness were measured for 28 loci located on one of the three circular patterns of each of the 31 eyes with a diagnosis of uveitis and no macular edema as well as 19 eyes of the normal participants, with a total number of 1,400 pair measurements of macular sensitivity and retinal thickness.
Figure 2 displays the relationship between the mean
macular sensitivity as a function of retinal thickness estimated by a LOWESS smooth function (thick gray line) for normal participants as well as those with uveitis and no
macular edema. At a thickness of 200 μm, the mean
sensitivity is roughly 10 dB in both groups, then rises
linearly to 15 dB by a thickness of 280μm, then decreases
linearly to 13 dB by a thickness of 380μm. It also presents
the fitted model for relationship between macular sensitiv-ity and retinal thickness (thick black line) as well as 95% CI
(dash lines). Table 2 displays the estimated relationships
between the macular sensitivity and retinal thickness as well as the potential confounders based on the linear mixed effects model. After removing the effects of retinal thickness and the potential confounders, approximately 45% of the variation in macular sensitivity could be attributed to differences across participants. An additional 8% of the variation could be explained by variation across different visits and microperimetry measurement on each eye and an additional 7% by variation across macular areas on three rings around the foveal center in each eye. After accounting for the potential confounding variables, in the normal eyes, the macular sensitivity increased by an
average of 0.02 dB (95% CI, 0.00, 0.03) per 1μm increase
in the retinal thickness for the thickness values of 280 μm
or less measured with the OPKO/OTI spectral-domain OCT. The macular sensitivity had a slight change per
1μm increase in the thickness for thickness values of more
than 280 μm (mean, 0.00 dB, 95% CI, −0.02, 0.02). The
estimated change in mean macular sensitivity for retinal
thickness of 280 μm or less was different from the
estimated change for values >280 μm (p<0.0285).
In patients with uveitis and no macular edema, the macular sensitivity increased by an average of 0.04 dB
(95% CI, 0.03, 0.05) per 1 μm increase in the retinal
Table 1 Linear mixed effects model for the relationship among macular sensitivity, retinal thickness, and associated factors in eyes with uveitic macular edema
Mean change in macular sensitivity (dB) 95% CI pvalue
Retinal thickness≤350μm 0.02 0.01, 0.03 0.000
Retinal thickness >350μm −0.02 −0.03,−0.01 0.000
Duration of uveitis (month) 0.08 0.00, 0.16 0.048
Disease status (active vs. stable) 4.62 0.66, 8.59 0.022
Underlying disease (other causes vs. idiopathic) −2.45 −7.00, 2.10 0.291
Anatomical type (pan-uveitis vs. intermediate and posterior) −5.84 −15.24, 3.57 0.224
Visual acuity (LOGMAR) −1.64 −5.05, 1.77 0.346
Fixation stability (relatively unstable vs. stable) −7.73 −13.42,−2.03 0.008
Fixation location (central, pericentral, eccenteric) 0.05 −2.19, 2.29 0.967
Age (>50 to≤70 comparing to those≤50) −0.12 −4.42, 4.17 0.954
Age (>70 years comparing to those≤50) −1.26 −8.70, 6.19 0.741
Gender (male vs. female) 2.96 −1.40, 7.32 0.184
CIconfidence interval,dBdecibel,DMEdiabetic macular edema
thickness for the thickness values of 280 μm or less. The macular sensitivity decreased by an average of 0.04 dB
(95% CI,−0.07,−0.02) per 1μm increase in the thickness
for thickness values of more than 280 μm. The adjusted
mean macular sensitivity changed with age. Specifically,
the adjusted mean macular sensitivity for patients 30–
40 years of age and 40–50 years of age was 1.34 and
1.55 dB different from those 30 years of age (95% CI,
−2.62, 5.31 and −2.25, 5.35, respectively). The adjusted
mean macular sensitivity among those 50 years or older was 2.50 dB smaller than the adjusted mean for patients
<50 years old (95% CI,−6.57, 1.57).
The main findings were not sensitive to varying the
cut-point (270–310 μm) for the association between mean
macular sensitivity and retinal thickness. After removing the observations with the smallest and largest 1% of retinal thickness, the mean macular sensitivity was estimated to
increase by 0.02 and 0.04 per 1μm of retinal thickness for
retinal thickness <280μm (among normal participants and
patients with uveitis). The estimated association for retinal
thickness >280 μm changed very little in both treatment
groups.
Discussion
Morbidity in eyes with uveitis often results from chronic and recurrent episodes of inflammation, which are associ-ated with duration of each episode, frequency of attacks,
and anatomic location of uveitis [11]. Such repeated attacks
may cause cumulative damage that may, over time, lead to irreversible tissue damage. In order to avoid cumulative damage of the disease, it is important that the inflammation
is managed aggressively [12] and the retinal function of
patients is monitored objectively [13]. Microperimetry
provides us with the necessary tools and may prove to be an integral part in the management of uveitis patients.
Microperimetry (or fundus-related perimetry) assesses macular sensitivity and provides an almost exact correlation between fundus disease and corresponding functional defects while taking into account the fixation pattern and
stability [14, 15]. Microperimetry (MP) testing has been
previously available in other devices, such as the Roden-stock® SLO and the automatic fundus-related perimeter, (MP1 Microperimeter®; Nidek Technologies, Tokyo, Japan). These devices have been used to evaluate various retinal conditions such as diabetic macular edema, age-related macular degeneration, idiopathic macular telengectasia, and central serous retinopathy, using different measurement
schemes [7, 14–17]. In the current study, we measured the
sensitivity using the OPKO/OTI® device, an automated fundus perimetry/tomography system, with a microperimet-ric radial pattern to cover central 12° of the macula in eyes with uveitis and UME. The advantages of using OPKO/ OTI® device include simultaneous SD-OCT, better image quality, and readily accessible structural and functional correlation of the 28 loci measured. Both MP-1 and OPKO/OTI devices are capable of performing serial exami-nations; however, the latter requires much less time to
complete the exam [18]. The OPKOP/OTI® device has been
employed to evaluate eyes with DME [19] and has shown
consistent results.
Although the correlation between retinal thickness and visual acuity is controversial, patients with UME have been previously demonstrated to have a negative correlation between macular sensitivity and retinal thickness. Roesel
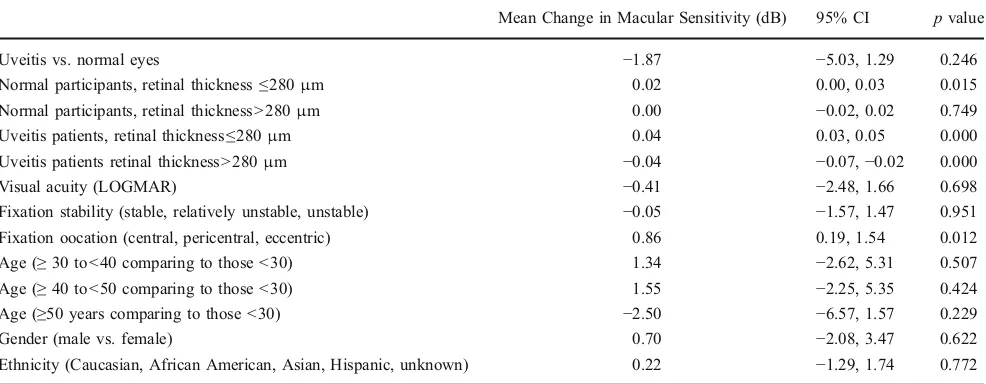
Table 2 Linear mixed effects model for the relationship among macular sensitivity, retinal thickness, and associated factors in eyes with uveitis as well as normal participants
Mean Change in Macular Sensitivity (dB) 95% CI pvalue
Uveitis vs. normal eyes −1.87 −5.03, 1.29 0.246
Normal participants, retinal thickness≤280μm 0.02 0.00, 0.03 0.015
Normal participants, retinal thickness >280μm 0.00 −0.02, 0.02 0.749
Uveitis patients, retinal thickness≤280μm 0.04 0.03, 0.05 0.000
Uveitis patients retinal thickness >280μm −0.04 −0.07,−0.02 0.000
Visual acuity (LOGMAR) −0.41 −2.48, 1.66 0.698
Fixation stability (stable, relatively unstable, unstable) −0.05 −1.57, 1.47 0.951
Fixation oocation (central, pericentral, eccentric) 0.86 0.19, 1.54 0.012
Age (≥30 to<40 comparing to those <30) 1.34 −2.62, 5.31 0.507
Age (≥40 to<50 comparing to those <30) 1.55 −2.25, 5.35 0.424
Age (≥50 years comparing to those <30) −2.50 −6.57, 1.57 0.229
Gender (male vs. female) 0.70 −2.08, 3.47 0.622
Ethnicity (Caucasian, African American, Asian, Hispanic, unknown) 0.22 −1.29, 1.74 0.772
et al. [6] studied 31 uveitis patients (53 eyes) and concluded that with increase in retinal thickness, the
retinal sensitivity decreases. Lardenoye et al. [20] also
reported decreased sensitivity in the macular area of patients with edema, though they only had five patients with inflammatory edema included in the study. Other investigators studying diabetic patients have also reported a decrease in retinal sensitivity when ME develops and its deterioration in eyes at more severe stages of ME
compared to the normal population [19,21–25].
The results of the current study are in partial agreement with what has already been reported in the literature. We observed that in the eyes with UME, there was a slight
increase in the retinal sensitivity with each 1μm increase in
retinal thickness when the thickness value was≤350μm. A
decrease in retinal sensitivity was seen with every 1 μm
increase in thickness thereafter. A similar trend was noted in uveitic eyes without ME and eyes with no known ocular diseases. However, in these two groups of patients, the thickness value beyond which we observed
a decline in retinal sensitivity was 280μm, 100μm less
than what was seen in UME eyes. Landa et al. [18] also
found a decrease in retinal sensitivity with thinning of the retina. One possible explanation for this variation may be a stress response, which results in the emergence of a hypersensitive retina as a consequence to the mechanical stress imparted by fluid accumulation in addition to the inflammatory insults to the tissue. Such stress responses have been well documented in cardiac and pancreatic tissue.
Uveitic eyes without ME not only had lower retinal sensitivity compared to normal eyes, but the corresponding rise in retinal sensitivity with each rise in retinal thickness was more in normal eyes compared to eyes with uveitis. Although the decrease in sensitivity in uveitic eyes without
ME was not statistically significant (p=0.246), it may
indicate that macular edema may not be the only factor affecting retinal sensitivity and that the inflammatory process in eyes with uveitis may affect retinal sensitivity.
The cut points of 350μm in eyes with UME and 280μm in
uveitic eyes without ME were chosen based on the exploratory data analysis. Unadjusted factors in the model, such as the frequency of flare-ups, duration of ME, and duration of disease, may play a role in the relationship between macular sensitivity and thickness. There may be the possibility that areas with higher macular thickness and edema have active disease compared to areas with normal thickness retina. Retinal thinning or atrophy either due to the development of cystic changes or loss of photoreceptors
have been shown to decrease retinal sensitivity as well [26,
27]. It should be noted that differences in measuring
devices (OPKO/OTI® vs MP-1®) and methods of data analysis may also result in variation in results.
In the current study, fixation was reported to be located centrally in majority of the cases (94.95%). We did not find any significant correlation between fixation location and retinal sensitivity even after adjusting for confounding factors (age, retinal thickness, duration of
disease, etc.). Roesel et al. [6] had noted similar findings
in UME patients and found that fixation was centrally located in 79% of the cases, relatively eccentric in 14%, and predominantly eccentric in only 7%. Although we had a small number of eyes with unstable fixation (relative and predominant), our model was able to detect a significant
(p= 0.008) decline in the sensitivity of the retina in these
eyes. Roesel et al. [6]. showed similar findings in UME
patients, pertaining to correlation of fixation location/ stability with retinal thickness and sensitivity, but they found that fixation was stable only in 47% and was eccentric in 21% of the UME eyes. These differences in the location of fixation can be attributed to differences among the two study populations. Our study population was younger (median = 45 years), while that of Roesel et al. was older (mean = 51, SD ± 14). Furthermore, 70% of
the population in Roesel’s study also had an epiretinal
membrane at the time of the study. Retinal thickness was
significantly higher (p= 0.003), and VA was significantly
lower (p= 0.08) in these patients compared to the subjects
in our study. Another reason could be the fact that we confirmed the presence of macular edema in all of our patients with spectral domain OCT in conjunction with FA, while Roesel et al. had used only FA for the detection and confirmation of ME. There may be cases of macular edema that do not demonstrate significant leakage on FA for diagnosis. Our results are consistent with findings by
Vujosevic et al. [28] who investigated retinal fixation
impairments in DME patients.
We also noted that there was a small but statistically significant increase in the sensitivity of the retina with an increase in the duration of disease. Such an increase in the sensitivity with disease duration may be because of the time required by the retina to recover from the initial insults, and as time passes by, the patient receives adequate therapy and the retinal sensitivity recovers. White and Bedell did show that patients with longer duration since onset of (macular disease) show oculo-motor behaviors qualitatively more like those of normal
eyes [29]. Other findings in our study suggest a trend of
decrease in retinal sensitivity with age both in eyes with UME and eyes without ME.
The recurrent episodes of UME as well as flare-ups of inflammation might induce a gradual decrease in the sensitivity and changes in the normal anatomy of the retina, which affects the relationship between retinal sensitivity and thickness. Similarly, retinal sensitivity may also be affected by the duration of each flare-up or episode of UME.
In conclusion, the results from our study have provided a novel insight into the relationship between fixation, retinal thickness, and retinal sensitivity among patients with uveitis, with and without macular edema. We recognize that additional, larger studies are required to further explore these relationships and to enhance our understanding of macular function in ocular inflammatory diseases, and look forward to contributing to such investigations.
Acknowledgments
Funding/support The scanning laser ophthalmoscope/spectral do-main optical coherence tomography (SLO/OCTTM®) is provided on loan by OPKO Health, Inc., Toronto, Canada, to the Johns Hopkins University.
Financial disclosures None.
Contributions to authors The design and conduct of the study were carried out by QDN, EH, YJS, JW, MI RC, AA, RS, and MB. Data collection was performed by QDN, EH, YJS, JW, MI, RC, AA, RS, and MB, management by QDN, analysis by EH and EC, and interpretation of the data by QDN, YJS, EH, and DVD. Preparation, review, or approval of the manuscript was by QDN, EH, YJS, DVD, and AA.
Statement about conformity with author information The study and data accumulation were carried out with approval from the Johns Hopkins Institutional Review Board (IRB). Informed consent for the research was obtained from the patients or subjects. This study is in accordance with HIPAA regulations.
Open Access This article is distributed under the terms of the Creative Commons Attribution License which permits any use, distribution and reproduction in any medium, provided the original author(s) and source are credited.
References
1. Rothova A et al (1996) Causes and frequency of blindness in patients with intraocular inflammatory disease. Br J Ophthalmol 80(4):332–336
2. Suttorp-Schulten MS, Rothova A (1996) The possible impact of uveitis in blindness: a literature survey. Br J Ophthalmol 80 (9):844–848
3. Malinowski SM, Pulido JS, Folk JC (1993) Long-term visual outcome and complications associated with pars planitis. Ophthalmology 100 (6):818–824, discussion 825
4. Gallagher MJ et al (2007) The characteristic features of optical coherence tomography in posterior uveitis. Br J Ophthalmol 91 (12):1680–1685
5. Sakata LM et al (2009) Optical coherence tomography of the retina and optic nerve—a review. Clin Experiment Ophthalmol 37 (1):90–99
6. Roesel M et al (2011) Comparison of retinal thickness and fundus-related microperimetry with visual acuity in uveitic macular oedema. Acta Ophthalmol 89:533–537
7. Rohrschneider K, Bultmann S, Springer C (2008) Use of fundus perimetry (microperimetry) to quantify macular sensitivity. Progress in Retinal and Eye Research 27(5):536–548
8. Landa G et al (2010) Combined three-dimensional spectral OCT/SLO topography and microperimetry: steps toward achieving functional spectral OCT/SLO. Ophthalmic Res 43 (2):92–98
9. Fujii GY et al (2003) Characteristics of visual loss by scanning laser ophthalmoscope microperimetry in eyes with subfoveal choroidal neovascularization secondary to age-related macular degeneration. Am J Ophthalmol 136(6):1067–1078
10. Kung-Yee Liang PH, Peter Diggle J, Scott Zeger L (2002) Analysis of longitudinal data, 2nd edn. Oxford University Press, Oxford
11. Durrani OM et al (2004) Degree, duration, and causes of visual loss in uveitis. Br J Ophthalmol 88(9):1159–1162
12. Smith JR (2004) Management of uveitis. Clinical and Experi-mental Medicine 4(1):21–29
13. Nguyen QD et al (2006) Treating chronic noninfectious posterior segment uveitis: the impact of cumulative damage. Proceedings of an expert panel roundtable discussion. Retina (Suppl):1–16 14. Toonen F et al (1995) Microperimetry in patients with central
serous retinopathy. Ger J Ophthalmol 4(5):311–314
15. Carpineto P et al (2007) Fundus microperimetry patterns of fixation in type 2 diabetic patients with diffuse macular edema. Retina 27(1):21–29
16. Charbel Issa P et al (2008) Correlation of macular function with retinal thickness in nonproliferative type 2 idiopathic macular telangiectasia. Am J Ophthalmol 145(1):169–175
17. Ojima Y et al (2008) Retinal sensitivity measured with the micro perimeter 1 after resolution of central serous chorioretinopathy. Am J Ophthalmol 146(1):77–84
18. Landa G et al (2010) Combined three-dimensional spectral OCT/SLO topography and microperimetry: steps toward achieving functional spectral OCT/SLO. Ophthalmic Research 43(2):92–98
19. Hatef ECE, Wang J, Ibrahim M, Shulman M, Adhi F, Sepah YJ, Channa R, Khwaja A, Nguyen QD, Do DV (2011) The relationship between macular sensitivity and retinal thickness in eyes with diabetic macular edema. Am J Ophthalmol 152:400.e2– 405.e2
20. Lardenoye CWTA, van Kooij B, Rothova A (2006) Impact of macular edema on visual acuity in uveitis. Ophthalmology 113 (8):1446–1449
21. Vujosevic S et al (2006) Diabetic macular edema: correlation between microperimetry and optical coherence tomography find-ings. Invest Ophthalmol Vis Sci 47(7):3044–3051
22. Kube T et al (2005) Fixation stability and macular light sensitivity in patients with diabetic maculopathy: a microperimetric study with a scanning laser ophthalmoscope. Ophthalmologica 219 (1):16–20
23. Okada K et al (2006) Correlation of retinal sensitivity measured with fundus-related microperimetry to visual acuity and retinal thickness in eyes with diabetic macular edema. Eye (Lond) 20 (7):805–809
visual acuity and retinal thickness in eyes with diabetic macular oedema. Eye (Lond) 20(11):1307–1308
25. Rohrschneider K et al (2000) Scanning laser ophthalmoscope fundus perimetry before and after laser photocoagulation for clinically significant diabetic macular edema. Am J Ophthalmol 129(1):27–32
26. Crossland MD et al (2005) Preferred retinal locus develop-ment in patients with macular disease. Ophthalmology 112 (9):1579–1585
27. Crossland MD, Culham LE, Rubin GS (2004) Fixation stability and reading speed in patients with newly developed macular disease. Ophthalmic Physiol Opt 24(4):327–333
28. Vujosevic S et al (2006) Diabetic macular edema: correlation between microperimetry and optical coherence tomography findings. Investig Ophthalmol Vis Sci 47(7):3044–3051