1211
Volume 63 134 Number 4, 2015
http://dx.doi.org/10.11118/actaun201563041211
CHANGES OF SOIL AGGREGATE
STABILITY AS A RESULT OF THE EFFECT
OF FREEZE-THAW CYCLES
Aneta Žabenská
1, Miroslav Dumbrovský
11 Institute of Landscape Water Management, Faculty of Civil Engineering, Brno University of Technology, Žižkova 17, 602 00 Brno, Czech Republic
Abstract
ŽABENSKÁ ANETA, DUMBROVSKÝ MIROSLAV. 2015. Changes of Soil Aggregate Stability as a Result of the Eff ect of Freeze-thaw Cycles. Acta Universitatis Agriculturae et Silviculturae Mendelianae Brunensis, 63(4): 1211–1218.
The objective of the present research was to assess the changes in soil erodibility during the non-vegetation period as one of the factors aff ecting the snowmelt erosion. The temperature fl uctuation was simulated with the use of a climatic chamber ex situ. The soil surface was for simplicity reasons considered without any plant or snow cover. The paper deals with the rate of soil erodibility determination – the soil erodibility should increase due to the decrease of soil aggregate stability depending on the number of freeze-thaw cycles and initial soil moisture. Soil samples (taken from three sites) were subjected to freeze-thaw cycles under laboratory conditions. Changes in soil agreggate stability were monitored as one of the main soil characteristics which determine the soil erodibility. Two methods were used to determine the soil macroaggregate stability (soil aggregate fraction 1–2 mm): standard single-sieve method of wet sieving (Kemper and Rosenau, 1986), and dry aggregate analysis using a set of fl at sieves with a diameter of 1 mm and 0.5 mm. The results of each method are controversial. Intended hypothesis has not been clearly confi rmed.
Keywords: cryopedology, snowmelt erosion, erodibility, soil aggregate stability, freeze-thaw cycle
INTRODUCTION
Erosion is a complex process involving disruption of the soil surface, and transport and sedimentation of loose soil particles by water, wind, ice and other factors (Janeček et al., 2012). Although water erosion is now more and more discussed, snowmelt erosion is rarely mentioned in the Czech Republic (CZ). As a result of the snowmelt, a surface runoff occurs with devastating consequences. Even a small amount of the surface runoff is dangerous due to the specifi c soil conditions during cold periods and lack of vegetation cover. Snowmelt erosion plays a signifi cant role in some specifi c areas. Locations with heavy snow cover with the risk of sudden melting are the most endangered (Pokladníková and Šťastná, 2006). The ignorance of the issue under Czech conditions limits, however, its solution. Representatives of the Nordic countries, where the problem occurs in the largest extent, have the deepest knowledge of this type of erosion.
1212 Aneta Žabenská, Miroslav Dumbrovský
aggregates and creates small ice crystals around them; these destruct partially during their creation the soil aggregates. Many high-quality soil particles are therefore broken with the arrival of melting (Malenová and Toman, 2005).
MATERIALS AND METHODS
Soil samples for the examination in ex situ were taken at three sites: Luká (altitude 512 m.a.s.l.) (Fig. 1), Bystřice nad Pernštejnem (altitude 564 m.a.s.l.) (Fig. 2) and Koclířov (altitude 525 m.a.s.l.) (Fig. 3). The fi rst sampling was carried out a er the melting1: Soil sampling in the cadastral area Luká 23 April 2013 and 31 July 2013
of snowpack at the end of April 2013, and summer sampling at the end of July 2013, before harvesting. The winter oilseed rape, which is the only sparse coverage of the soil surface during the winter period, was sown at all sites.
The spring sampling was rather late due to the long duration of snow cover. Sampling depth was chosen as small as possible. Only the topsoil without vegetation cover to a depth of 2.5 cm was taken.
Soil Properties (Texture)
All three sites had medium-weight loamy soils. Luká
Main soil unit (MSU) 26: Modal cambisol, eubasic and mesobasic on the shale, mostly medium
soils, medium skeletal, with favorable moisture conditions.
Bystřice nad Pernštejnem
MSU 29: Modal cambisol, eubasic to mesobasic, gleyed soils including weakly gleyed varieties, on the gneisses, mica schists, phyllites or granites, medium soils to lighter medium, without skeleton to medium skeletal, with prevailing good moisture conditions.
Koclířov
HPJ 25: Modal leached cambisol, eubasic to mesobasic, exceptionally also pelic cambisol on marl and hard marlite, medium fl ysh, Permian Carboniferous, medium to medium skeletal, soils with good water capacity.
3: Soil sampling in the cadastral area Koclířov 26 April 2013 and 31 July 2013
Luká BystƎice KoclíƎov
2 100 2 100 2 100
1.4 98.85081 1.4 98.51777 1.4 99.9
1 96.57258 1 94.82234 1 99
0.71 94.35484 0.71 88.62944 0.71 98
0.09 73.10484 0.0577 66.33294 0.09 96
0.0653 72.05671 0.0405 65.04579 0.0499 81.18873 0.0478 65.56576 0.0302 61.18436 0.0367 76.57086
0.0348 59.7239 0.0206 54.10507 0.0279 68.6466
0.0177 51.93476 0.0129 52.81793 0.0148 56.11238 0.014 37.65466 0.0078 33.51078 0.0119 42.25878 0.0084 28.56733 0.0049 28.96781 0.0072 33.02304 0.0053 20.77819 0.0032 26.70959 0.0045 25.76639 0.0034 14.28723 0.0023 23.17566 0.0029 20.48882 0 0016 8 808222 0 0015 18 06506 0 0023 17 85004
0 10 20 30 40 50 60 70 80 90 100
0.001 0.01
0.1 1
10
Con
ten
t of
p
article size
fr
action [%
]
Particle size [mm]
Luká BystĜice KoclíĜov
1214 Aneta Žabenská, Miroslav Dumbrovský
Determination of Soil Aggregate Stability by Wet Sieving
Initial soil moisture content and aggregate stability were determined immediately a er sampling. Fraction of 1–2 mm has been separated with the use of a set of classic fl at screens a er air-drying of the sample (for 24 hours). Drying of aggregates before analysis should be done at room-temperature or the room-temperature representative of fi eld conditions. Oven-drying increases stability in otherwise unstable aggregates (Nimmo and Perkins, 2002). Scaling weight 4 g of thus prepared samples was subjected to a standard single-sieve method of wet sieving (Kemper and Rosenau, 1986). The samples were sieved in distilled water for 3 minutes with a frequency of 35 cycles/min and the vertical amplitude 1.3 cm, through a sieve with the mesh diameter 0.25 mm. The residue on the sieve was dried at 105 °C (for 6 hours), weighed and then dispersed and sieved 5 minutes in a solution of sodium polyphosphate, so that all the clay particles were washed out and only sand particles remained on the sieves. When the aggregates did not break apart even a er 5 minutes of sieving in solution, they were helped mechanically. The residue on the sieve (particle size of only about 0.25 mm) was dried and weighed.
Eff ort to prove the aggregate stability dependence on soil water content during the freezing led to the testing of two sets of samples – air-dried samples (24 h) and samples with initial water content. Sets of samples from each site were placed in closed plastic boxes and subjected to a several freeze-thaw cycles. Each sample was prepared in a triplicate. There was an eff ort to reproduce natural conditions when choosing the characteristics of a freeze-thaw cycle. Duration of one cycle was set at 24 hours. Samples were subjected to the temperature of −5 °C for 12 hours and to the temperature of +5 °C for another 12 hours. Changes in aggregate stability were determined a er 4, 5, 6, 7 and 24-hour cycles. Samples were dried, the 1–2 mm fraction was separated and the aggregate analysis using the wet sieving was carried out a er several cycles. The result was the percentage of waterstable soil aggregates (Kandeler et al., 1996):
M2 − M3 SAS = 100 ×
W − (M3 − M1)
(1) SAS ...soil aggregate stability [%],
M1 ...weight of dish [g],
M2 ...weight of dish, waterstable aggregates and sand [g],
M3 ...weight of dish and sand [g], W ...sample weight [g].
Aggregate Analysis by Dry Multi-sieve Method Due to unsatisfactory results arising from the fi rst method chosen, the research was supplemented by an aggregate analysis using a set of standard
fl at sieves. The most consistent method (Chepil, 1962 in Kemper and Rosenau, 1986) using rotary sieves has been replaced by the use of fl at sieves with a suffi ciently small weighed portion. Soil aggregates, fraction 1–2 mm, were separated from the air-dried samples. 50 g weighed portions were subjected to the same number of frost cycles as in the case of wet sieving (0, 4, 5, 6, 7 and 24-hour cycles). Subsequently, the aggregates were sieved through a sieve with mesh diameter 1 and 0.5 mm for 5 minutes with horizontal amplitude 0.1 mm (López et al., 2007 in Kozlovsky Dufková, 2010). Thr percentage loss of stable macro-aggregates was determined by weighing residues on sieves. The residue on a 1 mm-sieve was re-exposed to other freeze-thaw cycles. The aggregate analysis by dry sieving is, unlike the wet sieving, a non-destructive method. The Soil sample of an initial weight 50 g is thus repeatedly sieved a er a certain amount of freeze-thaw cycles. During the wet sieving analysis, the soil sample is destroyed, and a duplicate is therefore necessary for each analysis. The result was the percentage of dry-stable soil aggregates SAS *:
SA SAS* = 100 ×
SA + NA (2)
SAS* ...soil aggregate stability [%], SA ...weight of stable aggregates [g], NA ...weight of unstable aggregates [g].
RESULTS
The sampling areas were situated on medium-weight loamy cambisols. The resulting values of proportional content of water-stable macro-aggregates (determined by wet sieving) are presented in the following graphs.
Simple linear regression analysis did not give signifi cant correlations. There is a clear diff erence between values of SAS in spring and summer soil samples. The increase of aggregate stability during the vegetation period is well-known fact. Nevertheless, the correlation coeffi cient for SAS and number of FT cycles varied only from −0.14 to −0.47 in case of Luká sampling site.
The trend in the case of samples from Bystřice locality is rather opposite. SAS increased with few FT cycles and then started to decrease, as Mostaghimi (1988) describes it. The correlation coeffi cient for SAS and number of FT cycles varied from – 0.08 to 0.77.
0 32.7586207 85.0232198 32.7586207 85.0232198 4 15.6839444 69.2175377 23.1632627 53.6799924 5 12.9418159 58.6242391 22.0689373 57.5969423 6 21.8361708 71.0596796 24.1971659 60.2881894 7 18.7649195 67.8823432 30.0624757 62.7297851
10 15 20 25 30 35 40 45 50 55 60 65 70 75 80 85 90
0 1 2 3 4 5 6 7
SA
S [
%
]
number of freeze-thaw cycles L / w = 20% / 1. sampling
L / air-dried / 1. sampling L / w = 2% / 2. sampling L / air-dried / 2. sampling
5: The mean content of water-stable macro-aggregates (Luká)
0 35.1724 0 35.1724 0 83.7719 0 83.7719
4 16.835 4 22.7758 4 60.8889 4 54.8936
5 12.5 5 21.831 5 92.3077 5 58.8679
6 19.4539 6 24.055 6 68.0934 6 77.1863
7 20 7 27.972 7 69.3878 7 58.3658
0 30.3448 0 30.3448 0 86.2745 0 86.2745
4 14.5329 4 23.5507 4 71.0438 4 60.8365
5 12.9693 5 21.3793 5 57.7689 5 58.3673
y = -1.96x + 72.46 R² = 0.22 y = -1.31x + 75.39
R² = 0.10 0
20 40 60 80 100
0 1 2 3 4 5 6 7
SAS [
%
]
number of freeze-thaw cycles
Summer sampling air-dried
w = 2 % y = -0.28x + 27.78
R² = 0.02
y = -1.37x + 24.70 R² = 0.19 0
10 20 30 40
0 1 2 3 4 5 6 7
SAS [
%
]
number of freeze-thaw cycles
Spring sampling air-dried
w = 20 %
6: Plot of soil aggregate stability and number of freeze-thaw (FT) cycles (Luká)
0 12.447446 40.5725511 12.447446 40.5725511 4 11.6340208 41.1710418 34.7846564 40.5713914 5 13.6706976 30.7240588 46.056962 51.4307039 6 30.0485437 37.4979302 44.8476908 47.6724127 7 28.0099971 44.298017 37.6385211 46.9079569
10 15 20 25 30 35 40 45 50 55
0 1 2 3 4 5 6 7
SA
S [
%
]
number of freeze-thaw cycles
B / w = 30% / 1. sampling B / air-dried / 1. sampling B / w = 18% / 2. sampling B / air-dried / 2. sampling
7: The mean content of water-stable macro-aggregates (Bystřice)
0 10.4418 0 10.4418 0 50.8621 0 50.8621
4 18.2186 4 29.4416 4 7.79221 4 42.5641
5 13.6364 5 46.087 5 32.5688 5 52.9954
6 20.7254 6 57.2816 6 34.0426 6 46.9565
7 22.9167 7 37.619 7 42.9864 7 47.2973
0 29.3436 0 29.3436 0 43.5345 0 43.5345
4 12.3894 4 35.0515 4 41.0377 4 54.3269
5 12 2363 5 47 6395 5 28 8793 5 52 1739
y = 0.60x + 44.41 R² = 0.09 y = -0.33x + 39.57
R² = 0.01 0
20 40 60
0 1 2 3 4 5 6 7
SA
S [%
]
number of freeze-thaw cycles
Summer sampling air-dried
w = 18 % y = 3.81x + 20.01
R² = 0.59 y = 1.19x + 14.55
R² = 0.15
0 20 40 60 80
0 1 2 3 4 5 6 7
SAS [
%
]
number of freeze-thaw cycles
Spring sampling air-dried
w = 30 %
1216 Aneta Žabenská, Miroslav Dumbrovský
Percentage of water-stable macro-aggregates fraction 1–2 mm determined by dry sieving is presented in the following graphs.
0 61.0834851 55.3191767 61.0834851 55.3191767 4 50.5717837 50.1084209 46.6089455 59.603343 5 52.8255529 56.0568087 40.7243532 57.6819089 6 57.6210447 43.5820896 38.4538394 53.0514242 7 44.4387766 43.7201205 40.5921102 51.2963472
35 40 45 50 55 60 65
0 1 2 3 4 5 6 7
SA
S [
%
]
number of freeze-thaw cycles K / w = 10% / 1. sampling
K / air-dried / 1. sampling K / w = 12% / 2. sampling K / air-dried / 2. sampling
9: The mean content of water-stable macro-aggregates (Koclířov)
0 49.1573 0 49.1573 0 64.6552 0 64.6552 4 54.3662 4 59.7734 4 47.5758 4 59.824 5 52.6912 5 43.8547 5 57.1429 5 57.8788 6 57.9387 6 37.6812 6 61.5854 6 48.2249 7 44.2577 7 30.7479 7 52.5641 7 48.8166
0 60.7345 0 60.7345 0 54.519 0 54.519
4 47.2067 4 46.1756 4 52.2936 4 58.631 5 48.5632 5 38.4831 5 47.1976 5 57.485
y = -1.17x + 60.20 R² = 0.29 y = -1.53x + 58.30
R² = 0.32 0
20 40 60 80
0 1 2 3 4 5 6 7
SA
S [%
]
number of freeze-thaw cycles
Summer sampling air - dried
w = 12 %
y = -2.88x + 58.16 R² = 0.62 y = -1.19x + 57.41
R² = 0.26 0
20 40 60 80
0 1 2 3 4 5 6 7
SAS [
%
]
number of freeze-thaw cycles
Spring sampling air-dried
w = 10 %
10: Plot of soil aggregate stability and number of FT cycles (Koclířov)
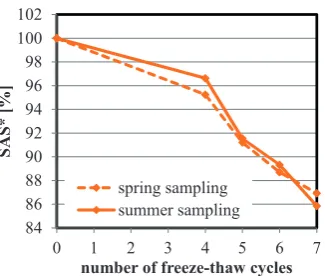
0 100 4 96.46 5 94.64 6 93.43333333 7 92.25333333 0 100 4 96.56 5 94.22 6 92.84 7 91.78 91 92 93 94 95 96 97 98 99 100 101
0 1 2 3 4 5 6 7
SA
S* [
%
]
number of freeze-thaw cycles spring sampling summer sampling
11: Percentage of stable macro-aggregates (Luká)
0 100 4 96.46 5 94.64 6 93.43333333 7 92.25333333 0 100
y = -1.11x + 100.25 R² = 0.98 y = -1.20x + 100.34
R² = 0.97
90 92 94 96 98 100 102
0 1 2 3 4 5 6 7
SAS*
[
%
]
number of freeze-thaw cycles spring sampling summer sampling
12: Plot of dry soil aggregate stability and number of FT cycles (Luká)
0 100 4 94.9 5 92.87 6 91.75 7 90.76 0 100 4 95.05333333 5 93.42666667 6 92.1 7 91.16 90 92 94 96 98 100 102
0 1 2 3 4 5 6 7
SA
S* [
%
]
number of freeze-thaw cycles
spring sampling summer sampling
13: Percentage of stable macro-aggregates (Bystřice)
0 100 4 94.9 5 92.87 6 91.75 7 90.76 0 100
y = -1.35x + 100.00 R² = 0.99 y = -1.29x + 100.01
R² = 1.00
90 95 100 105
0 1 2 3 4 5 6 7
SAS*
[
%
]
number of freeze-thaw cycles spring sampling summer sampling
DISCUSSION
Although the hypothesis of decreasing the aggregate stability during an increased number of freeze-thaw cycles was not confi rmed by the wet sieving method, there is an evident dependence of aggregate stability on soil moisture (Fig. 5) and on the sampling time (Fig. 6). The amount of water-stable aggregates variably decreased or unexpectedly increased with the increasing number of freeze-thaw cycles (Fig. 5, Fig. 7, Fig. 9). According to Lehrsch (1997), the aggregate stability increased with a few freeze-thaw cycles, but additional FT cycles have little eff ect. Freeze – drying also reported to an increased aggregate stability (Oygarden, 2000). Mostaghimi (1988) found that the rate of freezing had no eff ect on aggregate stability. Small fl uctuation of values may indicate inaccuracies in measurements and very
small changes of SAS due to the freeze-thaw cycles. The dependence of SAS on the time of sampling can be seen especially at the samples from the localities Luká and Bystřice (Fig. 13, Fig. 15). Soil samples taken in summer show a signifi cantly higher SAS, unlike the samples taken during the spring thaw. It is obvious that SAS decreases during the winter and then increases during the vegetation period. Based on the measured results it can be assumed that the simulated conditions were not appropriately chosen. Although the results of the dry sieving method are represented by the same parameter (SAS) as in the case of the wet sieving method, methods cannot be compared. The dry sieving was chosen only as a supplementary method and proves the continuous trend of the decreasing amount of stable macro-aggregates SAS* due to the increasing number of freeze-thaw cycles.
0 100
4 95.24
5 91.20666667
6 88.7
7 86.92
0 100
4 96.63
5 91.54
6 89.32
7 85.85
84 86 88 90 92 94 96 98 100 102
0 1 2 3 4 5 6 7
SA
S* [
%
]
number of freeze-thaw cycles spring sampling summer sampling
15: Percentage of stable macro-aggregates (Koclířov)
0 100
4 95.24
5 91.20666667
6 88.7
7 86.92
0 100
y = -1.90x + 100.77 R² = 0.95 y = -1.97x + 101.35
R² = 0.88
85 90 95 100 105
0 1 2 3 4 5 6 7
SAS*
[
%
]
number of freeze-thaw cycles spring sampling summer sampling
16: Plot of dry soil aggregate stability and number of FT cycles (Koclířov)
CONCLUSION
The paper deals with the assessment of the impact of cryopedological eff ects on soil erodibility as one of the causative factors of snowmelt erosion. The soil aggregate stability is one of the main soil characteristics which determine the rate of erodibility. SAS changes depending on the temperature and humidity changes were monitored ex situ. 24-hour freeze-thaw cycles (−5 °C for 12 hours and 5 °C for next 12 hours) were simulated in a climatic chamber. The percentage of stable soil aggregates was determined a er the sampling, and subsequently a er running 4, 5, 6 and 7 freeze-thaw cycles. The dependence of SAS (Soil Aggregate Stability) on cryopedological phenomena is a controversial topic in foreign literature. Although many authors agree that aggregate stability decreases due to the repeated freezing and thawing of the soil, this hypothesis has not been proven. The results indicate a clear increase in SAS during the growing season. However, SAS did not change signifi cantly as a result of cryopedological phenomena simulated in laboratory conditions. The results of multi-sieve aggregate analysis point to a steady decreasing trend of SAS (water-stable aggregates) due to the increasing number of freeze-thaw cycles. Nor the SAS* (air-stable aggregates) has decreases signifi cantly. With regard to time-consuming changes of soil characteristics, it can be assumed that the duration of freeze-thaw cycles has not been appropriately chosen. There is a possibility of a further research in the cryopedological phenomena, but it is probably desirable to consider some changes in methodology (into account comes change of cycle duration, number of cycles or the temperatures).
Acknowledgement
1218 Aneta Žabenská, Miroslav Dumbrovský
REFERENCES
JANEČEK, M. et al. 2012. Erosion control of agricultural land [in Czech: Ochrana zemědělské půdy před erozí]. 1st edition. Praha: Powerprint.
KANDELER, E., SCHINNER, F., OHLINGER, R and MARGESIN, R. 1996. Methods in Soil Biology. Heidelberg: SPringer-Verlag Berlin Heidelberg New York.
KEMPER, W. D. and ROSENAU, R. C. 1986. Methods of soil analysis, Part 1. Physical and Mineralogical methods. 2nd edition. Madison: American society of Agronomy – Soil Science Society of America. KOZLOVSKY DUFKOVÁ, J. 2010. Criteria of wind
erosion on heavy soils in the foothills of the White Carpathians [in Czech: Kritéria rozvoje větrné eroze na těžkých půdách v podhůří Bílých Karpat]. Brno: Mendel University in Brno.
KVÆRNØ, S. H. and ØYGARDEN, L. 2006. The infl uence of freeze-thaw cycles and soil moisture on aggregate stability of three soils in Norway. Catena, 67: 75–182.
LEHRSCH, G. A. 1997. Aggregate stability response to freeze-thaw cycles. In: Intl. Symposium on Physics, Chemistry, and Ecology of Seasonally Frozen Soils. 10. 6.– 12. 6. 1997. USA-AK-Fairbanks.
MALENOVÁ, P. and TOMAN, F. 2005. Impact of Snowthawing on endangered Range of Soil Erosion. [online]. Available at: http://mnet.mendelu.cz/ mendelnet2005/articles/enviro/malenova.pdf.
MOSTAGHIMI, S., YOUNG, R. A., WILTTS, A. R. and KENIME, A. L. 1988. Eff ects of frost action on soil aggregate stability. Trans. ASAE, 31(2): 435–439. NIMMO, J. R. and PERKINS, K. S. 2002. Aggregate
stability and size distribution. In: DANE, J. H., TOPP, G. C., Methods of soil analysis, Part 4 – Physical methods. Madison, Wisconsin: Soil Science Society of America, 317–328.
ØYGARDEN, L. 2000. Monitoring of soil erosion in small agricultural catchments, south – eastern Norway. Doctor Scientarium Theses 2000:8. Ås: Centre for Soil and Environmental Research.
OZTAS, T. and FAYETORBAY, F. 2003. Eff ect of freezing and thawing processes on soil aggregate stability. Catena, 52: 1–8.
POKLADNÍKOVÁ, H. and ŠŤASTNÁ, M. 2006. Intensity of Soil Erosion in Spring Period in Chosen Areas of Moravia. In: Bioklimatológia a voda v krajine. 11. 9.–14. 9. 2006. Strečno. Available at: http://cbks.cz/sbornikStrecno06/prispevky/ PosterII_clanky/P2-4.pdf.
TOMAN, F. and PODHRÁZSKÁ, J. 2002. The Infl uence of climatic Conditions on Snowmelt Erosion Initiation. [in Czech: Vliv klimatických podmínek na vznik eroze způsobené táním sněhu]. In: XIV. Česko-slovenská bioklimatologická conference. 2. 9.–4. 9. 2002. Lednice na Moravě.
Contact information Aneta Žabenská: [email protected]