6
The Different Of Rural And Urban Migration In
East Java
Arbain Agus WijayaAbstract: This paper aims to analyze the determinants of migration that occur in rural populations and urban residents in East Java Province. This study uses longitudinal data from the Indonesian Family Life Survey (IFLS) 4 and 5. Independent variables are individual socio-economic factors taken from IFLS 4 data and the dependent variable is migration taken from IFLS data 5. The result found that migration in Rural residents in East Java Province are influenced by individual socio-economic factors, namely age, marital status, education, land ownership, health insurance ownership. While variables that do not have a significant effect on rural migration are family size, gender, loan ownership, and poverty status. Then migration to urban residents in East Java Province is influenced by individual socio-economic factors, namely age, marital status, family size, land ownership, health insurance ownership. While variables that did not significantly influence urban migration were gender, education, loan ownership, and poverty status.
Keyword: Migration, Individual socio-economic factors, Rural, Urban, IFLS
————————————————————
1
I
NTRODUCTIONStarting from the "migration" of residents who have the same dream, namely to improve the quality of life by meeting the needs of clothing, food, and shelter. However, various migration theories say that migration seems to only occur in rural populations who migrate to cities even though urban residents also have dreams to improve their quality of life. For rural residents who migrate to cities have reasons to fulfill basic needs that will automatically encourage migration to centers of economic growth. Uncontrolled migration will cause problems such as poverty, backwardness, congested settlements, and congestion. The existence of these poverty problems requires the government to make various efforts in equitable development. But what happened was the opposite that development was not evenly distributed in every region in Indonesia. In 2015, Indonesia's GDP distribution was dominated by provinces in Java with a contribution of 58.29%, followed by provinces in Sumatra at 22.21%, Kalimantan Island at 8.15%, Sulawesi Island at 5.29% and the rest by other islands (BPS, 2017). On the one hand, the spread of the population of Indonesia is also still concentrated in Java, even though the geographical area of Java is smaller than Sulawesi Island, Kalimantan Island, Papua Island and Sumatra Island. The rapid growth of the population with uneven distribution, coupled with uneven development reflected by the disparity in economic growth and income disparity between regions in Indonesia can trigger population mobility from less developed regions to better development areas. The rapid economic growth in big cities, made most of the population motivated to do mobility to the larger city. In the destination city there are greater employment opportunities with various types of work. From an economic standpoint, those who carry out mobility expect a more decent life with income greater than in the area of origin as well as the availability of more adequate facilities and infrastructure in the destination.
In addition, there are also public facilities provided by the government such as education, health and roads, which also still excel in urban areas. In reality, not necessarily regions that have high income can attract residents to migrate to the area. The attractiveness of large provinces in Java is still very large even if it is seen from GDP per capita that only DKI Jakarta Province has a high GDP per capita, while other provinces in Java Island per capita GRDP is still below the per capita GRDP of East Kalimantan and Riau Province. West Java Province is the most important destination for migrants in 2015, not the province with the highest per capita GRDP. The highest per capita GRDP is owned by provinces in Java, namely DKI Jakarta Province, around Rp. 142,892,190, followed by East Kalimantan Province in the amount of Rp. 128,594,760, Riau Province Rp. 70,769,780, and finally the East Nusa Tenggara Province of Rp. 11,099,850 (BPS, 2017). Then the highest number of migrations was West Java Province, which amounted to 42,378,333 people, followed by East Java Province with 36,079,682 people, and the lowest migration was in North Kalimantan Province with 555,673 people. When viewed from the condition of poverty in Indonesia, the poor live more in rural areas than in urban areas. BPS in March 2015 then noted the number of poor people living in rural areas reached 17.94 million or 14.21 percent of the total population of Indonesia. While the poor who live in urban areas, in March 2015 reached 10.65 million people, or more than half of the total rural poor (BPS, 2015). Comparisons that show considerable differences regarding the poverty situation in rural and urban areas. The comparison of the number of poor and migrant people between provinces in Java, the poorest people are in East Java Province with 4,775,970 people. Though the majority of migrants are in West Java Province, which is 4,485,650 people. The highest number of poor people in East Java Province, but the smaller number of migrants from West Java Province, is an ironic fact. This is in line with the explanation from Hampshire (2002) which states that very poor people may indeed make their last choice migration when alternatives to escape from other poverty status fail. Poor migrants have finally managed to get out of poverty after migration in other words that solutions to get out of poverty can be achieved through migration. Thus, the number of poor people in East Java Province must be positively correlated with the number of migrations. When viewed from regional characteristics, according to Bappenas and BPS (2015), the number of villages in all islands in Indonesia is 74,093 villages. The island which has the largest ________________________________
7 number of villages is in the Java-Bali region as many as
23,117 villages. Then from the provinces in Java-Bali, the highest number of disadvantaged villages is found in East Java Province, which is equivalent to 208 villages and Banten Province with 158 villages. Villages that are left behind are villages that have the availability and access to basic services, infrastructure, accessibility / transportation, public services, and government administration which is still minimal. A large number of disadvantaged villages in East Java will be able to encourage increased migration as an effort to secure the livelihoods of rural residents and to adapt to the rapidly changing economic environment (Syafitri, 2013). But in reality, the number of East Java's population migration is less than the total population migration in West Java, which when viewed from the region, the number of disadvantaged villages in West Java Province is less than in East Java Province which is equivalent to 97 villages. One of the individual factors that can affect migration is loan ownership. In some studies, it was shown that loan ownership can affect migration positively and negatively. Loan ownership can encourage someone to migrate because the salary to be obtained is expected to be used to repay the loan (Duffy-tumasz, 2009). Furthermore, Stoll (2010) argues that loans can be a "driving force" for migration. Agreeing to that, Taylor (2011) suggests that loans can be forced, with "debt drivers" functioning as the main motivation for migration. Conversely, loan ownership has a negative relationship with migration (Syafitri, 2013). By utilizing a loan, a person can be more productive in his own area without having to migrate. As an effort from the government to solve the problem of development inequality and poverty, policies have been made, namely through the expansion of financial institutions that provide many facilities in providing loans and are expected to provide economic solutions to residents in various regions. Loans can be a substitute solution for migration because greater access to financial services can stop migration from places that are deemed less developed to be better economically. Lending, especially in less developed places, the most suitable, of course, is micro loans. This is in line with the government's expectations, namely the existence of easy and soft loan programs that can grow micro-enterprises that are considered stronger if faced with a deteriorating economic situation, such as the 1998 economic crisis. In fact, large loan ownership may not necessarily reduce migration. The highest number of micro loans is in the DKI Jakarta Province followed by East Java Province. Then when viewed from the comparison of loans and migration, especially in the provinces of Central Java and East Java Province, it is seen that the number of loans in Central Java Province is less than in the East Java Province, which is 93,874,600 million rupiahs and 109,318,300 million rupiah respectively. On the one hand, the population migration of East Java Province is still more than the population migration in Central Java Province which is 36,079,682 and 31,151,564 people. This is not in line with the government's expectation that the existence of a loan will be able to support equitable development so that the number of people migrating does not increase from year to year. In addition to loan ownership factors, there are several other factors related to individual factors that can influence a person's decision to migrate or not. In the interconnection between marriage and migration, the two events are related to each other. Married or unmarried status can affect the tendency to migrate. Mulder and Wagner (1993) suggest that a marriage often triggers
migration (eg migration with family members). The existence of health insurance can also affect individuals to migrate. If individuals do not have health insurance, these individuals tend to migrate ((Paulson, 2000; Hagen-zanker, 2008; Millán, 2015). Then, land ownership can also affect migration. Decreasing land ownership by farmers increases the possibility of migration ((Gray, 2011; Bednarikova, Bavorov, and Ponkina, 2016). Land ownership leads to increased production, providing jobs and livelihoods for rural residents so that residents feel they do not need to migrate. In addition, high education will influence the mindset of individuals to migrate because of the "lure" of better income in more developed areas ((Muthmainnah and Budyandra, 2016; Hutomo, 2015; Pangaribuan and Handayani, 2013). This research focuses on the socio-economic factors of individuals that can influence migration, which can be seen from the classification of housing both rural and urban. Are there differences in patterns of migration between rural and urban areas so that the policies taken can be more appropriate.
2
L
ITERATURR
EVIEWMigration in a demographic context is one of the causes of social change that can have a huge influence on determining population policy. Population dynamics that occur due to the dynamics of birth, death, and displacement (migration) to changes in the amount of composition and population growth (Pratama, 2013). Large population growth is followed by uneven distribution between regions and economies that tend to be concentrated in urban areas encourage people to migrate. The migration of people to cities is influenced by various factors. According to Purnomo (2004) the factor that drives most people to migrate to cities is because cities have larger jobs of various types, there are more adequate facilities, and in terms of economics, those who migrate expect a decent life with get higher income than in the area of origin. Tjiptoherijanto (1999) states that in a broad sense the migration is a permanent or semi-permanent change in residence. In this broad sense, the distance between the displacement and the nature of the displacement is not a limitation, and the difference between domestic and foreign migration is also not a limitation. The strong ties of membership to large families in the village and to rural communities can make the village go back and forth to an attractive proportion. The demands made by migrants on urban systems vary greatly according to their future plans. Unmarried migrants hope not too much. Many migrants are truly aware of their aspirations to retire in the village. They believe as long as they act on their own assumptions, one day they will settle in their hometown. So migration can occur in rural and urban populations. The classification of rural and urban villages according to BPS (2010) is as follows:
- Urban areas, are an administrative area at the village / kelurahan level that meets certain requirements in terms of population density, percentage of agricultural households, and a number of urban facilities, formal education facilities, public health facilities, and so on. - Rural areas, are administrative areas at the village /
8 The classification above uses 3 (three) indicators as a
measure, namely: population density per km2 (KPD), percentage of agricultural households (PRT), and existence or access to reach urban facilities (AFU). Based on 3 (three) indicators it is known that a village can achieve a maximum score of 26 and can achieve a minimum score of magnitude 2. While the cut-off point is used for determining the size of urban villages 10. So that villages that have a total score of 10 or more is designated as an urban village, whereas villages with a total score of less than 10 are designated as rural villages. The root cause of rural-urban migration is not only the difference in wages but also as a result of poorly functioning capital markets in rural areas. Even with regard to differences in wages, the Todaro model only explains wage differences between sectors while intra-sectoral wage differences (such as inter-industry wage differences) are not specifically considered in the model ((Beladi and Naqvi, 1988). As stated in the works of Katz and Stark in Wondimagegnhu (2012), migration can occur even when the expected income of the city is below rural income, which is clearly inconsistent with the income difference approach described by the Todaro model. According to Katz and Stark, migrants can make rational decisions to migrate to urban areas if the return on investment in rural areas increases with the level of productive investment regardless of the expected differential wage analysis. This is because the assumption that getting a little extra remittance from urban work can facilitate profitable investment in rural areas even with lower wage income.
3
R
ESEARCHM
ETHODOLOGYThis study uses descriptive analysis method with a quantitative approach. The scope of this research area is in the East Java Province, which is one of the largest provinces in Indonesia. To obtain the data and information needed, the study was conducted by secondary data collection through the Indonesian Family Life Survey (IFLS). For the dependent variable using migration data on IFLS 5 while the independent variables use data from IFLS 4. These independent variables include age, gender, marital status, family size, education, land ownership, health insurance ownership, loan ownership, and poverty status. After going through the data synchronization process obtained a total sample of 2994 individuals, of which 1644 individuals were rural residents and 1350 individuals from urban residents. The data used include variables that describe the individual socio-economic factors associated with migration.
4
R
ESULT4.1. Deskription Analysis from Overall Data
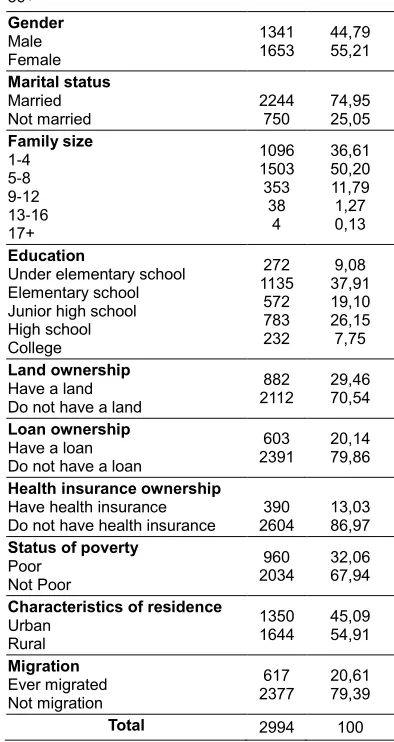
In this section we will explain the data description of the dependent variable and the independent variables used in this study. From the total sample of 2994 individuals in East Java Province, the overall data description is obtained as in the following table:
Table 1 Overall Sample Distribution
Variable N %
Age 15-25 26-35 36-45 46-55
780 768 681 456 309
26,05 25,65 22,75 15,23 10,32
56+ Gender Male Female
1341 1653
44,79 55,21
Marital status Married Not married
2244 750
74,95 25,05 Family size
1-4 5-8 9-12 13-16 17+
1096 1503 353
38 4
36,61 50,20 11,79 1,27 0,13
Education
Under elementary school Elementary school Junior high school High school College
272 1135
572 783 232
9,08 37,91 19,10 26,15 7,75
Land ownership Have a land Do not have a land
882 2112
29,46 70,54
Loan ownership Have a loan Do not have a loan
603
2391 20,14 79,86
Health insurance ownership Have health insurance Do not have health insurance
390 2604
13,03 86,97 Status of poverty
Poor Not Poor
960 2034
32,06 67,94
Characteristics of residence Urban
Rural
1350 1644
45,09 54,91
Migration Ever migrated Not migration
617 2377
20,61 79,39
Total 2994 100
9 samples migrating is 20.61%. In addition, in table 2 shows that
from the total sample of 2994 individuals divided into 1644 individuals as rural residents with a percentage of 54.91% and 1350 individuals as urban residents with a percentage of 45.09%.
4.1. Rural and Urban Deskription Analysis
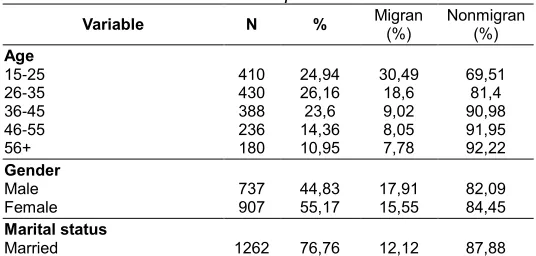
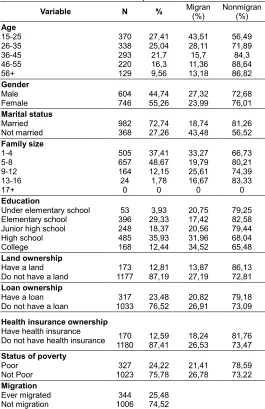
In the following sub-section, a description of the data analysis according to the area of origin with the dependent variable is explained, namely migration in rural populations and migration to urban residents. If seen from table 2, based on the age variable the percentage of the total population of rural population is in the age group 26-35 years which is equal to 26.16%. After that, the age group of 15-25 years is followed by only 1.22%, which is 24.94%. Then the least are in the age group 56 and above, which is 10.95%. This illustrates that in the rural population there are many young people who are still productive. If it is associated with migration, the rural population who make the most migration is in the age group 15-25 years and then followed by the age group 26-35 years after that followed by other age groups in sequence. The largest percentage of migration is 30.49% and the smallest is 7.78% in the age group 15-25 years and 56+ years, respectively. This indicates that the rural population tends to migrate when they are young and still productive. But with increasing age, the chances of people migrating tend to decrease. Next, in table 3, the percentage of the urban population with the largest migration is in the age group of 15-25 years which is equal to 27.41%. Then in sequence, in urban areas the greater the age the smaller the percentage of the population. So the percentage of the smallest population in the 56+ year age group is 9.56%. The pattern of migration to urban residents based on age. In general, it can be seen that migration in urban populations experiences a negative tendency, namely the greater the age, the smaller the number of people who migrate. The largest percentage of migration occurs in the age group of 15-25 years which is equal to 43.51%. The difference in migration that occurs in urban residents and rural populations is in the urban population age group 56+ years, migration which has increased 1.82% from the previous age group. Based on gender, the population of East Java Province originating from rural areas is mostly female, that is equal to 55.17%. While the rest are residents who are male, that is equal to 44.83%. In rural populations, migration is mostly carried out by residents who are male, that is equal to 17.91% while the female population is only 15.55%. This is in line with the research conducted by Chindarkar (2012), Hofman (2014), and Richter (2006) that gender can influence migration, the possibility of a man to migrate tends to be greater than a woman. Furthermore, the percentage of the urban population migrating by sex as well as in rural areas, the largest number of urban population is female population. The percentage of female population is 55.26% and men are 44.74%. Migration in urban populations also occurs in the population of male sex at 27.32%. A man tends to migrate when compared to a woman. When compared between the two, namely between the rural population and urban population, it can be seen that the urban population has a greater percentage of migrants than the rural population, both male and female. Based on marital status, the rural population with married status has a greater percentage than the rural population who is not married. The percentage of the population who are married is 76.76% and those who are not
married are 23.24%. If seen from the relationship between migration and marital status, the percentage of migration in rural populations is greater in the population who are not married, which is 31.41%. This is contrary to the research hypothesis that the percentage of married people to migrate is greater than the population who are not married. In the urban population, the percentage of married population is also higher than the unmarried population of 72.74% compared to 27.26%. While migration occurs mostly in residents who are not married, that is equal to 43.48%. When compared to the status of marriage, migration occurring in urban populations is greater than migration in rural populations. Then a description of migration when viewed based on family size in rural populations. The largest percentage of rural population in the family size group is 5-8 people which is 51.46%. In rural areas there are still people who have a family of more than 17 people with a percentage of 0.24%. As for migration, the family size of 1-4 people has the largest percentage of migration with a value of 17.09% and followed by another family size group with a negative tendency so the larger the family size the smaller the percentage of migrating. In the urban population, the largest percentage of family size is also found in the family size group of 5-8 people with a value of 48.67%. In contrast to rural areas, there are no families in urban areas with more than 17 family members. The migration that occurs is mostly done by residents who have a family size of 1-4 people which is 33.27%. Although the population with a family size of 5-8 people is the largest number, it turns out the migration is smaller than the migration that occurs in groups of family size 9-12 people. Next is a description based on education level. In the rural population, the largest percentage is at the elementary education level with a value of 44.95%. Then the lowest level of education in Higher Education is only 3.89%. Whereas the highest migration percentage was in rural populations with higher education level which was equal to 32.81% and the lowest was in elementary education level which was equal to 10.01% which was only slightly at odds with the level of education below elementary school which was 10.5%. So for the rural population the higher the level of education, the greater the tendency to migrate. Whereas in urban areas, the highest population is at the level of high school education which is equal to 35.93% and the lowest at the level of education below the elementary school that is equal to 3.93%. For migration, in line with the migration that occurs in rural populations, the largest percentage is in the education level of Higher Education with a value of 34.52%. This is consistent with the research hypothesis that the level of education has a positive relationship with migration. The higher the level of education, the more choices or opportunities to get jobs and higher income.
Table 2 Rural Sample Distribution
Variable N % Migran (%) Nonmigran (%)
Age 15-25 26-35 36-45 46-55 56+
410 430 388 236 180
24,94 26,16 23,6 14,36 10,95
30,49 18,6 9,02 8,05 7,78
69,51 81,4 90,98 91,95 92,22 Gender
Male Female
737 907
44,83 55,17
17,91 15,55
82,09 84,45 Marital status
10
Not married 382 23,24 31,41 68,59
Family size 1-4 5-8 9-12 13-16 17+ 591 846 189 14 4 35,95 51,46 11,5 0,85 0,24 17,09 16,55 16,4 7,14 0 82,91 83,45 83,6 92,86 100 Education
Under elementary school Elementary school Junior high school High school College 219 739 324 298 64 13,32 44,95 19,71 18,13 3,89 10,5 10,01 21,91 28,19 32,81 89,5 89,99 78,09 71,81 67,19 Land ownership
Have a land Do not have a land
709 935 43,13 56,87 12,69 19,57 87,31 80,43 Loan ownership
Have a loan
Do not have a loan 1356 286 17,4 82,6 17,48 16,42 82,52 83,58
Health insurance ownership Have health insurance
Do not have health insurance 1424 220 13,38 86,62 12,27 17,28 87,73 82,72
Status of poverty Poor Not Poor 633 1011 38,5 61,5 13,74 18,4 86,26 81,6 Migration Ever migrated Not migration 273 1371 16,61 83,39
From economic factors, if seen from land ownership, many rural people do not have agricultural land but the percentage value is not much different from the population that owns agricultural land, which is 56.87% and 43.13% respectively. While in urban areas, the population that owns agricultural land is only 12.81% and those who do not have agricultural land are 87.19%. If it is linked between land ownership and migration, rural residents and urban residents have similarities, namely those who do not have agricultural land tend to migrate. This is consistent with research conducted by Gray (2011), Bavorov and Ponkina (2016), and Tacoli (2002) that land ownership negatively influences migration. Then the next economic factor is the loan ownership factor. In both the rural population and the urban population, a large percentage is found in residents who do not have loans. The rural population has more loans, which is 82.6% than the urban population which is 76.52% and vice versa, the urban population has more loans than the rural population, which is 23.48% and 17.4%. Whereas the migration that occurs in rural populations is mostly carried out by residents who have loans, which is 17.48%. In contrast to the migration that occurs in urban residents that migration occurs mostly in residents who do not have a loan that is equal to 26.91%. Next, based on the ownership of health insurance, it can be seen that there are many rural residents who do not have health insurance with a percentage of 86.62%. This is not much different from the urban population which has a percentage of 87.41% for residents who have health insurance. Whereas for migration there is a similarity between the migration carried out by rural residents and urban residents that residents who do not have health insurance tend to have a greater percentage of migrants than residents who have health insurance. Based on poverty status, the poorer population is more in rural areas than in urban areas with a percentage value of 38.5% and 24.22% respectively. But if compared between poor and not poor, both in rural and urban areas, many residents are not
poor. Then if it is associated with migration, the population that is not poor in both rural and urban areas has the same percentage of migration which is greater than the percentage of migration in the population with poor status.
Table 3 Urban Sample Distribution
Variable N % Migran (%) Nonmigran (%)
Age 15-25 26-35 36-45 46-55 56+ 370 338 293 220 129 27,41 25,04 21,7 16,3 9,56 43,51 28,11 15,7 11,36 13,18 56,49 71,89 84,3 88,64 86,82 Gender Male Female 604 746 44,74 55,26 27,32 23,99 72,68 76,01 Marital status Married Not married 982 368 72,74 27,26 18,74 43,48 81,26 56,52 Family size 1-4 5-8 9-12 13-16 17+ 505 657 164 24 0 37,41 48,67 12,15 1,78 0 33,27 19,79 25,61 16,67 0 66,73 80,21 74,39 83,33 0 Education
Under elementary school Elementary school Junior high school High school College 53 396 248 485 168 3,93 29,33 18,37 35,93 12,44 20,75 17,42 20,56 31,96 34,52 79,25 82,58 79,44 68,04 65,48 Land ownership
Have a land Do not have a land
173 1177 12,81 87,19 13,87 27,19 86,13 72,81 Loan ownership
Have a loan Do not have a loan
317 1033 23,48 76,52 20,82 26,91 79,18 73,09
Health insurance ownership Have health insurance
Do not have health insurance 1180 170 12,59 87,41 18,24 26,53 81,76 73,47
Status of poverty Poor Not Poor 327 1023 24,22 75,78 21,41 26,78 78,59 73,22 Migration Ever migrated
Not migration 1006 344 25,48 74,52
11 which are not only limited to economic needs but also social,
cultural and psychological needs.
6
C
ONCLUSIONBased on the results of model estimation and data analysis performed, conclusions can be drawn as follows:
1. Migration in rural populations in East Java Province is influenced by individual socio-economic factors, namely age, marital status, education, land ownership, health insurance ownership. While variables that did not significantly influence migration were family size, gender, loan ownership, and poverty status.
2. Migration in urban residents in East Java Province is influenced by individual socio-economic factors, namely age, marital status, family size, land ownership, health insurance ownership. While variables that did not significantly influence migration were gender, education, loan ownership, and poverty status.
3. Migration does not only occur in rural populations who expect better employment and income in the city, but in its development today migration actually occurs more in urban populations than in rural populations. Individual social factors predominantly influence migration rather than individual economic factors. Residents expect more benefits in the destination area to meet various needs, both economic, social, cultural and psychological needs.
R
EFERENCES[1]. Bappenas dan BPS. 2015. ―Indek Pembangunan Desa 2014.‖ 88.
[2]. Bednarikova, Zuzana, Miroslava Bavorov, and Elena V Ponkina. 2016. ―Migration Motivation of Agriculturally Educated Rural Youth : The Case of Russian Siberia.‖ 45:99–111.
[3]. Beladi, Hamid and Nadeem Naqvi. 1988. ―Urban Unemployment And Non-Immiserizing Growth.‖ 28:365– 76.
[4]. BPS. 2010. ―Penduduk Indonesia.‖
[5]. BPS. 2017. ―Produk Domestik Regional Bruto Kabupaten/Kota Di Indonesia.‖
[6]. Duffy-tumasz, Amelia. 2009. ―Paying Back Comes First : Why Repayment Means More than Business in Rural Senegal Paying Back Comes First : Why Repayment Means More than Business in Rural Senegal.‖ (December 2014):37–41.
[7]. Gray, Clark L. 2011. ―Soil Quality and Human Migration in Kenya and Uganda.‖ Global Environmental Change 21(2):421–30.
[8]. Hagen-zanker, Jessica. 2008. ―Why Do People Migrate? A Review of the Theoretical Literature.‖ (28197).
[9]. Hampshire, Kate. 2002. ―Fulani on the Move : Seasonal Economic Migration in the Sahel as a Social Process Fulani on the Move : Seasonal Economic.‖ The Journal of Development Studies.
[10]. Hutomo. 2015. ―Faktor-Faktor Yang Mempengaruhi Keputusan Melakukan Migrasi Ulang-Alik.‖ Economics Development Analysis Journal 4(4):350–57.
[11]. Millán, Teresa Molina. 2015. ―Regional Migration , Insurance and Economic Shocks : Evidence from Nicaragua.‖ (9494).
[12]. Mulder, Clara H. and Michael Wagner. 1993. ―Migration and Marriage in the Life Course : A Method for Studying Synchronized Events.‖ European Journal of Population 55–76.
[13]. Muthmainnah and Budyandra. 2016. ―Determinant Status Migrasi Penduduk Di Provinsi Jawa Barat Tahun 2015 Menggunakan Regresi Logistik Multilevel.‖ 16(2):47–60.
[14]. Pangaribuan, Kaisar Hasudungan and Herniwati Retno Handayani. 2013. ―Analisis Pengaruh Pendapatan, Pendidikan, Pekerjaan Daerah Asal, Jumlah Tanggungan Dan Status Perkawinan Terhadap Keputusan Migrasi Sirkuler Ke Kota Semarang (Studi Kasus: Kecamatan Tembalang Dan Pedurungan).‖ Diponegoro Journal Of Economics 2:1–10.
[15]. Paulson, Anna L. 2000. ―Insurance Motives for Migration: Evidence from Thailand.‖ 3322(March).
[16]. Pratama, Annugrah Mujito. 2013. ―Analisis Faktor-Faktor Yang Mendorong Seseorang Untuk Melakukan Migrasi Ulang-Alik (Studi Kasus Pada Migran Kota Malang Yang Melakukan Migrasi Ulang-Alik Ke Surabaya Dengan Menggunakan Transportasi Bus).‖ Jurnal Ilmiah Mahasiswa FEB.
[17]. Purnomo, D. 2004. ―Studi Tentang Pola Migrasi Migran Sirkuler Asal Wonogiri Ke Jakarta.‖ Fakultas Ekonomi Universitas Diponegoro, Semarang.
[18]. Stoll, David. 2010. ―From Wage Migration to Debt Migration ? Easy Credit , Failure in El Norte , and Foreclosure in a Bubble Economy of the Western Guatemalan Highlands.‖ 37(170):123–42.
[19]. Syafitri, Wildan. 2013. ―Determinants of Labour Migration Decisions: The Case of East Java, Indonesia.‖ Bulletin of Indonesian Economic Studies 49(3):385–86.
[20]. Taylor, Marcus. 2011. ―‗ Freedom from Poverty Is Not for Free ‘: Rural Development and the Microfinance Crisis in Andhra Pradesh , India.‖ 11(4):484–504.
[21]. Tjiptoherijanto, Prijono. 1999. ―Urbanisasi Dan Pengembangan Kota Di Indonesia.‖ Jurnal I-Lib UGM 10(2):57–72.