doi:10.1006/cogp.2001.0770, available online at http://www.idealibrary.com on
Task Switching: A PDP Model
Sam J. Gilbert and Tim Shallice
Institute of Cognitive Neuroscience, University College London, London, United Kingdom When subjects switch between a pair of stimulus–response tasks, reaction time is slower on trial N if a different task was performed on trial N⫺1. We present a parallel distributed processing (PDP) model that simulates this effect when subjects switch between word reading and color naming in response to Stroop stimuli. Reac-tion time on ‘‘switch trials’’ can be slowed by an extended response selecReac-tion pro-cess which results from (a) persisting, inappropriate states of activation and inhibi-tion of task-controlling representainhibi-tions; and (b) associative learning, which allows stimuli to evoke tasks sets with which they have recently been associated (as pro-posed by Allport & Wylie, 2000). The model provides a good fit to a large body of empirical data, including findings which have been seen as problematic for this explanation of switch costs, and shows similar behavior when the parameters are set to random values, supporting Allport and Wylie’s proposal. 2001 Elsevier Science
Key Words: task switching; task set; Stroop effect; parallel distributed processing; executive functions.
Atkinson and Shiffrin (1968) proposed a distinction between relatively permanent cognitive structures, such as short- and long-term memory, and
control processes which harness those fixed structures in order to attain
spe-cific goals. This distinction was elaborated in the following years (e.g., Posner & Snyder, 1975; Shiffrin & Schneider, 1977) and has been generally accepted (Shallice, 1994). Yet research with normal subjects in the decades following Atkinson and Shiffrin’s article paid relatively little attention to the control processes required to select and organize fixed cognitive structures (with some notable exceptions, e.g., Gopher, Weil, & Siegel, 1989; Logan, 1979, 1980, 1985; Spelke, Hirst, & Neisser, 1976).
In recent years, studies have begun to investigate the control processes of normal subjects when they switch between different cognitive tasks on
The research reported in this article was supported by a research studentship awarded to Sam Gilbert by the UK Medical Research Council. We thank Gordon Logan, Nachshon Meiran, Glenn Wylie, Nick Yeung, and an anonymous reviewer for their helpful comments on an earlier version of this article.
Address correspondence and reprint requests to Sam Gilbert, Institute of Cognitive Neuro-science, Alexandra House, 17 Queen Square, London WC1N 3AR, United Kingdom. E-mail: [email protected]. Fax:⫹44 (0)20 7916 8517.
0010-0285/01 $35.00
successive trials (e.g., Allport, Styles, & Hsieh, 1994; Meiran, 1996; Rog-ers & Monsell, 1995; and contributions to Monsell & Driver, 2000). The task-switching paradigm therefore appears to offer a valuable tool for study-ing ‘‘executive control’’ (Logan, 1985; Monsell, 1996), both in normal sub-jects and in patients (e.g., Rogers, Sahakian, Hodges, Polkey, Kennard, & Robbins, 1998). However, there has been disagreement over the interpreta-tion of experiments involving task switching, making it difficult to draw firm conclusions from them about executive control. Here, we seek to clarify this debate by presenting a computational model of task switching.
MAIN EMPIRICAL FINDINGS AND THEORETICAL INTERPRETATIONS
A number of methodologies have been developed for studies of task switching. One approach is simply to compare pure and mixed blocks, i.e., to compare blocks where the subject performs the same task on every trial with blocks in which s/he must alternate between two tasks on successive trials (e.g., Allport et al., 1994; Jersild, 1927; Spector & Biederman, 1976). Other studies have employed the ‘‘alternating runs’’ paradigm (Rogers & Monsell, 1995), where subjects are required to switch tasks predictably every
nth trial, where n is at least 2. This has the advantage that ‘‘switch’’ trials
(where the task differs from the one performed on the previous trial) can be compared with ‘‘nonswitch’’ (or ‘‘repeat’’) trials within the same block. In a third methodology for task switching experiments, each trial is preceded by a cue which instructs the subjects which task to perform (e.g., Meiran, 1996; Sudevan & Taylor, 1987). This paradigm makes the requirement to switch tasks unpredictable.
Experiments using each of these paradigms have demonstrated costs, both in reaction time and error rate, for switch compared with nonswitch trials (or mixed compared with pure blocks). These ‘‘switch costs’’ have been reported to vary from zero to several hundred milliseconds per item, de-pending on the experimental conditions (see below). The main test of the model presented in this article will be whether it can predict the effects of various experimental manipulations on switch costs.
Explanations of the Switch Cost
mappings which are required to carry out an experimental task, is crucial. As we shall see, an important issue concerns the degree to which task switching should be understood in terms of processes occurring at the level of discrete S-R mappings rather than those which occur at the level of the task set (see also Monsell, Taylor, & Murphy, 2001).
Two main theoretical accounts of the switch cost have been put forward. Allport and colleagues (e.g., Allport et al., 1994; Allport & Wylie, 2000) have suggested that switch costs index an interference effect caused by a carryover of the previous task set into switch trials (this will be called the ‘‘task carryover account’’). As well as a carryover of the previously active task set into switch trials, inhibition of competing task sets can also persist on switch trials, when the previously competing task is now required. Ac-cording to this theory, there is no need to postulate differences between the higher level cognitive processes that occur during switch and nonswitch trials in order to explain switch costs; switch trials are simply prolonged by greater competition caused by the carryover effect (i.e., switch costs reflect a form of priming). This account does not deny the involvement of control processes in task switching. Without such processes, the subject could never switch tasks at all. What is denied by this account is that these control processes are measured in any direct way by the switch cost.
An opposing explanation of switch costs has been advanced by Monsell and colleagues (Monsell, Yeung, & Azuma, 2000; Rogers & Monsell, 1995). This hypothesis proposes that switch costs do reflect the duration of a stage-like executive control process which reconfigures the cognitive system for the upcoming task. However, it is held that this process cannot be completed until the arrival of the first stimulus of the new task (i.e., it is a stimulus-driven ‘‘exogenous control process’’). An additional component of the switch cost is hypothesized to reflect the operation of an ‘‘endogenous con-trol process’’ which can be executed before the arrival of the first stimulus in the new task. In a similar account, Rubinstein et al. (2001) attribute switch costs to the duration of a ‘‘goal shifting’’ stage, which can be executed before the arrival of a stimulus, and a ‘‘rule activation’’ stage which must await stimulus presentation.
Evidence for the Task Carryover Account
Evidence for the task carryover account of switch costs has come from findings which demonstrate an effect of the performance of an earlier task on subsequent switch costs (Allport et al., 1994; Allport & Wylie, 2000; see also Mayr & Keele, 2000). Two of these findings are of particular theoretical relevance.
Asymmetric switch costs. Allport et al. (1994, Experiment 5) carried out
times than color naming (see MacLeod, 1991). However, this experiment also produced a most unexpected result. Reaction times for word-reading trials were slower when color naming had been performed on the previous trial (i.e., there was a switch cost), but Allport et al. failed to detect a switch cost for color-naming trials that followed performance of the word-reading task. In other words, the switch cost appeared to be confined to the switch from the nondominant into the dominant (i.e., better learned, easier) task.
More recent experiments have replicated this asymmetry in switch costs (Allport & Wylie, 2000; Wylie & Allport, 2000). Allport and Wylie found that there is a cost for a switch into the color-naming task, but it is smaller than the cost of a switch into the word-reading task. Meuter and Allport (1999) reported an analogous finding when subjects switched between digit naming in their dominant and nondominant languages. This paradoxical finding—larger reaction time costs for a switch into a better learned, more dominant task—is difficult to explain if switch costs reflect the time taken to reconfigure the cognitive system for the upcoming task. Why should a switch into an easier, better learned task take longer to complete than a switch into a less familiar task? Allport et al. argue that the result can be explained if the primary determinant of the switch cost is the nature of the previous task. When subjects name the color of an incongruent Stroop stimulus, All-port et al. hypothesize that inhibition of the word-reading task may be re-quired. According to the task carryover account, this inhibition will persist on a switch trial where word-reading is now appropriate, leading to a large switch cost. But in the absence of any requirement to suppress color naming in order to perform the word-reading task, there will be no carryover of inhibition into color naming switch trials, hence the small or absent switch costs.
Item specific costs. Allport and Wylie (2000, Experiment 5) investigated
were recently associated, even when this task set is not appropriate. As a result, Allport and Wylie (2000) have updated the ‘‘task set inertia’’ (TSI) theory of Allport et al. (1994). They propose an ‘‘associative-TSI’’ account of switch costs, according to which stimuli are able to evoke recently associ-ated task sets from memory. When a stimulus appears on one trial, associassoci-ated with task A, and then reappears on a subsequent switch trial, requiring perfor-mance of task B, Allport and Wylie hypothesize that task set A may neverthe-less be evoked by the presentation of the stimulus (cf. perceptual ‘‘trigger conditions’’ in Norman & Shallice, 1986). The resulting competition be-tween task sets A and B may lead to an extended response selection process, explaining the enhanced switch cost obtained for word reading when the stimulus was recently presented for color naming.
Evidence for the Exogenous Control Process Account
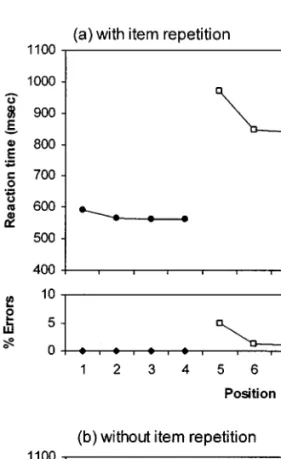
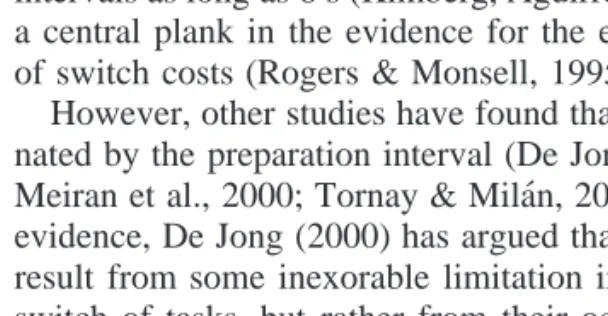
In arguing for the exogenous control process account, Monsell and col-leagues (Monsell et al., 2000; Rogers & Monsell, 1995) have demonstrated the robustness of the switch cost even when subjects have long intervals between trials to prepare for the upcoming task. They provided evidence that there is no further reduction in switch costs after the first 600 ms or so of the preparation interval: an asymptotic ‘‘residual switch cost’’ remains (e.g., Rogers & Monsell, 1995). This is hypothesized to correspond with the time taken by the execution of the exogenous control process, which must await stimulus presentation and is therefore insensitive to the preparation interval. A second line of evidence for the exogenous control process account comes from studies which have investigated task switching using the alter-nating runs paradigm when there are more than two trials of each task before a switch. Experiments with run lengths of four (Rogers & Monsell, 1995, Experiment 6) and eight (Monsell, Azuma, Eimer, Le Pelley, & Strafford, 1998) trials before each switch have found that the cost of task switching is confined to the first trial of a run (see Fig. 1). Rogers and Monsell (1995) argue that if switch costs result from a carryover effect from the previous task, they should dissipate more gradually, rather than being limited to the first trial of a run. Similarly, Monsell (1996) points out that ‘‘although having ample time to prepare before a predictable task switch does not eliminate switch cost, performing the task just once appears to do so’’ (p. 138). This pattern of results does not seem to be compatible with the idea that switch costs simply reflect a form of priming. It can more easily be explained if switch costs reflect a one-off process of task set reconfiguration at the begin-ning of switch trials.
FIG. 1. Mean reaction time (RT) and error rate in Rogers and Monsell’s (1995) Experi-ment 6, as a function of the position in a run of four trials, averaged over both tasks, adapted from Rogers and Monsell (1995, Fig. 5).
costs to that reported by Allport et al. (1994). Thus, it does not seem to be a general rule that switches from a less dominant to a more dominant task yield greater RT costs than switches in the reverse direction.
Ironically, recent evidence (e.g., Meiran et al., 2000; Salthouse, Fristoe, McGurthy, & Hambrick, 1998) has also shown that it is not a general rule that switch costs are confined to the first trial in a run. Nevertheless, it still appears to be a challenge to the task carryover account that switch costs can be confined to the first trial in a run, at least sometimes. Similarly, the finding of larger costs of a switch into a dominant task, even if it is not universal, appears to challenge the exogenous control process account.
abilities of each one to account for the data on its own. To do this, each account needs to be specified more precisely in order to assess its consistency with the available empirical data (of course, a sufficiently vague theory is consistent with any empirical data). Second, we need to establish where the crucial differences between the theories lie and which differences are better classified as differences in emphasis. Computational modeling can play a role in both of these steps. First, by implementing a theory in a computational model, the theory can be specified precisely, allowing a clear assessment of its ability to explain the empirical data. Second, if it were possible to produce a model onto which two competing theories may be mapped, this would suggest that the difference between the theories is not a fundamental one.
A crucial area of disagreement is the extent to which involuntary persis-tence of task sets can explain the dramatic improvement in reaction time from the first to the second trial in a run, following a switch of task. Although Monsell et al. (2000) ‘‘certainly accept that there are relatively long-term carry-over effects of the kind that Allport and colleagues have demon-strated,’’ they are inclined to doubt whether the dramatic improvement in RT from switch trials to immediately successive nonswitch trials can be ex-plained ‘‘even in part’’ by a carryover effect. Thus, the exogenous control process account does not deny that reaction time in some circumstances may be affected by a carryover of task set, but it claims that this is insufficient as an explanation of the drop in reaction time from switch to subsequent nonswitch trials.
In order to test this claim, we have implemented a version of the task carryover account in a computational model. In the remainder of this article, we take an existing computational model of task performance in pure-block conditions and extend it in accordance with the task carryover account of switch costs. We then test its performance in mixed-blocks against the empir-ical data. Our reasoning is as follows. If an existing computational model of pure-block performance, augmented with the mechanisms required by the task carryover account of task switching, can produce similar behavior to subjects in comparable experimental conditions, then the task carryover ac-count would be strengthened. Furthermore, if the model is successful, this would indicate that, contrary to the arguments of Rogers and Monsell (1995) and Monsell et al. (2000), a task carryover account can offer a sufficient explanation of the relevant set of task-switching phenomena. Thus, the exog-enous control process invoked by alternative accounts may be unnecessary to explain the cost of task switching.
bilingual language switching (Meuter & Allport, 1999), and pairs of tasks with different S-R compatibility (Monsell et al., 2000). Thus, there is enough data to allow the evaluation of a computational model against the perfor-mance of human subjects. A second reason for this choice is the theoretical weight attached to the finding of ‘‘paradoxical’’ asymmetric switch costs (Allport et al., 1994; Monsell et al., 2000), which requires a pair of tasks of different ‘‘strengths.’’ The final reason is that an influential model of the Stroop effect has been developed by Cohen and colleagues (Cohen, Braver, & O’Reilly, 1996; Cohen, Dunbar, & McClelland, 1990; Cohen & Huston, 1994; Cohen & Servan-Schreiber, 1992; see also Phaf, Van der Heijder, & Hudson, 1990; Zhang, Zhang, & Kornblum, 1999). Thus, an ex-isting computational model of pure-block performance is already available. This strategy is similar to the approach taken by Logan and Gordon (2001), who added control processes to an existing model of visual attention (Bunde-sen, 1990) in order to simulate situations that require switching between tasks. However, the type of model employed by Logan and Gordon (2001) and the phenomena simulated are rather different from those tackled here, making direct comparison between the two models difficult.
THE MODEL
Although the present model is based on the earlier models of the Stroop task by Cohen, Dunbar, and McClelland (1990) and Cohen and Huston (1994), it also has many modifications. Below, we provide a full description of our model, followed by a brief comparison with the earlier models on which it is based.
We have implemented an interactive activation model (McClelland & Rumelhart, 1981), composed of two separate pathways, for word reading and color naming (see Fig. 2). In each pathway, there are three input units (representing, in the word pathway, the words ‘‘red,’’ ‘‘green,’’ and ‘‘blue’’ and, in the color pathway, the colors red, green, and blue). In addition, each pathway has three output units, representing the responses ‘‘red,’’ ‘‘green,’’ and ‘‘blue.’’ In other words, each possible response is represented twice, once in the word-reading pathway and once in the color-naming pathway. Thus, the model has a total of six input units and six output units. Each input unit has a positive connection with its corresponding output unit. For example, in order to simulate a stimulus of the word ‘‘red’’ written in green ink color, the ‘‘red’’ word input unit and the ‘‘green’’ color input unit would both be activated. This would send activation to the ‘‘red’’ output unit in the word-reading pathway and the ‘‘green’’ output unit in the color-naming pathway.
simula-FIG. 2. Architecture of the present model.
de-mand unit is activated, it sends activation to the output units in the color-naming pathway, allowing them to win competition with the output units in the word-reading pathway. As well as sending a positive input to the output units of their corresponding pathway, the task demand units also send a nega-tive (i.e., inhibitory) input to the output units of the other pathway.
The word-reading and color-naming output units also send activation back to the task demand units. This introduces feedback as well as feedforward connectivity into the model, allowing activity in the color and word pathways to modulate activity in the task demand units. Similar connections were intro-duced into the model of Cohen and Huston (1994) in order to simulate phe-nomena such as attentional capture, where stimuli are able to ‘‘draw atten-tion’’ to themselves (e.g., Posner, 1980). The task demand units receive an additional ‘‘top-down control input,’’ which specifies which task the model should perform. The word and color output units are interconnected, so that congruent word and color response units (e.g., the two ‘‘red’’ units) have reciprocal positive connections and incongruent pairs of units (e.g., word ‘‘red’’/color green) have reciprocal negative connections. Finally, there are lateral inhibitory connections between all units within the word output ‘‘module’’ (i.e., set of word output units), color output module and task de-mand module. This encourages the network to settle into stable states with no more than one unit active in each module.
Comparison with Earlier Models
Although the model is based on the earlier models of Cohen, Dunbar, and McClelland (1990) and Cohen and Huston (1994), its architecture differs from them in two main respects. First, there are three possible words and colors (red, green, and blue) in the present model as opposed to just two in the earlier models. This was chosen because the Cohen et al. (1990) model has been criticized for failing to capture differences between word reading and color naming when the set size is increased beyond two (Kanne, Balota, Spieler, & Faust, 1998; but see Cohen, Usher, & McClelland, 1998, for a reply).
in our model similar to the convergent inputs into the response units of the Cohen et al. (1990) and Cohen and Huston (1994) models.
Implementation of the Task Carryover Account
The model was extended in two ways in order to implement the task carry-over account of task switch costs. First, rather than reinitializing the network at the beginning of every trial, the model was modified so that the state of the task demand units can persist into successive trials. As a result, the most recently implemented task set remains active at the beginning of the next trial and the most recently inhibited task set remains inhibited. This can be seen as an implementation of the hypothesis put forward by Allport et al. (1994) that control states persist, involuntarily, from one trial to the next. The most simple way to implement this would be to start each trial with the task demand units in the state they were in at the end of the previous trial. However, this could well lead to ‘‘perseverative’’ behavior, with the model unable to switch from one task into the other. Thus, a ‘‘squashing’’ parameter was introduced so that the activation levels of the task demand units follow-ing each response are squashed, i.e., set to some proportion of their activation levels at the end of the previous trial. Such reductions in activation levels between trials are common in models of sequential processes (e.g., Burgess, 1995; Dayan, 1998; O’Reilly & Farah, 1999) and seem to be biologically plausible. The task demand units in our model are thought to reflect activity in prefrontal cortex (see Miller & Cohen, 2001) and single-cell recording studies of monkeys performing cognitive tasks have demonstrated a sharp reduction in the firing rate of cells in prefrontal cortex following the produc-tion of a response (see Fuster, 1997, pp. 121–134; for an example in some ways akin to the task switching paradigm see Asaad, Rainer, & Miller, 2000).
that the effects of learning on trial N persist only for trial N ⫹1. This is a simplifying assumption rather than a theoretical position which we adopt. There is strong evidence for such item-specific priming effects lasting for longer than one trial (e.g., Allport & Wylie, 2000, Experiment 5; Waszak, Hommel, & Allport, submitted). However, long-term priming effects, though clearly of great interest, are not addressed in this work.
Multiple Inputs to Task Demand Units
As well as the control input that indicates which task is to be performed, each task demand unit also receives an input from the stimulus input units, from the color and word output units and from the other task demand unit. When we discuss the model’s performance we refer especially to two of these inputs: the control input, which indicates which task is currently appro-priate (we refer to this as the ‘‘top-down input’’), and the input that the task demand units receive from the stimulus input units (we refer to this as the ‘‘bottom-up input’’). One crucial feature of the top-down input is that it is not equal for the two task demand units. We assume that the control mechanism provided by the task demand units is required more for the color than the word task, since the color-naming pathway is weaker (see, e.g., LaBerge & Samuels, 1974; Posner & Snyder, 1975 for similar ideas). Thus, the top-down input received by the color task demand unit, when color naming is the required task, is greater than the top-down input received by the word task demand unit on word-reading trials. As we shall see, this difference in top-down input plays an important role in the model’s behavior.
Operation of the Model
The steps taken to simulate a trial are as follows: (1) For trials other than the first, the task demand units are set to a proportion of their activation values at the end of the previous trial. This proportion is set by the squashing parameter discussed above. The activations of the stimulus input and output units are set to zero.1(2) The appropriate top-down input is added to the net input of the color or the word task demand unit, depending on which task is required. This input is added to the task demand unit’s net input on every cycle. (3) The preparation interval begins. With all of the stimulus input units set to zero, the top-down input is applied to the task demand units for the number of cycles set as the preparation interval. The activation levels of the output units are not updated during this period. (4) After the end of the preparation interval, the appropriate task demand unit is activated as before and either one or two of the stimulus input units have their activation values
1A more sophisticated model might incorporate persisting activation of the output units.
set to the maximum value, until the end of the trial. In order to simulate neutral trials (affording a response in only one of the tasks, e.g., ‘‘xxxxx’’ written in blue ink or ‘‘green’’ written black ink), just one of the stimulus input units is activated in this way. Congruent (e.g., ‘‘red’’ in red ink) and incongruent (e.g., ‘‘red’’ in blue ink) trials are simulated by activating two stimulus input units, one in the word-reading pathway and one in the color-naming pathway. (5) Activation is allowed to propagate until a response threshold is reached (see below). The number of cycles since stimulus pre-sentation is recorded as the ‘‘reaction time.’’
Activation Level and Weight Update
Activation levels are determined by the standard interactive activation equations (McClelland & Rumelhart, 1981). On every cycle, the net input for each unit is calculated by summing the activation values of every unit from which it receives a connection, multiplied in each case by the appro-priate connection weight. In addition, units in the task demand, word and color modules each have a bias, a constant which is added to their net inputs on every cycle as well as the inputs received from other units. Each unit’s activation value is then updated according to the following equations:
If the net input is positive:∆act⫽ step ⫻net ⫻(max⫺act) (1)
If the net input is negative: ∆act⫽ step⫻ net⫻ (act⫺min) (2)
Where act ⫽current activation, step⫽ step size, net ⫽ net input, max⫽ maximum activation value, and min⫽minimum activation value. The step size parameter determines the magnitude of the change in activation on each cycle, setting the speed of processing. When the activation values have been updated for each unit, the net inputs are calculated again and a new cycle begins. On each cycle, a random noise term is also added to the activation values of each unit. This term is drawn from a Gaussian distribution, with a mean of zero; the standard deviation of this distribution determines how much disruption is caused by noise on each cycle. After noise has been added, the activation levels of any units outside the maximum and minimum values are reset to the relevant extreme.
At the end of each trial, the weights between the stimulus input and task demand units are set according to the following equation:
wij⫽lrate ⫻aj⫻ ai (3)
In this equation, wijis the weight of the connection from unit j to unit i, lrate
sets the learning rate (i.e., the magnitude of the change in weights for each trial), and aj and ai are the activation levels of units j and i respectively.
connection between the two relevant units. Thus, these weights are calculated anew at the end of each trial, i.e., the weights derived from the activation levels of the units at the end of trial N only affect the model’s behavior for trial N ⫹1.
Response Threshold
The purpose of the response threshold is to provide a way to determine the moment when enough evidence has been accumulated from the word and color output units for a response to be emitted. This is implemented as follows. At the end of each cycle, the word or color output unit with the greatest level of activation is compared with each other word and color out-put unit, except for the unit which commands the same response in the other stimulus dimension (e.g., the red color-naming output unit if the red word-reading output unit has the highest activation level). The difference in activa-tion between the most active unit and the next most active unit is calculated. When this difference passes a fixed threshold the trial is terminated. Thus, a response is simulated as occurring when the amount of evidence for that response exceeds the evidence for any other response by a fixed amount. This is essentially a ‘‘random walk’’ model (see Logan & Gordon, 2001; Nosofsky & Palmeri, 1997; Palmeri, 1997). A similar response threshold, based on the amount of evidence for the different responses, was used by Cohen et al. (1990).
PERFORMANCE OF THE MODEL
The parameters, including the connection weights, were initially set by hand and remain fixed for the first set of simulations described below, except where stated (see the Appendix for parameter values). We show later that the model’s behavior generally remains similar when the parameters are set to random values within a certain range. Thus, the properties of the model result from its general processing characteristics rather than the specific pa-rameter values that were chosen.
Whenever incongruent stimuli are used in the simulations reported below, the same stimulus is presented on every trial, whichever the task (except where stated). A small set of stimuli is typically used for both tasks in experi-mental studies of task switching. Since the effects of learning only last for one trial in the model, it was necessary in the basic simulations to use the same stimulus on every trial, to simulate the possible contribution of item-specific effects which are assumed to have occurred in previous studies of task switching. This is of course a major simplification, which is addressed further in a later section.
(corre-sponding to around 2500 ms according to linear regressions of simulated on empirical data) were counted as errors and excluded from the reaction time analyses. For every simulation below where the performance of the model is being compared with a specific set of empirical data, we have performed a linear regression of the simulation data (in cycles) on the empirical data (in milliseconds) and reported the model’s simulations in milliseconds. Where the model is not being compared with any specific data set, we have used the regression equation derived from the model’s simulation of the Stroop interference and facilitation data (see below).
Stroop Interference and Facilitation
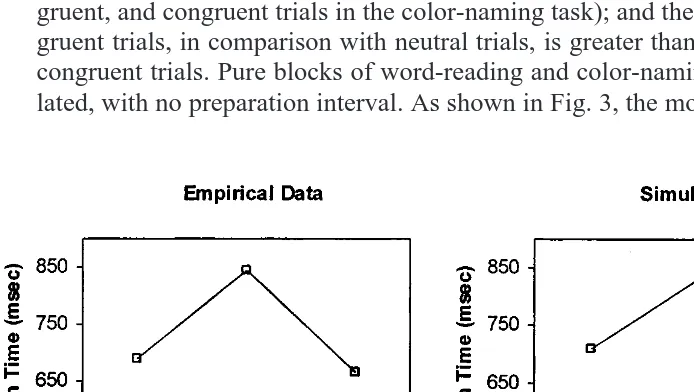
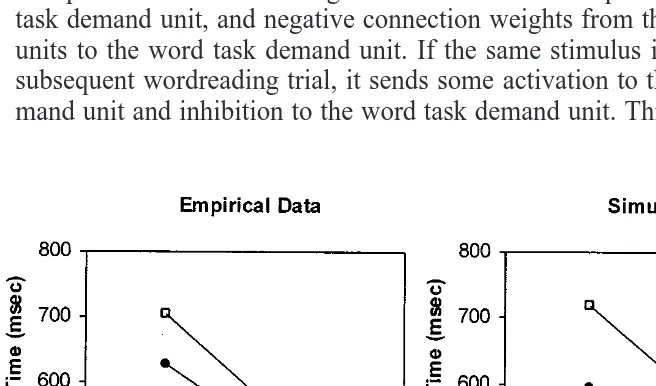
The first aspect of the model’s performance to be investigated is whether it can accurately predict the reaction times of subjects in pure blocks of word reading and color naming with neutral, incongruent, and congruent Stroop stimuli (see MacLeod, 1991, for a review). Cohen et al. (1990) demonstrated that their model was able to simulate three important findings in pure blocks of the Stroop tasks: word-reading reaction times are faster than color-naming reaction times; the word-reading task interferes more with the color-naming task than vice versa (i.e., there is a greater difference between neutral, gruent, and congruent trials in the color-naming task); and the cost of incon-gruent trials, in comparison with neutral trials, is greater than the benefit of congruent trials. Pure blocks of word-reading and color-naming were simu-lated, with no preparation interval. As shown in Fig. 3, the model accurately
reproduces all three aspects of the data which were discussed in relation to the Cohen et al. model. Errors were infrequent (⬍0.5% for every trial type). Each of these phenomena can be readily explained in terms of the architec-ture and processing of the model. Word-reading responses are faster than color-naming responses because of the stronger connection strengths in the word pathway which lead to stronger activation of the output units and there-fore a faster rate of evidence accumulation. The color-naming task suffers much greater interference from the word-reading task than vice versa be-cause the connections in the word pathway are sufficiently strong to be-cause strong activation in the output units, even when the task demand units favor the color-naming task. The greater cost of incongruent trials, in comparison with the benefit of congruent trials, can be explained in terms of the activa-tion funcactiva-tion used [Eqs. (1) and (2)]. The effect of a positive net input into a unit is reduced, the higher the activation value of that unit (the same is true of the somewhat different activation function used by Cohen et al., 1990, and Cohen & Huston, 1994). Thus, the greater the positive input to a unit, the less will be the contribution of additional positive inputs. Consequently, adding an extra positive input to an active output unit from a congruent stimulus dimension will have less effect than adding a positive input to a less active (incorrect) output unit from an incongruent stimulus.
The simulation of the Stroop interference and facilitation data is not a demanding test of the present model which, despite several differences, is based on an existent model of the Stroop task (Cohen et al., 1990; Cohen & Huston, 1994). A more interesting question concerns the ability of the model to generalize beyond the mean reaction times found in pure blocks and pre-dict reaction times when subjects switch between the two tasks within the same block.
Task Switching in Mixed Blocks
To test the ability of the model to predict reaction times in mixed blocks of word reading and color naming, the alternating runs paradigm (Rogers & Monsell, 1995) was simulated with a run length of four before each switch of task. If switch costs are found, this would then allow one to investigate whether they are confined to the first trial of a run, as the empirical data would suggest (Rogers & Monsell, 1995, Experiment 6). Again, there was no preparation interval in this simulation.
trials. Second, this switch cost appears to be confined to the first trial, as found by Rogers and Monsell (1995). Inspection of Fig. 4a shows that there is a very small increase in RT on the first repeat trial compared with the second: 19.7 ms for the word task and 6.3 ms for the color task. However, this effect is negligible in comparison with the RT drop from the first to the second trial: 273 ms for the word task and 123 ms for the color task.
The third noteworthy feature of Fig. 4, especially Fig. 4a, is that switch costs are markedly asymmetrical: much larger for the word than the color task. This is the pattern reported by Allport et al. (1994) and Allport and Wylie (2000). The switch cost asymmetry is less extreme in Fig. 4b, in line with some recent empirical evidence (Waszak et al., submitted); we return to this below. Finally, the model produces a slightly increased RT on the first trial of the run, even though this does not follow the performance of any other tasks. Such ‘‘restart costs’’ have been observed by Allport and Wylie (2000) and Gopher, Armony, and Greenshpan (2000).
Errors were relatively infrequent (⬍5% in all conditions), but were more common in the color task than in the word task and on switch in comparison with nonswitch trials. However, since reaction times have received greater attention than errors in studies of task switching, error rates are not discussed in the following simulations.
Explanations of the Observed Phenomena
Switch/restart costs. In order to understand why the model produces
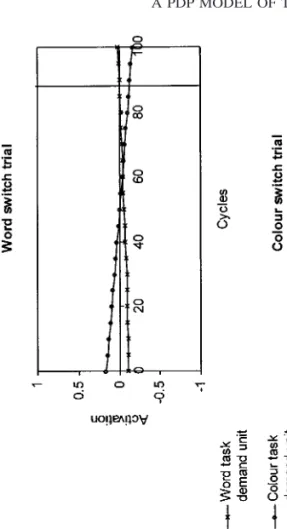
switch costs, we need to look at the role of the task demand units in its behavior. Recall that the task demand units bias processing in the word and color pathways so that the intended task is facilitated (i.e., receives positive connections) and the unintended task is inhibited (i.e., receives negative con-nections). Thus, the task demand units help to resolve competition between the two tasks, leading to one of the output units in the correct response dimen-sion (color or word) becoming most active. The model was run without noise in order to produce Fig. 5, which illustrates the activation levels of the two task demand units over the course of a switch and a nonswitch trial, both for the color and the word task. The vertical lines indicate the moment of response execution, i.e., the moment when the difference between the activa-tion levels of the most active and the second most active output unit passed the threshold. Although the activation levels after the end of the trial are shown in Fig. 5, for illustrative purposes, the next trial immediately follows response execution when the model is actually run.
FIG.
5
.
Activation
levels
of
the
task
demand
units
during
the
course
of
switch
and
nonswitch
trials,
for
both
the
word
and
the
color
task.
Vertical
lines
indicate
the
moment
of
response
of the trial and so take longer to reach activation levels which would facilitate the intended task and inhibit the unintended one. This is caused by the car-ryover of the task demand units’ activation values from the previous trial. A second reason for the relative ineffectiveness of the task demand units on switch trials results from the network’s learning mechanism and the repeti-tion of the same item for both tasks. This item-specific effect will be investi-gated in more detail below.
Restart costs arise because, on the first trial of a run, the network lacks the facilitation caused by a carryover of task set from switch to subsequent nonswitch trials. Since they only reflect the absence of a facilitatory effect, rather than being caused by an inhibitory effect combined with the carryover of a competing task set, restart costs are more modest than switch costs.
Switch costs confined to the first trial in a run. A determinant of the size
of switch costs in the model is the state of the task demand units at the end of the trial preceding the switch. This determines the magnitude of the carryover of task set: if the task demand units are very active at the end of one trial, this will cause a large carryover into the subsequent trial. As Fig. 5 shows, although the task demand units have inappropriate activation levels at the start of switch trials, their activation levels become appropriate for the required task by the end of such trials. The stimulus input units become associated with these new values by Hebbian learning. Consequently, the appropriate task demand activations are carried over into the immediately successive nonswitch trial. In other words, the original cause of the switch cost (incorrect task demand unit activations) is dissipated by the end of the switch trial. It therefore does not contribute to successive nonswitch trials in the run. (At the end of a switch trial, the task demand units generally have a weaker activation than they do at the end of a nonswitch trial, since they started with inappropriate activations at the beginning of the trial. As a result, the first nonswitch trial after a switch may receive a weaker carryover of the appropriate task than subsequent nonswitch trials. This accounts for the very slight improvement which is observed between the first and second repeat trial.)
Fig. 4b, where there is no item repetition. Rogers and Monsell (1995) are therefore incorrect to argue that the task carryover account of switch costs is incompatible with such costs being limited to the first trial of a run. As Fig. 4 shows, a model in which the only source of switch costs is a carryover of task set is capable of producing this pattern of data.
Asymmetric switch costs. Examination of Fig. 5 also reveals a reason for
asymmetric switch costs. Comparison of the word and color switch trials shows that, on the color switch trial, the task demand units quickly become strongly activated in the appropriate manner for the color-naming task but on the word switch trial the task demand units continue to favor the color task until just before the moment of response execution. This is due to the difference in the strength of top-down inputs for the two task demand units. Recall that a larger value is added to the net input of the color task demand unit on color trials than is added to the net input of the word task demand unit on word trials. Thus, on switch trials, reconfiguration of the task demand units for the intended task is slower for the word-reading task than the color-naming task, hence the paradoxical asymmetry in switch costs. It should be noted that this explanation of asymmetric switch costs differs from the explanation proposed by Allport et al. (1994). Allport and col-leagues propose that the color task requires strong suppression of word read-ing, but not vice versa. As a result, the word task in strongly suppressed following a switch from color naming. This generates a large switch cost in the word task, but there is a smaller cost for switches into the color task since it was not previously suppressed or was suppressed to a lesser degree. We agree that differences in ‘‘competitor suppression’’ between the two tasks are plausible (equal excitatory and inhibitory weights from the color and word task demand units were implemented as a simplifying assumption). However, the model shows that a paradoxical asymmetry in switch costs can result from differences in top-down inputs for the two tasks, regardless of their possible differences in the requirement for competitor suppression.
It would be problematic if the model rigidly predicted asymmetric switch costs, with a larger cost of switches into the dominant task. As discussed above, a number of experiments have been carried out which have yielded an asymmetry of switch costs in the reverse direction (i.e., greater switch costs for switches into the weaker task; see Monsell et al., 2000). However, we will see later that the asymmetry in switch costs observed in Fig. 4a and (to a lesser degree) Fig. 4b is sensitive to certain parameter manipulations. Thus, it is possible for the model to produce asymmetric switch costs with a larger cost for switches into the weaker task. The circumstances that give rise to this, both experimentally and in the model, are discussed below.
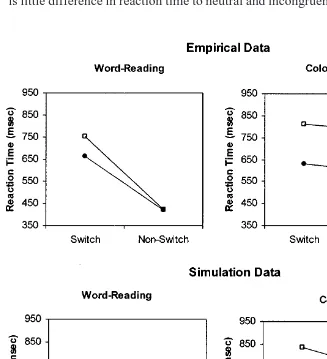
Reverse Stroop Interference
is substantially slower for incongruent than neutral stimuli but the difference is generally negligible on nonswitch trials, suggesting a carryover of the color task set into word switch trials. This contrasts with color naming, which shows a large difference between incongruent and neutral stimuli for both switch and nonswitch trials. As can be seen from Fig. 6, the model also shows this effect. On word nonswitch trials, the color pathway is too weak to interfere noticeably with activity in the word pathway. As a result there is little difference in reaction time to neutral and incongruent stimuli on word
nonswitch trials. But on word switch trials, the carryover of task set facili-tates the color pathway and inhibits the word pathway. This causes the color pathway to be strong enough, and the word pathway to be weak enough, for interference to occur, hence the difference in reaction time between incon-gruent and neutral stimuli on switch trials. When the task is color naming, the word pathway is sufficiently strong to cause interference even on non-switch trials when the color and word are incongruent. Thus, there is a large difference between reaction times to incongruent and neutral stimuli both on switch and nonswitch trials.
Item-Specific Switch Costs
In an experiment which was discussed in the introduction, Allport and Wylie (2000, Experiment 5) investigated the extent to which switch costs might be contingent on repetition of the same stimulus items between the two tasks. They found that the cost of a switch into the word task was sub-stantially higher if the stimulus on the switch trial had earlier appeared in a color-naming trial. However, there was no significant difference in reaction time between these ‘‘primed’’ and ‘‘unprimed’’ stimuli on nonswitch trials. Thus, there appears to be a strongly item-specific component of the switch cost. It is clear that priming from the color task cannot affect subsequent word nonswitch reaction times in the model for the simple reason that learn-ing between the stimulus input and task demand units only lasts for one trial. As a result, even if there is a greater reaction time on word switch trials for primed stimuli (i.e., stimuli just seen in the color-naming task), this priming will have decayed before the following word nonswitch trial.
This is not a satisfactory account of the interaction between stimulus repe-tition and switch/nonswitch trials because we have already seen evidence for priming effects that last for more than one trial (Allport & Wylie, 2000, Experiment 5; Waszak et al., submitted). The simplifying assumption that learning effects last for only one trial does not allow us to test the model’s simulation of the interaction between item repetition and switch/nonswitch trials. Thus, to provide a stronger and more principled test of the model, we allowed learning to last beyond a single trial for this simulation only.
Equation (3) was modified so that the weight at the end of the last trial was added to the new weight, i.e., there was no decay in the connection strengths between the stimulus input and task demand units. First, the model was presented with a sequence of four nonrepeating incongruent stimuli (re-ferred to as ‘‘ABCD’’), the first two for color naming and the last two for word reading, in order to obtain baseline reaction times for unprimed stim-uli.2Then, after reinitializing the network, an ‘‘ABBC’’ sequence was
pre-2In order to obtain these unprimed baseline RTs, Hebbian weights were only allowed to
sented, again with color naming for the first two trials and word reading for the last two. Finally, an ‘‘ABCB’’ sequence was presented. (As before, each of these simulations was run 50,000 times). By comparing the mean reaction time to the second B stimulus in the ABBC sequence with the C stimulus in the ABCD sequence, it is possible to assess the effect of item repetition on word switch trials. Likewise, comparing the mean reaction time to the second B stimulus in the ABCB sequence with the D stimulus in the ABCD sequence should reveal the effect of item repetition on word nonswitch trials. Since there was no decay in the connection strengths between the stimulus input and task demand units, the distance between prime and probe trials had no effect on the model’s behavior. Figure 7 shows the results of these simulations.
The model does an excellent job of simulating the interaction between item repetition and trial type (switch/nonswitch) for word-reading reaction times. Not only does item repetition between the color and word tasks lead to slower response times in the word-reading task, this effect is essentially confined to switch trials. The explanation is as follows. When a stimulus is presented for color naming, the Hebbian learning at the end of the trial leads to a positive connection weights from the stimulus input units to the color task demand unit, and negative connection weights from the stimulus input units to the word task demand unit. If the same stimulus is presented on a subsequent wordreading trial, it sends some activation to the color task de-mand unit and inhibition to the word task dede-mand unit. This means that the
task demand units take longer to reach appropriate activation values for the word task, since the top-down activation they receive is countered, to some extent, by the inappropriate bottom-up (i.e., stimulus-driven) activation. On nonswitch trials, the task demand units start off favoring the word task and inhibiting the color task. Since the word pathway is much stronger than the color pathway, the precise values of the task demand units have very little effect on word-reading trials when they already favor the word task. Thus, an incorrect bottom-up activation of the task demand units on a word non-switch trial has little effect on the model’s behavior.
Similar simulations were run to assess the effects of priming from word-reading to color-naming trials; these revealed two differences between the two tasks. First, although the mean reaction time was slower for primed than unprimed color-naming switch trials, this effect was smaller than in the word-reading task. This is because the color-naming top-down input is stronger, allowing it to oppose the inappropriate bottom-up activation more effectively. Second, unlike in the word-reading task where the effect of item repetition is very small on nonswitch in comparison with switch trials, the relative size of the effect on color-naming nonswitch trials, in comparison with switch trials, was greater than half. This is because the color-naming pathway, unlike the word-reading pathway, is heavily dependent on the task demand units even on nonswitch trials. Support for these two predictions was recently obtained, using a picture–word Stroop task, by Waszak et al. (submitted), who found that the effect of item repetition on reaction times in the less dominant picture-naming task was smaller than the effect on word-reading switch trials, and it was just as large on switch and nonswitch trials. Note that the model’s simulation of item repetition increases the switch cost substantially in the word-reading task, but very little in the color-naming task, where switch and nonswitch trials are affected similarly. This accounts for the greater asymmetry in switch costs between the two tasks when item repetition is allowed (compare Figs. 4a and 4b), as found by Waszak et al. (submitted).
effects to reverse Stroop interference, we reran the simulations illustrated in Fig. 6, this time using a different incongruent stimulus for the word and color tasks. Essentially the same pattern of results was found, but with a smaller difference between incongruent and neutral stimuli on the word switch trial. Thus, item-specific priming effects can play a role in the model’s simulation of reverse Stroop interference, but such interference is seen even in the absence of any item-specific effects.
Effects of Neutral Trials
Many experiments (e.g., Allport & Wylie, 2000, Experiment 4; Rogers & Monsell, 1995, Experiment 1) have found that switch costs are reduced, but not eliminated, when neutral stimuli are used. Inspection of Fig. 6 shows that the model also produces reduced switch costs when the stimulus is neu-tral, both in the word and color tasks. This can be explained in terms of the earlier explanations of reverse Stroop interference. Incongruent switch trials are slower than neutral switch trials, but there is a smaller difference in reac-tion time between incongruent and neutral nonswitch trials. Thus, the differ-ence in reaction time between switch and nonswitch trials (i.e., the switch cost) is larger for incongruent than neutral stimuli. This is because response selection in incongruent trials is particularly slow following a switch of task. A second example of the effect of neutral trials on switch costs is reported by Allport and Wylie (2000, Experiment 1; also reported in Wylie & Allport, 2000, Experiment 1). In this experiment, the focus was the effect of neutral trials in the previous task on subsequent switch costs rather than the effect of neutral stimuli on switch trials. Allport and Wylie found that the cost of a switch into the word-reading task was greatly increased when the stimuli in the previous color-naming task were changed from neutral to incongruent, even though the word-reading stimuli were always incongruent. Similarly, the model’s mean word-reading switch cost increases from approximately 151 to 273 ms when the stimulus for the previous color-naming trial is changed from neutral to incongruent, using incongruent stimuli for word reading in both cases.
Preparation
Preparation is simulated by activating the task demand units in advance of the stimulus input units, without activating the output units. As Fig. 8 shows, the preparation interval has a large facilitatory effect on the reaction times for switch trials, but little effect on nonswitch RTs: the preparation interval is therefore able to reduce switch costs, as found by Meiran (1996) and Rogers and Monsell (1995, Experiment 3). In this respect, the model’s simulation of the empirical data is successful. However, one aspect of the model’s behavior does not fit the experimental evidence. In the model, the switch cost is entirely eliminated at the longest preparation interval of 150 cycles; this corresponds with an interval of approximately 1200 ms according to the regression equation derived from the model’s simulation of the Stroop interference and facilitation data. In contrast, some experimental investiga-tions into task switching have found residual switch costs even at preparation intervals as long as 8 s (Kimberg, Aguirre, & D’Esposito, 2000). This forms a central plank in the evidence for the exogenous control process account of switch costs (Rogers & Monsell, 1995).
However, other studies have found that the switch cost is virtually elimi-nated by the preparation interval (De Jong et al., submitted; Meiran, 1996; Meiran et al., 2000; Tornay & Mila´n, 2001). On the basis of this and other evidence, De Jong (2000) has argued that the residual switch cost does not result from some inexorable limitation in subjects’ ability to prepare for a switch of tasks, but rather from their occasional failure to make effective use of the preparation interval. This is perfectly compatible with the model presented here, although it is not necessary to assume, as does De Jong, that subjects are either fully prepared or not at all prepared for the new task at
the moment of stimulus onset. Thus, the model’s failure to produce a residual switch cost may result from the way that the preparation interval is simulated rather than reflecting a more serious problem.
Another potential shortcoming of the model’s simulation of preparation is that some authors have reported that preparation, while reducing switch costs, does not seem to reduce the amount of Stroop-like interference be-tween tasks (e.g., De Jong, 1995; Meiran, 1996). The model would predict some reduction in Stroop interference with preparation. However, this reduc-tion in Stroop-like interference with preparareduc-tion has been found by other researchers (Goschke, 2000; Sudevan & Taylor, 1987), so it is not clear whether this should be considered a problem for the model.
EFFECTS OF PARAMETER SETTINGS
The model produces a good fit to a large body of empirical data from task-switching experiments. However, it has a number of free parameters which were set by hand. It is possible that the model owes its successes to the specific parameter settings chosen. If this is the case, then the model cannot be said to provide strong support for the task carryover account of switch costs, since it might be able to fit any set of data with the appropriate parameter settings (see Roberts & Pashler, 2000). It would be more impres-sive if it could be shown that the properties of the model result from the general principles which govern its operation rather than its specific parame-ters. We investigated this question by evaluating the effects of setting the parameters to random values (within certain limits).
The model was run 1000 times with a random value selected for each weight and each other free parameter on every run, with the exception of minimum and maximum activation values and step size (see the Appendix for a list of parameters and their possible values). Each run consisted of 500 simulated reaction times in each condition to provide mean reaction times. In keeping with a central assumption of the model, the connections from stimulus input to output units had a greater strength in the word pathway than in the color pathway, reflecting the greater strength of the word task (Cohen et al., 1990). On each run, two random values were chosen for the connection strengths from the stimulus input units to the word and color output units. If the value for the color units was greater than the value for the word units, another pair of values was chosen until the word output units received a stronger connection than the color output units. Similarly, the level of top-down control input for the color task demand unit was greater than the level of top-down control input for the word task demand unit.
model produced unacceptably high error rates. We defined ‘‘unacceptably high’’ as an error rate of 20% or more for one or more trial types in a re-peating run of word-reading and color-naming trials using the same incon-gruent stimulus on every trial.
The level of top-down control input to the color task demand unit had no upper limit above which the model’s performance deteriorated. It was there-fore given a maximum value which made the standard parameter setting exactly midway between the maximum and the minimum values. The noise parameter was allowed to vary between zero and its standard setting. We assumed that, since the maximum and minimum parameter values were cho-sen with the noise parameter at its standard setting, making this the maximum noise setting should ensure that the majority of simulations do not produce an excessive number of errors.
Results
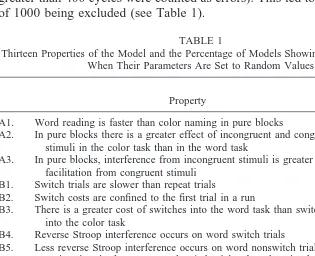
Models that produced an error rate of greater than 10% on any trial type were excluded from the following analyses (as before, reaction times of greater than 400 cycles were counted as errors). This led to 366 simulations of 1000 being excluded (see Table 1).
TABLE 1
Thirteen Properties of the Model and the Percentage of Models Showing Those Properties When Their Parameters Are Set to Random Values
Percentage
Property of models
A1. Word reading is faster than color naming in pure blocks 88.5 A2. In pure blocks there is a greater effect of incongruent and congruent 76.3
stimuli in the color task than in the word task
A3. In pure blocks, interference from incongruent stimuli is greater than 66.9 facilitation from congruent stimuli
B1. Switch trials are slower than repeat trials 98.9 B2. Switch costs are confined to the first trial in a run 72.7 B3. There is a greater cost of switches into the word task than switches 77.1
into the color task
B4. Reverse Stroop interference occurs on word switch trials 100.0 B5. Less reverse Stroop interference occurs on word nonswitch trials 99.5 B6. Reaction time is slower on word switch trials when the stimulus was 98.3
seen on the previous color-naming trial
B7. There is a smaller effect of item repetition between the two tasks, or 93.9 no effect, on word nonswitch trials (for those models with
prop-erty B6)
B8. Smaller switch costs occur when the subject is presented with neu- 99.2 tral stimuli than when incongruent stimuli are used
B9. Switch costs in the word task, using incongruent stimuli, are greater 99.8 following color naming with incongruent stimuli than following
color naming with neutral stimuli
We have taken 13 empirical phenomena simulated above and categorized them into those that relate to performance in pure blocks of the Stroop tasks (A1–A3) and those that relate to task-switching in mixed blocks (B1–B10). Table 1 shows the percentage of simulations with each of these properties. Operationally, property B2 (switch costs confined to the first trial in a run) was defined as a reduction in RT between the first and the second nonswitch trial that amounted to less than 6.5% of the reduction in RT between the switch trial and the second nonswitch trial, averaged over both tasks (this is approximately the reduction shown by the model with its standard parameter settings). Property B10 was satisfied if switch costs were reduced by a 30-cycle preparation interval.
Binomial tests showed that the models with random parameter settings were more likely have each of these properties than not (p⬍.0001 for every phenomenon). Thus, these phenomena are simulated by the model because its architecture and general processing principles are predisposed toward them rather than as a result of manipulation of the parameter settings.3
Only two of the task-switching phenomena are shown by less than 90% of the models—switch costs confined to the first trial of a run (property B2, shown by 73% of the models) and paradoxical asymmetric switch costs (property B3, shown by 77% of the models). Interestingly, both of these phenomena have not always been reported in the empirical literature (see Meiran et al., 2000, and Salthouse et al., 1998, for evidence that switch costs need not be confined to the first trial of a run; and Monsell et al., 2000, for evidence that switch costs need not be ‘‘paradoxically’’ asymmetrical). Thus, the phenomena that the models with random parameter settings are least likely to produce are also those which have not always been observed in the empirical data. In order to further investigate the model’s simulation of switch costs being confined to the first trial in a run, we generated a frequency histogram of the drop in reaction time from the first to the second nonswitch trial, as a percentage of the drop in reaction time from the switch trial to the second nonswitch trial (Fig. 9). As the figure shows, the majority of simula-tions were in the bars representing 0–3% and 3–6%, indicating that there was generally little or no further drop in reaction time from the first to the
3Only a subset of the parameter space was tested, in accordance with the assumption that
FIG. 9. Frequency histogram of the reduction in reaction time from the first to the second nonswitch trial, as a percentage of the reduction from the switch trial to the second nonswitch trial.
second nonswitch trial (as found by Rogers & Monsell, 1995). However, there were some simulations that showed a larger drop in reaction time be-tween nonswitch trials, and a few that showed an increase in reaction time from the first to the second nonswitch trial.
Parameter Settings and Asymmetric Switch Costs
FIG. 10. Differences between the color and word tasks in top-down control input and pathway strength for models showing a paradoxical and a nonparadoxical asymmetry of switch costs. Error bars represent standard error of the mean.
be produced by the combination of a relatively small difference in top-down control input for the two tasks and a relatively large difference in pathway strength.
The effect of top-down control input on asymmetric switch costs makes sense in terms of the earlier explanation of asymmetric switch costs. Since switch trials are slowed by the need to reconfigure the state of the task de-mand units, a smaller top-down control input will lead to slower reconfigura-tion of the task demand units and therefore larger switch costs. Thus, a large difference in the level of top-down control input for the two tasks, favoring the color task, will lead to larger switch costs in the word than the color task. But this is clearly not the full explanation of asymmetric switch costs. If the only reason for asymmetric switch costs were the difference in top-down control inputs for the two tasks, we would expect the paradoxical asymmetry every time, since the top-down control input is always larger for the color task.
Thus, the effect of an inappropriate state of activation in the task demand units (the cause of switch costs in the model) is greater for the nondominant than the dominant task. It appears that the balance between these two forms of asymmetry in task strength is largely responsible for the nature of the asymmetric switch costs.
An experiment by Yeung (1999; also described in Monsell et al., 2000) has provided results in line with the model’s prediction that nonparadoxical asymmetric switch costs should be associated with a small difference in top-down control input between the two tasks. In this experiment, subjects again switched between word-reading and color-naming tasks. A black color-word was displayed on a colored rectangle, following the procedure of Glaser and Glaser (1982). When the word and colored background were presented si-multaneously on each trial, a paradoxical asymmetry was obtained, with larger switch costs for the word task. But when the word was presented 320 ms after the appearance of the colored background on each trial, the asymmetry in switch costs was reversed. Yeung (1999) suggests that this procedure reduces the difference in top-down control input between the two tasks, leading to a nonparadoxical asymmetry of switch costs. This is exactly in line with the predictions of the model.
DISCUSSION
Comparison with Other Models
Norman and Shallice (1986). Norman and Shallice (1986) have also
pro-duced a model of the processes involved in the selection of routine and non-routine actions (see also Cooper & Shallice, 2000; Shallice, 1982, 1988, 1994). Although it was not designed with the task-switching paradigm in mind, the Norman–Shallice model has a great deal in common with the model presented in this article. According to the Norman–Shallice model, behavior is controlled by ‘‘schemata,’’ which select and coordinate the ele-mentary processes involved in simple cognitive tasks. Individual schemata can become selected in two ways: They can be triggered by environmental cues, following which a process called ‘‘contention scheduling’’ selects the most active schema for the control of action. This is appropriate in routine circumstances where environmental cues are sufficient to determine behav-ioral responses. But in circumstances requiring the overriding of prepotent responses to environmental cues, or in novel situations where there are no learned associations between environmental cues and behavioral responses available, the ‘‘supervisory attentional system’’ (SAS) biases the contention scheduling process by providing a top-down input favoring the appropriate schema (and/or inhibiting unwanted schemata). The elements of this theory can easily be mapped onto elements of the model presented in this article: Schemata correspond to the task demand units, the environmental triggering of schemata corresponds with the connections that form between the stimulus input units and the task demand units, and the SAS corresponds with the top-down control input into the task demand units.
However, one apparent discrepancy is that, whereas in the standard ver-sion of the theory the SAS is only operative when nonroutine behavior is required, the top-down control input into the task demand units is always present. Thus, the model presented in this article does not entail a strict divi-sion between routine behavior mediated by contention scheduling and non-routine behavior which also requires the SAS. The model is equally consis-tent with other models where there is a single action-controlling hierarchy (e.g., Schwartz, Reed, Montgomery, Palmer, & Mayer, 1991)—the top-down control input into the task demand units may reflect an input from higher level to lower level schemata.
Extra process accounts of switch costs. As discussed in the introduction,
reported so far. The crucial difference between the model presented in this article and the ‘‘extra process’’ models discussed above is that, in the present model, precisely the same computational processes occur on switch and non-switch trials. The only difference between the two types of trial is in the initial state of the network. Thus, the switch cost does not measure the dura-tion of any distinct process.
Note that it is quite possible that, at least on some occasions, additional processes may take place on switch trials. For example, a time-consuming process of retrieving the now-appropriate task from memory may occur more often on switch trials in some circumstances (Mayr & Kliegl, 2000). Indeed, one could examine the behavior of the model when such additional assump-tions are made. However, we have demonstrated above that such extra pro-cesses on switch trials are not necessary to explain the switch cost.
Yeung (1999). Yeung (1999) has recently put forward a task carryover
model of switch costs. Although very different in implementation, this model is very similar to the present one at a deeper theoretical level.4 As in the current model, Yeung’s model simulates switch costs as an extended re-sponse selection process resulting from a carryover of task set, although Yeung’s model incorporates separate response activation and response reso-lution stages rather than the single response selection stage that takes place in our model. Yeung’s model, like ours, explains paradoxical asymmetric switch costs in terms of a greater top-down control input for the nondominant task. Unlike our model, however, the carryover of task set is identical every time the subject switches task (it is a constant added to the ‘‘readiness’’ of the most recently performed task). One further difference is that there is no mechanism for stimulus-driven retrieval of task set in this model, although it could presumably be accommodated by a small extension of the model. Yeung’s model is implemented as a set of mathematical equations relating reaction time to theoretical variables such as ‘‘task readiness.’’ These equa-tions are intended to be ‘‘descriptive rather than explanatory with respect to the nature of the response selection process.’’ By implementing our model in a PDP network, we aim to make the computational principles that may underlie the behavioral effects of task-switching more explicit.
Concluding Comments
The model presented in this article implements the idea that switch costs reflect an interference effect caused by a carryover of task set. We have shown that this account can provide explanations for a large body of empiri-cal data. In general, supporters of alternative explanations of switch costs have not provided quantitative predictions for this empirical data and so it is difficult to evaluate the ability of other theories to explain the effects simu-lated by the model. One exception to this is the model put forward by Kieras,
Meyer, Ballas, and Lauber (2000). Kieras et al. have implemented the extra process account proposed by Rubinstein et al. (2001), using the EPIC archi-tecture (see, e.g., Meyer & Kieras, 1997, 1999). However, this model has so far only been used to simulate a small set of data, from an unpublished study by Lauber (1995), making direct comparison with our model difficult. Meiran (2000a) has also put forward an explicit computational model of task switching. Again, the nature of the model and the data it is used to simulate make it difficult to compare our models directly.