warwick.ac.uk/lib-publications
Original citation:
Eyre, Robert W., House, Thomas, Hill, Edward M. and Griffiths, Frances E.. (2017) Spreading
of components of mood in adolescent social networks. Royal Society Open Science, 4 (9).
170336.
Permanent WRAP URL:
http://wrap.warwick.ac.uk/92511
Copyright and reuse:
The Warwick Research Archive Portal (WRAP) makes this work of researchers of the
University of Warwick available open access under the following conditions.
This article is made available under the Creative Commons Attribution 4.0 International
license (CC BY 4.0) and may be reused according to the conditions of the license. For more
details see:
http://creativecommons.org/licenses/by/4.0/
A note on versions:
The version presented in WRAP is the published version, or, version of record, and may be
cited as it appears here.
rsos.royalsocietypublishing.org
Research
Cite this article:Eyre RW, House T, Hill EM, Griffiths FE. 2017 Spreading of components of mood in adolescent social networks.R. Soc.
open sci.4: 170336.
http://dx.doi.org/10.1098/rsos.170336
Received: 24 April 2017 Accepted: 21 August 2017
Subject Category: Biology (whole organism)
Subject Areas:
health and disease and epidemiology
Keywords:
social contagion, emotional contagion, depression, mood
Author for correspondence: Robert Eyre
e-mail:[email protected]
Electronic supplementary material is available online at https://dx.doi.org/10.6084/m9. figshare.c.3872164.
Spreading of components
of mood in adolescent
social networks
Robert W. Eyre
1
, Thomas House
4
, Edward M. Hill
1,2
and
Frances E. Griffiths
3,5
1Centre for Complexity Science, Zeeman Building,2Zeeman Institute: Systems Biology
and Infectious Disease Epidemiology Research (SBIDER), and3Warwick Medical
School, University of Warwick, Coventry CV4 7AL, UK
4School of Mathematics, University of Manchester, Oxford Road, Manchester
M13 9PL, UK
5Centre for Health Policy, University of the Witwatersrand, Johannesburg, South Africa
RWE,0000-0001-7001-9469; TH,0000-0001-5835-8062; EMH,0000-0002-2992-2004
Recent research has provided evidence that mood can spread over social networks via social contagion, but that, in seeming contradiction to this, depression does not. Here, we investigate whether there is evidence for the individual components of mood (such as appetite, tiredness and sleep) spreading through US adolescent friendship networks while adjusting for confounding by modelling the transition probabilities of changing mood state over time. We find that having more friends with worse mood is associated with a higher probability of an adolescent worsening in mood and a lower probability of improving, and vice versa for friends with better mood, for the overwhelming majority of mood components. We also show, however, that this effect is not strong enough in the negative direction to lead to a significant increase in depression incidence, helping to resolve the seeming contradictory nature of existing research. Our conclusions, therefore, link in to current policy discussions on the importance of subthreshold levels of depressive symptoms and could help inform interventions against depression in high schools.
1. Background
Depression and other associated mood disorders form an increasing burden upon the health of modern society. The World Health Organization estimates that 350 million people are affected by depression throughout the world, leading to morbidity through a reduced ability to work and socialize, as well as mortality due to suicide and other causes [1]. Evidence suggests
2
rsos
.ro
yalsociet
ypublishing
.or
g
R.
Soc
.open
sc
i.
4
:1
70336
...
mood may spread from person to person via a process known associal contagion. Previous studies have
found social support and befriending to be beneficial to mood disorders in adolescents [2–5], while recent experiments suggest that an individual’s emotional state can be affected by exposure to the emotional expressions of social contacts [6]. Clearly, a greater understanding of how changes in the mood of adolescents are affected by the mood of their friends would be beneficial in informing interventions tackling adolescent depression.
In recent years, evidence has been found to suggest that some behaviour-based illnesses, such as obesity and smoking cessation, can spread from person to person via social contagion [7–15]. However, such work has come under criticism for being unable to distinguish contagion from other possible phenomena that could confound any positive findings of contagion [16–19]. The two simplest confounding phenomena are homophily, where individuals become friends due to sharing the same behaviour, and shared context, where individuals tend towards the same behaviour whether they are friends or not due to some outside influence [16].
Three of the authors of the current work recently developed a model that distinguishes contagion from homophily and shared context. In this approach, we assess statistically whether the probability of an individual changing between binary states over time forms a better fit to the data when risk is stratified by the number of same or opposing state friends the individual has, or when risk is independent of the state of the individuals friends [20]. This showed that while healthy mood spreads, depression does not, although treating a complex set of mood states as either ‘ill’ or ‘not ill’ can be an oversimplification. Doing this in the case of depression ignores all individuals with subthreshold levels of depressive symptoms, despite their public-health importance [21].
Further, individual component symptoms of depression have not to our knowledge been considered when modelling social contagion, despite being much easier to measure and track in certain cases. These may provide an alternative basis for formulating future interventions. In this study, we, therefore, consider the possibility of social influence upon mood by considering arrays of possible mood states. We first generalize our confounding-robust model to non-binary states, than apply it to data from the National Longitudinal Study of Adolescent to Adult Health (Add Health) [22]. We do this for mood as a whole and for the following seven potential depressive symptoms: anhedonia (loss of interest), poor appetite, poor concentration, dysphoria (sadness), helplessness, tiredness and worthlessness. In general, both high and low values of these measures exhibit social contagion. We also introduce a complementary Gaussian process model that helps to demonstrate why these results are consistent with the observation that depression does not spread in social networks. To conclude, we discuss the possible implications of our results to public policy and health.
2. Material and methods
2.1. Data
We used data from the first two waves of the in-home interview survey of Add Health, which were performed 6–12 months apart. These included records of adolescents’ in-school friends [22]. We defined the mood state of each individual in our study using their Centre for Epidemiological Studies Depression scale (CES-D) score calculated from the set of 18 CES-D questions asked within the survey [23]. This gave a discrete integer mood state for each individual ranging from 0 to 54, where a higher state indicated a worse mood.
To analyse individual depressive symptoms, we split the total CES-D score into composite parts associated with the subsets of questions related to each symptom. The symptoms analysed were anhedonia (loss of interest), poor appetite, poor concentration, dysphoria (sadness), helplessness, tiredness and worthlessness. The range of states depended on the number of questions related to that symptom. Some, such as poor appetite, only ranged between 0 and 3 while others, such as helplessness, ranged between 0 and 15. In these cases a higher state indicated a worse case of that symptom.
3
rsos
.ro
yalsociet
ypublishing
.or
g
R.
Soc
.open
sc
i.
4
:1
70336
...
2.2. Contagion model
If we let a component of mood for an individual at timetwithkfriends with better mood andkfriends
with worse mood be represented by an integer random variableX(t), we can imagine a very general
probabilistic model for mood in which
Pr(X(t+1)=x|X(t)=x)=f(x,x,k,k). (2.1)
In practice, finding an appropriate functionf for such a general model becomes too difficult and so we
will normally need to consider special cases of this general model. In our earlier work [20], we considered
only binary statesX(t)=Dfor an individual with depressive symptoms at timetandX(t)=Nfor a
non-depressed (healthy) individual, and sought to distinguish between sigmoidal dependence on the number of friends in a given state and no such dependence.
Such an approach is robust to confounding from homophily and shared context due to the stratification of the state transition probability over time by the number of contagious state friends, but it does not account for the possibility of different numerical scores for the CES-D components. To relax this
assumption we now letX(t) be an integer, and consider a trinomial model specified by three probabilities:
the probability of increasing state, the probability of decreasing state and the probability of remaining in the same state.
Pr(Xi(t+1)>Xi(t))=p,
Pr(Xi(t+1)<Xi(t))=q
and Pr(Xi(t+1)=Xi(t))=1−p−q.
⎫ ⎪ ⎪ ⎬ ⎪ ⎪
⎭ (2.2)
We examined whether these probabilities were dependent on the states of an individual’s friends relative
to their own at the first time point by comparing two different functional forms forpandq. The first was
conditioned on the number of friends of an individual who had better/worse mood at the first time point,
k. This took the form of a discrete S-shaped (sigmoidal) function, appropriate for behavioural contagion
being a type of complex contagion [15,24,25], with the following mathematical formulation:
pk=α+β k
l=0
10 l
γl(1−γ)1−l
and qk=δ+
k
l=0
10 l
ζl(1−ζ)1−l.
⎫ ⎪ ⎪ ⎪ ⎪ ⎪ ⎪ ⎬ ⎪ ⎪ ⎪ ⎪ ⎪ ⎪ ⎭
(2.3)
The second functional form forpandqwas independent of the states of the friends:
pk=α and qk=δ. (2.4)
Using each possible combination of these two functional forms gave us four models to compare. Model
1, wherepkandqkare given by (2.3), has both increasing and decreasing state being dependent on friend
states. Model 2, wherepk andqk are given by (2.4), has neither increasing nor decreasing state being
dependent on friend states. Model 3, wherepkis given by (2.3) andqkby (2.4), has increasing state alone
being dependent on friend states. Model 4, wherepkis given by (2.4) andqkby (2.3), has decreasing
state alone being dependent on friend states. These models, with separate model variants conditioned either on higher scoring friends or lower scoring friends, were each fitted to the Add Health data using maximum-likelihood estimation (MLE) with likelihood functions of the form
L(α,δ,. . .)= i
Pr(Xi(t+1)| {Xj(t)}), (2.5)
(the precise form in terms ofpkandqkcan be found in the electronic supplementary material). Competing
models were compared using their Akaike information criterion (AIC) values in order to find the preferred model in each case [26]. Sensitivity of these results when applying different thresholds for which the mood of two individuals (or the same individual at two different time points) was considered
equal were then analysed, i.e. at what values must i= |Xi(t+1)−Xi(t)|and ij= |Xi(t)−Xj(t)|be
greater than to indicate that individualihas changed mood and individualihas different mood from
individualj, respectively.
4
rsos
.ro
yalsociet
ypublishing
.or
g
R.
Soc
.open
sc
i.
4
:1
[image:5.522.65.466.40.359.2]70336
...
0 0.1 0.2 0.3 0.4 0.5 0.6 0.7 0.8 0.9 1.0
0 1 2 3 4 5 6 7 8 9 10
no. worse off friends, k
probability of worsening,
pk
0 0.1 0.2 0.3 0.4 0.5 0.6 0.7 0.8 0.9 1.0
0 1 2 3 4 5 6 7 8 9 10
no. better off friends, k
probability of worsening,
pk
0 0.1 0.2 0.3 0.4 0.5 0.6 0.7 0.8 0.9 1.0
0 1 2 3 4 5 6 7 8 9
probability of improving,
qk
10 no. worse off friends, k
0 0.1 0.2 0.3 0.4 0.5 0.6 0.7 0.8 0.9 1.0
0 1 2 3 4 5 6 7 8 9 10
no. better off friends, k
probability of improving,
qk
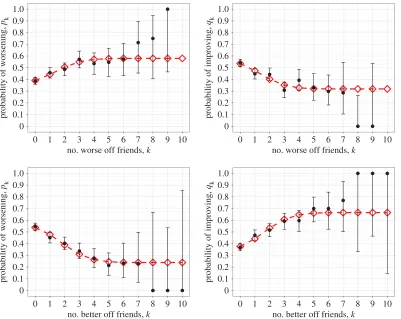
Figure 1.Probability of changing mood state as a function of either the number of better mood (lower state) friends or the number of worse mood (higher state) friends. Observed data (black circles) are shown with 95% CIs alongside the results of fitting (red diamonds) the state change model to the Add Health data. Four possible models, with increasing and decreasing state each being either dependent or independent on the number of higher or lower state friends, were fitted to the data. The preferred model in this case for both better mood and worse mood friends had both increasing and decreasing state being dependent (parameter values provided intable 1and AIC values in electronic supplementary material, Table S1).
2.3. Gaussian process model
The model described above deals with the probability of a change of stateX(t)→X(t+1) given a number
kof better or worse scoring friends. We might instead assume that the initial stateX(t) and the state at
the next time pointX(t+1) are known and treat the number of friendsk(either better or worse) as the
random variable to be modelled. As we will see, the data in this form is very noisy and so we smooth the
functionk(X(t),X(t+1)) using Gaussian process regression [27]. This semi-parametric statistical method
allows patterns in the data to become manifest without imposing too mucha prioristructure on the
model. More detail is given in the electronic supplementary material.
3. Results and discussion
In the case of overall mood (i.e. the total CES-D score) for both conditioning on higher state and on lower state friends the preferred model turns out to be Model 1 where both increasing and decreasing
state are dependent on the friends’ states (figure 1andtable 1). This leads to the conclusion that, for US
adolescents, the greater number of worse mood friends they have the more likely they are to get worse in mood and the less likely they are to get better, and vice versa for better mood friends. The fact that mood is influenced socially by both worse and better mood friends in this way gives support to social contagion of mood.
The sensitivity analysis examining the effect of applying different thresholds for which the mood
of two individuals (or the same individual at two different time points) is considered equal,ijand
5
rsos
.ro
yalsociet
ypublishing
.or
g
R.
Soc
.open
sc
i.
4
:1
70336
...
0 0.1 0.2 0.3 0.4 0.5 0.6 0.7 0.8 0.9 1.0
0 1 2 3 4 5 6 7 8 9 10
no. worse off friends, k
probability of worsening,
pk
0 0.1 0.2 0.3 0.4 0.5 0.6 0.7 0.8 0.9 1.0
0 1 2 3 4 5 6 7 8 9 10
no. better off friends, k
probability of worsening,
pk
0 0.1 0.2 0.3 0.4 0.5 0.6 0.7 0.8 0.9 1.0
0 1 2 3 4 5 6 7 8 9 10
no. worse off friends, k
probability of improving,
qk
0 0.1 0.2 0.3 0.4 0.5 0.6 0.7 0.8 0.9 1.0
0 1 2 3 4 5 6 7 8 9 10
no. better off friends, k
probability of improving,
qk
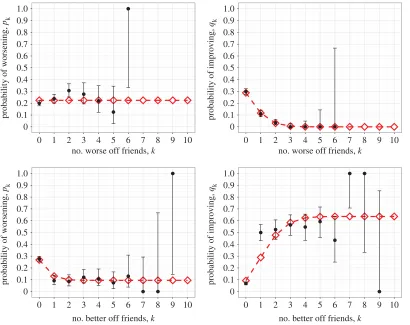
Figure 2.Probability of changing helplessness state as a function of either the number of less helpless (lower state) friends or the number of more helpless (higher state) friends. Observed data (black circles) are shown with 95% CIs alongside the results of fitting (red diamonds) the state change model to the Add Health data. Four possible models, with increasing and decreasing state each being either dependent or independent on the number of higher or lower state friends, were fitted to the data. The preferred model in this case for both less helpless and more helpless friends had both increasing and decreasing state being dependent. Most other depressive symptoms had similar results (parameter values provided intable 2and AIC values in electronic supplementary material, Table S2).
Table 1.Fitted parameter values for the preferred model of mood state change, with upper and lower values for their 95% CIs calculated using the asymptotic normality of maximum-likelihood estimates.
worse mood friends model better mood friends model
parameter value lower limit upper limit value lower limit upper limit
α 0.3718 0.3227 0.4208 0.5556 0.5146 0.5967
. . . .
β 0.2079 0.1442 0.2715 −0.3166 −0.3801 −0.2531
. . . .
γ 0.2120 0.1048 0.3193 0.2497 0.1785 0.3209
. . . .
δ 0.5579 0.5075 0.6083 0.3545 0.3112 0.3977
. . . .
−0.2391 −0.3012 −0.1771 0.3108 0.2460 0.3756
. . . .
ζ 0.2090 0.1176 0.3004 0.2337 0.1608 0.3065
. . . .
selected as the preferred model, and therefore evidence of general mood contagion disappearing from the analysis, was 10. Note that under these conditions the majority of individuals are set as never changing mood and most as being the same mood. This indicates that the finding from the baseline analysis is robust against possible noise in the data, and that support is indeed given to general contagion of mood. Similar results were found for the individual depressive symptoms of anhedonia, poor concentration,
dysphoria, helplessness, tiredness and worthlessness (seefigure 2andtable 2for helplessness, further
6
rsos
.ro
yalsociet
ypublishing
.or
g
R.
Soc
.open
sc
i.
4
:1
[image:7.522.61.471.40.365.2] [image:7.522.54.469.494.624.2]70336
...
0 0.1 0.2 0.3 0.4 0.5 0.6 0.7 0.8 0.9 1.0
0 1 2 3 4 5 6 7 8 9 10
no. worse off friends, k
probability of worsening,
pk
0 0.1 0.2 0.3 0.4 0.5 0.6 0.7 0.8 0.9 1.0
0 1 2 3 4 5 6 7 8 9 10
no. better off friends, k
probability of worsening,
pk
0 0.1 0.2 0.3 0.4 0.5 0.6 0.7 0.8 0.9 1.0
0 1 2 3 4 5 6 7 8 9 10
no. worse off friends, k
probability of improving,
qk
0 0.1 0.2 0.3 0.4 0.5 0.6 0.7 0.8 0.9 1.0
0 1 2 3 4 5 6 7 8 9 10
no. better off friends, k
probability of improving,
qk
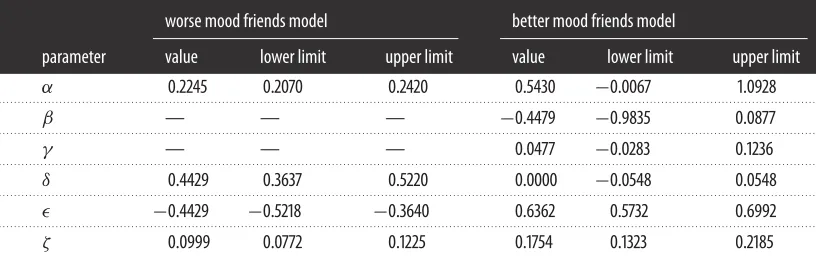
Figure 3.Probability of changing appetite state as a function of either the number of better appetite (lower state) friends or the number of worse appetite (higher state) friends. Observed data (black circles) are shown with 95% CIs alongside the results of fitting (red diamonds) the state change model to the Add Health data. Four possible models, with increasing and decreasing state each being either dependent or independent on the number of higher or lower state friends, were fitted to the data. The preferred model in this case for better appetite friends had both increasing and decreasing state being dependent. For worse appetite friends, it had decreasing state alone being dependent (parameter values provided intable 3and AIC values in electronic supplementary material, Table S2).
Table 2.Fitted parameter values for the preferred model of helplessness state change, with upper and lower values for their 95% CIs calculated using the asymptotic normality of maximum-likelihood estimates.
worse mood friends model better mood friends model
parameter value lower limit upper limit value lower limit upper limit
α 0.2772 0.2240 0.3305 0.5423 0.4949 0.5897
. . . .
β 0.2940 0.2296 0.3584 −0.4074 −0.4625 −0.3523
. . . .
γ 0.1889 0.1132 0.2646 0.2096 0.1597 0.2596
. . . .
δ 0.5394 0.4890 0.5898 0.2415 0.1990 0.2841
. . . .
−0.3743 −0.4320 −0.3167 0.4591 0.3956 0.5226
. . . .
ζ 0.2009 0.1459 0.2559 0.2215 0.1720 0.2710
. . . .
table 3). In this instance we found that Model 4 was preferred, where decreasing state alone is affected by friend states, although we caution against over-interpretation of this result since AIC is not an infallible method for model selection. In all cases, no models were rejected under the goodness-of-fit tests (details in the electronic supplementary material).
Although the results (figures1–3and the further results shown in the electronic supplementary
7
rsos
.ro
yalsociet
ypublishing
.or
g
R.
Soc
.open
sc
i.
4
:1
[image:8.522.59.467.74.202.2]70336
...
Table 3.Fitted parameter values for the preferred model of appetite state change, with upper and lower values for their 95% CIs calculated using the asymptotic normality of maximum-likelihood estimates.
worse mood friends model better mood friends model
parameter value lower limit upper limit value lower limit upper limit
α 0.2245 0.2070 0.2420 0.5430 −0.0067 1.0928
. . . .
β — — — −0.4479 −0.9835 0.0877
. . . .
γ — — — 0.0477 −0.0283 0.1236
. . . .
δ 0.4429 0.3637 0.5220 0.0000 −0.0548 0.0548
. . . .
−0.4429 −0.5218 −0.3640 0.6362 0.5732 0.6992
. . . .
ζ 0.0999 0.0772 0.1225 0.1754 0.1323 0.2185
. . . .
by the lack of data in these regions) most conclusions that could be inferred from these shapes would not be particularly robust. Yet they do appear to highlight the absence of thresholds on the number of friends exhibiting a worse or better mood to result in a contagion effect, which is unusual for complex contagion.
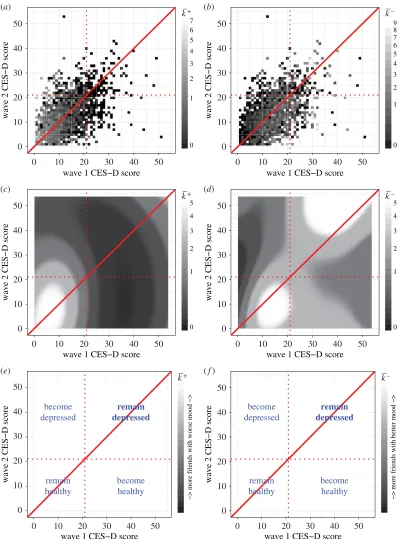
These results superficially contradict our earlier work finding that healthy mood spreads while depression does not [20]. However, our Gaussian process model shows that most of the individuals with a greater number of higher scoring friends who were initially below the threshold for depression remained that way at the second time point, while the individuals with a greater number of lower scoring friends are more spread out in their score combinations such that many that started off above the threshold for depression passed below the threshold at the second time point (figure 4). This suggests that both better and worse moods are contagious, but while better mood is contagious enough to push individuals over the boundary from depressed to not depressed, worse mood is not contagious enough to push individuals into becoming depressed. Consequently, we would not expect to find contagion-like characteristics for depression using a binary model.
We, therefore, observe a difference between depression, which we found not to spread, and relatively low mood below the threshold for depression, which we found did spread. This supports the view that there is more to clinical depression than simply low mood (although the latter may be indicative of the former). It is also in keeping with a tendency for a reduction in the normal social interactions that lead to spreading of mood during an episode of depression [28].
Of existing studies by other authors, the work of Hillet al.[7] is closest to ours, and using a different
dataset these authors concluded that ‘neutral’ moods did not spread but both ‘content’ (threshold CES-D score 12 on the positively worded questions only) and ‘discontent’ (threshold CES-D score 16) moods
did. This work tested models of the formpk=α+βkusing an ordinary least-squares fitting approach,
selecting a spreading model if thep-value for a slope-free null hypothesis is under 0.05. While we argue
that our methodology using a complex contagion of the form (2.3), maximum-likelihood estimation and information-theoretic model selection is preferable to such an approach, we believe that the most important difference with the results presented here is our use of a CES-D threshold score of 20 (or 21) for presumptive depression—and in particular that the spreading of ‘discontent’ at CES-D scores in the 16–20 range is consistent with our results about the spreading of subthreshold levels of depressive symptoms.
The results found here can inform public health policy and the design of interventions against depression in adolescents. Subthreshold levels of depressive symptoms in adolescents is an issue of great current concern as they have been found to be very common, to cause a reduced quality of life and to lead to greater risk of depression later on in life than having no symptoms at all [29–31]. Understanding that these components of mood can spread socially suggests that while the primary target of social interventions should be to increase friendship because of its benefits in reducing of the risk of depression, a secondary aim could be to reduce spreading of negative mood.
8
rsos
.ro
yalsociet
ypublishing
.or
g
R.
Soc
.open
sc
i.
4
:1
70336
... 0 10 20 30 40 500 10 20 30 40 50
wave 1 CES−D score
wave 2 CES−D score
0 1 2 3 4 5 6 7 k–+ (a)
0 10 20 30 40 50
0 10 20 30 40 50
wave 1 CES−D score
wave 2 CES−D score
0 1 2 3 4 5 6 7 8 9
(b)
0 10 20 30 40 50
0 10 20 30 40 50
wave 1 CES−D score
wave 2 CES−D score
0 1 2 3 4 5
(c)
0 10 20 30 40 50
0 10 20 30 40 50
wave 1 CES−D score
wave 2 CES−D score
0 1 2 3 4 5
(d)
0 10 20 30 40 50
0 10 20 30 40 50
wave 1 CES−D score
wave 2 CES−D score
(e)
0 10 20 30 40 50
0 10 20 30 40 50
wave 1 CES−D score
wave 2 CES−D score
(f)
k––
k–+ k––
−> more friends with worse mood −>
k–+
−> more friends with better mood −>
k––
remain depressed become healthy remain healthy become depressed remain depressed become healthy remain healthy become depressed
9
rsos
.ro
yalsociet
ypublishing
.or
g
R.
Soc
.open
sc
i.
4
:1
70336
...may also not be complete. However, as the majority of individuals failed to list the maximum number of friends allowed this implies the network may in fact approach completeness.
We anticipate that future work can further enhance these models in order to cope with a wider range of datasets and more realistically reflect the mechanisms underlying social contagion. Furthermore, we hope that these insights can be used to drive improvements in public health policy and practice.
Ethics. Add Health participants provided written informed consent for participation in all aspects of Add Health in accordance with the University of North Carolina School of Public Health Institutional Review Board guidelines, which are based on the Code of Federal Regulations on the Protection of Human Subjects (45 CFR 46; see:
http://www.hhs.gov/ohrp/humansubjects/guidance/45cfr46.html).
Data accessibility. The data analysed in this study were obtained on licence from Add Health. Requests for restricted-use data access can be made to Add Health at: http://www.cpc.unc.edu/projects/addhealth/contracts or at
Authors’ contributions. F.E.G. and T.H. planned the study and secured the data. R.W.E. performed the numerical data analysis and prepared the manuscript and electronic supplementary material. F.E.G., T.H. and E.M.H. contributed to advising on the analysis and editing the manuscript and electronic supplementary material. All authors gave final approval for publication.
Competing interests. The authors declare that they have no competing interests.
Funding. R.W.E., T.H. and E.M.H. are supported by the Engineering and Physical Sciences Research Council (grants EP/I01358X/1 and EP/N033701/1). The Add Health study was funded by grant no. P01-HD31921 from the Eunice Kennedy Shriver National Institute of Child Health and Human Development, with cooperative funding from 23 other federal agencies and foundations. No direct support was received from grant P01-HD31921 for this analysis. The funders had no role in the development of the research question, analysis of the data, decision to publish, or preparation of the manuscript.
Acknowledgements. This research uses data from Add Health, a programme project directed by Kathleen Mullan Harris and designed by J. Richard Udry, Peter S. Bearman and Kathleen Mullan Harris at the University of North Carolina at Chapel Hill. Special acknowledgement is due Ronald R. Rindfuss and Barbara Entwisle for assistance in the original design. The authors thank Robert Gouldie for R code.
References
1. WHO. Depression—fact sheet no. 369. See http://www.who.int/mediacentre/factsheets/ fs369/en/(accessed 27 July 2015).
2. Dean A, Ensel WM. 1982 Modelling social support, life events, competence, and depression in the context of age and sex.J. Community Psychol.10, 392–408.(doi:10.1002/1520-6629(198210)10:4 <392::AID-JCOP2290100409>3.0.CO;2-2) 3. Ueno K. 2005 The effects of friendship networks on
adolescent depressive symptoms.Soc. Sci. Res.34, 484–510. (doi:10.1016/j.ssresearch.2004.03.002) 4. Rueger SY, Malecki CK, Demaray MK. 2010
Relationship between multiple sources of perceived social support and psychological and academic adjustment in early adolescence: comparisons across gender.J. Youth Adolesc.39, 47–61. (doi:10.1007/s10964-008-9368-6)
5. Mead N, Lester H, Chew-Graham C, Gask L, Bower P. 2010 Effects of befriending on depressive symptoms and distress: systematic review and meta-analysis.
Br. J. Psychiatry196, 96–101. (doi:10.1192/bjp.bp. 109.064089)
6. Kramer AD, Guillory JE, Hancock JT. 2014 Experimental evidence of massive-scale emotional contagion through social networks.Proc. Natl Acad. Sci. USA111, 8788–8790. (doi:10.1073/pnas.13200 40111)
7. Hill AL, Rand DG, Nowak MA, Christakis NA. 2010 Emotions as infectious diseases in a large social network: the SISa model.Proc. R. Soc. B277, 3827–3835. (doi:10.1098/rspb.2010.1217) 8. Christakis NA, Fowler JH. 2013 Social contagion
theory: examining dynamic social networks and
human behavior.Stat. Med.32, 556–577. (doi:10.1002/sim.5408)
9. Ali MM, Amialchuk A, Gao S, Heiland F. 2012 Adolescent weight gain and social networks: is there a contagion effect?Appl. Econ.44, 2969–2983. (doi:10.1080/00036846.2011.568408) 10. Christakis NA, Fowler JH. 2007 The spread of obesity
in a large social network over 32 years.New Engl. J. Med.357, 370–379. (doi:10.1056/NEJMsa066082) 11. Christakis NA, Fowler JH. 2008 The collective
dynamics of smoking in a large social network.New Engl. J. Med.358, 2249–2258. (doi:10.1056/NEJMsa 0706154)
12. Hill AL, Rand DG, Nowak MA, Christakis NA. 2010 Infectious disease modeling of social contagion in networks.PLoS Comput. Biol.6, e1000968. (doi:10.1371/journal.pcbi.1000968)
13. Fowler JH, Christakis NA. 2008 Dynamic spread of happiness in a large social network: longitudinal analysis over 20 years in the Framingham Heart Study.Br. Med. J.337, a2338. (doi:10.1136/bmj. a2338)
14. Balbo N, Barban N. 2014 Does fertility behavior spread among friends?Am. Sociol. Rev.79, 412–431. (doi:10.1177/0003122414531596)
15. Centola D. 2010 The spread of behavior in an online social network experiment.Science329, 1194–1197. (doi:10.1126/science.1185231)
16. Lyons R. 2011 The spread of evidence-poor medicine via flawed social-network analysis.Stat. Politics Policy2, 124. (doi:10.2202/2151-7509.1024) 17. Cohen-Cole E, Fletcher JM. 2008 Detecting
implausible social network effects in acne, height,
and headaches: longitudinal analysis.Br. Med. J.
337, a2533. (doi:10.1136/bmj.a2533) 18. Thomas A. 2013 The social contagion hypothesis:
comment on ‘Social contagion theory: examining dynamic social networks and human behavior’.
Stat. Med.32, 581–590. (doi:10.1002/sim.5551) 19. Aral S, Muchnik L, Sundararajan A. 2009
Distinguishing influence-based contagion from homophily-driven diffusion in dynamic networks.
Proc. Natl Acad. Sci. USA106, 21544–21549. (doi:10.1073/pnas.0908800106)
20. Hill EM, Griffiths FE, House T. 2015 Spreading of healthy mood in adolescent social networks.Proc. R. Soc. B282, 20151180. (doi:10.1098/rspb.2015. 1180)
21. Das-Munshi J, Goldberg D, Bebbington PE, Bhugra DK, Brugha TS, Dewey ME, Jenkins R, Stewart R, Prince M. 2008 Public health significance of mixed anxiety and depression: beyond current classification.Br. J. Psychiatry
192, 171–177. (doi:10.1192/bjp.bp.107. 036707)
22. Harris Ket al.2015 The National Longitudinal Study of Adolescent to Adult Health: research design. See http://www.cpc.unc.edu/projects/addhealth/ design(accessed 27 July 2015).
23. Radloff LS. 1977 The CES-D scale a self-report depression scale for research in the general population.Appl. Psychol. Meas.1, 385–401. (doi:10.1177/014662167700100306)
10
rsos
.ro
yalsociet
ypublishing
.or
g
R.
Soc
.open
sc
i.
4
:1
70336
...
25. Valente TW. 1996 Social network thresholds in the diffusion of innovations.Soc. Netw.18, 69–89. (doi:10.1016/0378-8733(95)00256-1) 26. Akaike H. 1974 A new look at the statistical model
identification.IEEE Trans. Automat. Control19, 716–723. (doi:10.1109/TAC.1974.1100705) 27. Williams CK, Rasmussen CE. 2005Gaussian processes
for machine learning. Cambridge, MA: MIT Press.
28. Cruwys T, Haslam SA, Dingle GA, Haslam C, Jetten J. 2014 Depression and social identity: an integrative review.Pers. Soc. Psychol. Rev.18, 215–238. (doi:10.1177/1088868314523839)
29. Bertha EA, Balázs J. 2013 Subthreshold depression in adolescence: a systematic review.Eur. Child Adolesc. Psychiatry22, 589–603. ( doi:10.1007/s00787-013-0411-0)
30. McLeod G, Horwood L, Fergusson D. 2016 Adolescent depression, adult mental health and psychosocial outcomes at 30 and 35 years.Psychol. Med.46, 1401. (1412doi:10.1017/S0033291715002950) 31. Klein DN, Glenn CR, Kosty DB, Seeley JR, Rohde P,