3712
Food Stability Analysis In East Java
Lutfi Asnan Qodri, Dwi Wulandari, Hadi Sumarsono
Abstract: Fluctuations in food prices can cause uncertainty about estimated public spending. The purpose of this study is to show the relationship between the price of basic necessities to the total population, the average production amount of community income, and the exchange rate of farmers (NTP) in East Java. Because this matter concerns the interests of all people in meeting their basic needs. The method used is quantitative using the Vector Error Correction Model (VECM). The results can be concluded that Farmer Exchange Rates (NTP) significantly influences the stability of rice and sugar prices in East Java. The population also has a significant influence on the price of cooking oil in East Java.
Keywords: Price of Rice, Price of Sugar, Cooking Oil Prices, Volatility Price, Vector Error Correction Model
—————————— ——————————
1.
INTRODUCTION
Food price stability is one of important things in a country’s economic development. One of the efforts to make good money is through food prices. Controlling food prices is needed to support a stability of prices of basic commodities. Trostle (2008) explains that food prices in the world such as grains and vegetable oil which are the two main commodities in households have experienced a very significant price increase, starting from 2007-2008 has increased prices by 60 percent, this is almost happening in all parts of the world. The situation that occurs in developing countries, especially in Indonesia is different. Furceri et al. (2016) the majority of domestic food production is consumed in the same region, hence the agricultural and weather conditions that occur in the region affect the stability of food prices themselves. Besides these factors, several other factors are market structure, taxes, and subsidies. Arezki et al. (2017) explained that in Africa and Asia the region has its own challenges in maintaining food price stability. Ethiopia has experienced the worst extreme drought in recent years. Rainy weather which is expected to supply more than 80 percent of Ethiopian agricultural output and employ 85 percent of the workforce must be drastically reduced. This is also exacerbated by the impact of the 2015-2016 El-Nino storm in Asia even more severe than in certain locations, such as in the highlands of Cambodia, Central and Southern India, central and Southern Philippines, Central and Northeast Thailand, and Countries other Pacific island nations. Indonesia has a legal regarding policies in the form of Law Number 7 of 1996, Law Number 18 of 2012 concerning food and Law Number 7 of 2014 concerning trade, Minister of Trade Regulation on Management of government rice reserves for price stability article 2 paragraph 1 of 2018. This law is intended to anticipate and serve as the basis for making a policy to control price stability at both the central and regional levels. This policy is aimed at anticipating fluctuating food prices. Because this can be detrimental to producers as suppliers of goods, traders as sellers, and also consumers as buyers of these goods. In addition, the aim is
to reduce fluctuations in food prices on the market. Because when fluctuations are precisely uncontrolled which has an impact on soaring food prices, especially food, which results in a decrease in people's purchasing power. Sari (2010) Problems of increasingly expensive and unpredictable food prices that can have an impact on fluctuations that can increase the risk for traders, consumers, producers and the government. According to Meier and Baldwin (1957); Azizah et al. (2018); Sari (2010) mentioned that an overpopulation will actually be a problem when it cannot be controlled, because if the population continues to increase drastically each year it will have an effect on existing food availability. On the other hand this will have an impact on increasing the number of poor people due to high competition for jobs. Likewise in East Java according to data from Indonesia Statistics East Java Province has a population of 39.3 Million in 2017. By placing Surabaya as the city with the most population. Azizah et al. (2018) population growth in East Java will cause serious problems for welfare and development, so the increase in population must be balanced with the support of good economic growth in order to continue to achieve a food stability as a whole. Trisnowati and Budiwinarto (2013) Income has a positive effect on the proportion of expenditure for rice groups with the greatest elasticity value and is elastic in nature. However, it is inversely proportional to the theory that has been submitted by Engel (2011) states that an increase in income will increase the welfare of the community so that the share of household food consumption expenditure will decrease. The share of food expenditure for rice, chili peppers and shallots has tended to show a good trend because people still use their income to buy these food commodities. According to Prabowo (2014) stated in his research classifying 20 basic commodities, of the top 3 commodities based on the first community expenditure is the commodity of rice, cooking oil, granulated sugar. The three staples are primary commodities for the majority of Indonesian people. Rice commodity is one of the important commodities that has an impact on social, economic and political stability. According to Sari (2010) rice commodity is a major factor that can also affect the stability of prices of other goods. this is the reason why the government established the ―Badan Urusan Logistik‖ (Bulog) at the provincial level and the ―Depot Logistik‖ (Dolog) at the provincial level, this is aimed at managing price stability and availability, especially national rice.
————————————————
Lutfi Asnan Qodri is currently pursuing master program in economics in Universitas Negeri Malang, Indonesia
Dwi Wulandari, Faculty of Economics and Business, Universitas Negeri Malang email: [email protected]
3713
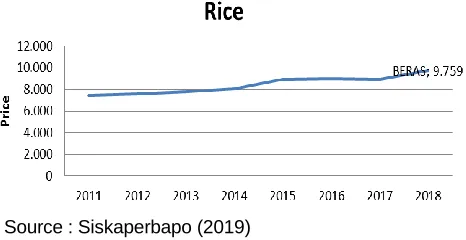
Source : Siskaperbapo (2019)
Figure 1. East Java rice price movements 2011-2018
Based on the Figure 1, it can be seen that the price of rice has a continuous upward trend, recorded starting in 2011 which stood at Rp. 6,500 and at Rp. 9,700.- per kilos in 2018. The price of rice, which is a primary commodity and basic needs for almost the majority of Indonesian people, makes commodities the most important factor among other food commodities. Therefore, it is with cooking oil commodities. Cooking oil ranks second based on public expenditure on basic commodities after rice. Until now, palm oil and coconut oil have become the main raw materials in making cooking oil. Related to the stability of the price of cooking oil in East Java, especially regarding price stability, is one of the focuses of the East Java government's current policy. This aims to maintain the quality of life worthiness of the people of East Java for what is consumed. The government is expected to be able to regulate cooking oil price control regulations to remain stable and affordable.
Source : Siskaperbapo (2019)
Figure 2. Price movements of Edible Oil and Sugar in
East Java 2011-2018
Based on the Figure 2, it can be concluded that the price of domestic cooking oil and sugar is fluctuating. In particular the price of sugar was estimated at Rp. 16,000 in 2016. This caused uncertainty over the increase in selling prices of the Sugar itself. One of the causes of this uncertainty is the important sugar from other countries which is not directly related to domestic sugar. Domestic sugar prices tend to be less competitive in price, foreign sugar production is more effective and modern compared to domestic sugar production. One of the commodities most needed by the people of Indonesia, especially East Java, is Granulated Sugar. East Java people since the Dutch colonial era have been able to produce sugar commodities made from sugar cane. Since the first century, it is estimated that the people of East Java have had a sugar industry. With a very long time span, the
condition of the sugar industry which was originally able to produce independently since 1967 Indonesia actually became an importer of sugar. According to Pambudy (2003) in 1920 Indonesia became one of the largest sugar producers in the world, but ironically it actually declined in the period 1967 until now where that has changed and is inversely proportional. According to Prabowo (2014), the commodity of Rice, Cooking Oil and Sugar is the top three commodities traded by the public so far. From various causes of price fluctuations due to various factors ranging from the total population, the number of factors of production of these goods, the average value of income, the exchange rate of farmers.
2
METHOD
This study uses explanatory research using time series data and from January 2014 to December 2018. This time was chosen because during this time frequent volatility in food price stability, especially in the province of East Java. The data used are sourced from the Information System of Availability and Development of Staples (Siskaperbapo), East Java Agriculture Office and East Java. This study uses explanatory research using time series data and from January 2014 to December 2018. This time was chosen because during this time frequent volatility in food price stability, especially in the province of East Java. The data used is sourced from the Information System of Availability and Development of Staples (Siskaperbapo), the Office of Agriculture in East Java and the Central Statistics Agency of East Java.
Table 1.
Secondary Data Variables and Sources.
No Variable Symbol Source
1 Price of Rice HB Siskaperbapo 2 Price of Cooking Oil HMG Siskaperbapo 3 Price of Sugar HGP Siskaperbapo 4 Total Population JP BPS Jatim 5 Amount of Rice
Production
JPB Dinas Pertanian Jatim
6 Average Income RRP BPS Jatim 7 Farmer Exchange Rates NTP BPS Jatim
Source: Data processed
There are saveral stage in study consisting of stationarity test, cointegration test, and VECM test. In more detail, stationary test is estimated using ADF test (Augmented Dicky Fuller Test) which can be seen using following formulation.
It’s mean a_0 is a constant, t is a deterministic trend, 𝛆 is the error term. If the autoregressive of Y (Y_ (t-1)) contains a unit root (unit root), then the ratio t (t ratio) for a_1 should be consistent with the hypothesis a_1 = 0.
3714
standard approach for Johansen’sis maximum likelihood. First, estimating Trace and Maximum Eigenvalue statistics, then comparing the appropriate critical values. In this cointegration test, if there is a cointegration between variables or the rank of cointegration is higher than zero, the Vector Error Correction Model can be conducted.
3 RESULT
AND
DISCUSSION
The result of the stationarity test using the Augmented Dickey Fuller (ADF test) is presented in the table 3. All stationary variables in the first degree are different except the Farmer Tujar Value (NTP) variable. Furthermore, to equalize the stationarity level, the NTP was also tested using the first degree different levels and the results showed that the variables were on the same degree.
Table 2.
Data Stationary Test Results with the ADF Test Variable Conclusion
HB Stationary in First Different
HGP Stationary in First Different
HMG Stationary in First Different
JPB Stationary in First Different
JP Stationary in First Different
RRP Stationary in First Different
NTP Stationary in Level
Source: Data processed
Furthermore, the data were followed the next test using Johansen Cointegration test to know the relationship between variables in the long run.
Table 3.
Unrestricted Cointegration Rank Test (Trace)
Hypothesized Trace 0.05
No. of CE(s) Eigenvalue Statistic Critical Value Prob.**
None * 0.557162 90.30058 69.81889 0.0005 At most 1 0.290397 43.87118 47.85613 0.1127 At most 2 0.235452 24.31732 29.79707 0.1874 At most 3 0.121542 9.014514 15.49471 0.3640 At most 4 0.028158 1.628036 3.841466 0.2020
Table 4.
Unrestricted Cointegration Rank Test (Trace)
Hypothesized Trace 0.05
No. of CE(s) Eigenvalue Statistic Critical Value Prob.**
None * 0.402921 58.21232 47.85613 0.0040 At most 1 0.263522 29.33280 29.79707 0.0565 At most 2 0.195428 12.20377 15.49471 0.1474 At most 3 0.000479 0.026855 3.841466 0.8698
Table 5.
Unrestricted Cointegration Rank Test (Trace)
Hypothesized Trace 0.05
No. of CE(s) Eigenvalue Statistic Critical Value Prob.**
None * 0.398746 48.81844 47.85613 0.0405 At most 1 0.207428 19.82042 29.79707 0.4351 At most 2 0.099983 6.569490 15.49471 0.6282 At most 3 0.009863 0.565009 3.841466 0.4522
From the results of the analysis using the Vector Error Correction Model (VECM) it can be seen the long-term and also the short-term relationship between the commodity prices of Rice (HB), Granulated Sugar (HGP), Cooking Oil (HMG), Total Population (JP), Total Rice Production (JPB), Average Income (RRP, and Farmer Exchange Rate) The following results of the analysis use the VECM model that explained in the Table 6.
Table 6.
VECM Test Results for Rice Prices
Variable Price of Rice
Coefficient t-statistic
CointEq1 0.03 3.22
Short Run
D(HB(-1)) 0.31 2.28
D(JP2(-1)) -1.04 -0.91
D(JPB2(-1)) -0.07 -3.08
D(RRP2(-1)) -0.06 -0.80
D(NTP(-1)) 0.14 1.17
Long Run
JP2(-1) 40.95 3.35
JPB2(-1) 2.59 6.49
RRP2(-1) 0.30 0.44
NTP(-1) -0.35 -0.92
Note: Significant at the 5% level = 2.0 Source: Data processing with Eview
3715
run the Total Population (JP) variable has a significant positive effect where when the Total Population (JP) increases 1 percent will increase the price of rice by 40.1 percent. This is in line with research by Serra & Gill (2012) that the principle of demand when the number of residents more and more needs for staple foods will increase which makes the selling price increases. Variable Number of Rice Production (JPB) in the long run has a significant positive effect with a coefficient of 2.59 percent. Which means that when the number of rice production (JPB) increases by one percent it will raise the price by 2.59 percent. While the average revenue (RRP) variable also has an insignificant positive effect with a coefficient value of 0.30 percent. Where when (RRP) increases 1 percent it will increase the price of rice by 0.30 percent. In contrast to the Farmer Exchange Rate variable (NTP) which has no significant negative effect with a coefficient of -0.35 percent, which means that when Farmer Exchange Rate Rises by 1 percent it will reduce the price of rice by -0.35 percent. This is in line with research by Malian, A.H., Mardianto, S., & Ariani, M (2016) where this relates to the low rice price policy which is actually detrimental to farmers and unable to encourage the industrial sector to compete on the world stage.
Table 7.
VECM Test Results for Sugar and Cooking Oil
Variable Price of Sugar Price of Cooking Oil Coefficient t-statistic Coefficient t-statistic
CointEq1 -0.06 -2.35 -0.01 -0.039
Short Run
D(HGP(-1)) 0.43 3.28 - -
D(HMG(-1)) - - -0.15 -1.02
D(JP2(-1)) 1.8 0.66 0.48 0.39
D(RRP2(-1)) 0.27 1.46 -0.04 -0.43
D(NTP(-1)) -0.02 -0.28 0.06 1.82
Long Run
JP2(-1) 25.3 1.92 14.9 3.79
RRP2(-1) -2.92 -3.11 -0.58 -2.3
NTP(-1) 1.02 2.61 0.10 0.9
Note: Significant at the 5% level = 2.0 Source: Data processing with Eview
The estimation results of the Vector Error Correction Model on Sugar Prices (HGP) in the short run show (Table 9) the variable Sugar Prices (HGP) has a significant positive effect which means that when the Price of Sugar (HGP) has increased 1 percent in the previous month will increase (HGP) by 0.43 percent in the current month. Variable Population has an insignificant positive effect, which means when (JP) increases by 1 percent in the previous month will increase (HGP) by 0.43 percent in the current month. Variable Average Revenue also has an insignificant positive effect where when (RRP) rises by 1 percent in the previous month it will increase (HGP) by 0.27 percent in the current month. Inversely proportional to the variable (NTP) which has a significant negative effect, which means that when (NTP) increases by 1 percent in the previous month will decrease (HGP) by 0.02 percent in the current month. In the long run the number of population has a significant positive effect with a coefficient of 25.3 percent, which means that in the long run when the population rises 1 percent it will increase (HGP) by 25.3 percent. In line with research conducted by Yusuf & Aulia (2010) that the population affects the
demand for sugar in Indonesia. Inversely proportional to (RRP) which has a significant negative effect where when (RRP) rises 1 percent it will decrease (HGP) by -2.92 percent. As for the variable (NTP) has a significant positive effect which can be concluded that when (NTP) rises 1 percent it will increase (HGP) by 1.02 percent. This is interrelated with Zaini's research (2008) that the problem of the expansion of sugarcane area which is mostly done by smallholder farmers causes problems related to sugarcane farmers' income which has implications for productivity and government policies related to input factors. Table 9 also shows the results of VECM analysis of Cooking Oil prices (HMG) in the short term Total Population (JP) has insignificant influence with a coefficient of 0.48 percent, which means an increase of 1 percent (JP) in the previous month will increase (HMG) by 0.48 percent in the current month. In the long run, the Variable Population Oil Price (JP) has a significant positive effect with a coefficient of 14.9, which means that every 1 percent increase (JP) will increase the Cooking Oil Price by 14.9 percent. Rice in this case is an element of primary primary needs and has a very strategic value. Besides that, rice is also one of the main pillars in the movement of the economic control system in East Java. East Java Province is one of the national rice barns, Sutijo, B. (2012) states that the availability of rice in East Java shows the availability status of a surplus that has decreased every year. But on the other hand the factor of population growth that continues to increase must also be a readiness, especially for policy makers to always maintain the passokan production of rice itself which can have an impact on price stability. Conservation of agricultural land into buildings is almost rife which can have implications for decreasing the amount of production from rice itself. According to Timmer (2011) The best solution to deal with price fluctuations is to maximize stock better. Gouel & Jean (2012) research on policies taken by developing countries to stabilize the price of food commodities, one of which is to maintain the availability of food production. According to Tarimo & Takamura (1998) explains that granulated sugar is a commodity that is no less important than the commodity of rice. According to Hartono (2012) & Nurliza (2017) states that the increasing number of population affects the demand for sugar. In addition, according to Koo & Taylor (211) If you look at the case of consumption of sugar per capita needs of the Indonesian people is 14.5 kg per capita per year. This results in a pattern of sugar production which must be increased by 1.5 times more to always meet domestic needs. According to Yunitasari et al. (2015) sugarcane farmers' income in East Java also needs to get attention. Farmer exchange rate is one of the important indicators in measuring the welfare of farmers, especially sugar cane farmers. Cooking oil is one of the important commodities, in this case cooking oil is the third largest commodity based on public expenditure indicators. According to Astuty, et al (2018) the level of income has a positive effect on demand for cooking oil in Aceh. Although cooking oil can be regarded
4
CONCLUSION
3716
amount of Rice Production and Farmer Exchange Rate (NTP) can have a significant influence on the stability of the selling price of rice commodities in East Java. Community income and NTP can have a significant influence on the price stability of Granulated Sugar in East Java. Population and community income have a significant effect on the stability of cooking oil prices in East Java.
REFERENCES
[1] Arezki, R., Jakab, Z., Laxton, D., (2017). Oil Prices and the Global Economy. International Monetary Fund Working Paper.
[2] Azizah, E. W. (2018). Pengaruh Pendidikan, Pendapatan Perkapita Dan Jumlah Penduduk Terhadap Kemiskinan Di Provinsi Jawa Timur
[3] Engel, F. J., Blackwell, R. D., Miniard, P. W. (2011). Perilaku Konsumen, Jilid Satu, Penerbit Binarupa Akasara, Jakarta.
[4] Gouel, C., & Jean, S. (2012). Optimal food price stabilization in a small open developing country. The World Bank.
[5] Hartono16, S. (2013). Efisiensi produksi tebu dan gula Indonesia. Ekonomi Gula, 17.
[6] Koo, W. W., & Taylor, R. D. (2011). Outlook of the US and world sugar markets, 2010–2020. Agribusiness and Applied Economics, 679, 35.
[7] Nurliza, N. (2017). The Nature of Food Commodity Prices Volatility in Driving Inflation and Policy. Signifikan: Jurnal Ilmu Ekonomi, 6(1), 103-124. [8] Prabowo, D. W. (2014). Pengelompokan komoditi
bahan pangan pokok dengan metode Analytical Hierarchy Process. Buletin Ilmiah Litbang Perdagangan, 8(2), 163-182.
[9] Sari, D.L. (2010). Analisis Spread Harga Gabah dan Beras Serta Integrasi Pasar dan Komoditas. IE-IPB. Bogor.
[10]Sugiyanto, C., & Hadiwigeno, S. (2012). Integrasi Pasar Beras Indonesia dengan Pasar Beras Internasional. Jurnal Ekonomi dan Kebijakan Pembangunan, 1(2).
[11]Sugiyanto, C., & Hadiwigeno, S. (2012). Integrasi Pasar Beras Indonesia dengan Pasar Beras Internasional. Jurnal Ekonomi dan Kebijakan Pembangunan, 1(2).
[12]Sutijo, B. (2012). Pemodelan Jumlah Ketersediaan Beras untuk Jawa Timur dengan Pendekatan Fungsi Transfer. Jurnal Sains dan Seni ITS, 1(1), D81-D86. [13]Tarimo, A. J., & Takamura, Y. T. (1998). Sugarcane
production, processing and marketing in Tanzania. [14]Timmer, P. (2011, May). Managing Price Volatility:
Approaches at the global, national, and household levels. In Center on Food Security and the Environment. Stanford Symposium Series on Global Food Policy and Food Security in the 21st Century. Stanford University.
[15]Trisnowati, J., & Budiwinarto, K. (2013). Kajian Pengaruh Harga dan Pendapatan terhadap Proporsi Pengeluaran Makanan Rumah Tangga (Pendekatan Model Linier Permintaan Lengkap). In Prosiding Seminar Nasional Statistika Universitas Dipenegoro 2013 ISBN: 978-602-14387-0 (Vol. 1).
[16]Trostle, R. (2008). Global Agricultural Supply and Demand: Factors Contributing to The Recent Increase
in Food Commodity Prices. United States Department of Agriculture.