3617
Analysis Of Efficient Predictive Algorithms For
Fraud Detection In Credit Cards
L.Vetrivendan, R.Viswanathan
Abstract: the internet faster than the speed of light, memory storage, and processing power moved to the cloud. The information industry has a huge amount of data. This data cannot be used until it is transformed into useful information. You need to analyses this huge amount of data and extract useful information. Data Mining Algorithm (or Machine Learning) - a set of heuristics and computing that creates a model of data. To create a model, an algorithm first analyses the data to look for the presentation in some patterns and trends. The algorithm of the above analysis results in a long iteration to find the optimal settings to create the mining models. We use these parameters and then use the full dataset with examples and detailed statistics. This category includes highly advanced technology and instrumentation, known as "prediction algorithms." Prediction algorithms have made a revolution in how we see data in the future and have shown great advancement in computing. In this article, we discussed about the criteria used to select the appropriate algorithm predictor model.
Index Terms : Predictive Analysis, Data Processing, Future Data, and Fraud Detection.
—————————— ——————————
1
INTRODUTION
The descriptive analysis is used to describe the main features of the data in the study. They are a simple summary of the pattern and measures. Together, simple graphical analysis forms the primary virtual quantitative analysis. When descriptive analysis can be simply described as that of the data, it shows. Description of the data needed to determine the normality of the distribution, the description of the data is necessary because the type of techniques that will be used to analyses infectious data depends on the characteristics of the data. First, we examine the process of predictive analysis of its important components. In most cases, it is divided into 4 areas:
1.1 Descriptive analysis
It subsists of complete comment and detail of qualities or properties of restricted or occasions to perceive connections between factors. The most distant objective is to talk largely how it very well may be application to break up wonders and to forecast futurities occasions.Research should establish principles of observation and description as well as its proverbial sense. Measurement - the most accurate description of the process and its recognized assignment are numerical values of object properties and events (Best, 1981). Data collection and research on the development of planning and care provide a basic guarantee of research quality, but the final test lies in the analysis (Best J. W., 1981). The data in the real world often comes with a large quantum and a variety of formats so that no meaningful explanation of the data can be accessed immediately. To achieve the objectives, the analysis of the study is an important and integral part of the data collected.
The classification generalization of data to answer research questions. Classification also helps to reduce the enormous data in an intelligible form and to interpret it (Youngman, 1979).the Enlightening investigation of as far as possible, the speculation of a specific gathering of watched people. No deductions surpass the gathering, and no closeness with bunches outside the gathering can be accepted. The information just portrays one gathering and this gathering. A basic assessment of exercises includes enlightening examination and gives significant data on the idea of a specific gathering of people (Best and Kahn, 2003). The clear investigation of information gives the accompanying. The First gauges synopses, orchestrated in tables and diagrams, to assist you with arriving at your objectives.
1. Information on information instability or vulnerability 2. Indication of startling models and perceptions that
ought to be considered in a legitimate investigation
1.2 Data Processing
Information handling is just the way toward changing over crude information into important data through a procedure. Dealing with your information brings about outcomes that offer an answer for an issue to improve a current circumstance. Like a generation procedure, it follows a cycle where inputs (crude information) are transmitted to a procedure (PC frameworks, programming, and so on.) to give yield (information and insights).
1.3 Stages of the Data Processing Cycle
1. The assortment is the principal period of the cycle and is significant, as the nature of the information gathered will emphatically affect the outcomes. The assortment procedure must guarantee the exactness and accuracy of the information gathered with the goal that resulting choices dependent on the discoveries are legitimate. This area gives both a premise to estimation and a target that should be improved. Specific sorts of information assortment incorporate enumeration (gathering or factual populace information assortment), test overview (an information assortment strategy that spreads just a small amount of the all-out populace), and a regulatory side-effect (a side-effect of everyday tasks: association).
2. The arrangement is the control of information in a structure reasonable for additional investigation and _____________________________________
• L.Vetivendan*, Research Scholar, School of Computing Science and Engineering, Galgotias University, Uttra Pradesh, India. Email: [email protected]
preparation. The crude information cannot be prepared and their exactness necessity be patterned. The motivation behind the arrangement is to gather an informational index from at least one information source that can be utilized for additional investigation and preparation. Dissecting cautiously unconfirmed information can prompt very deceptive outcomes, which are profoundly reliant on the nature of the information delivered.
3. Information is the errand of encoding or changing over-controlled information to a machine-discernible structure for handling through a PC. A console, digitizer, scanner or a current source must be entered to enter information. This tedious procedure requires speed and precision. Most information must follow a formal and thorough grammar, as a high handling force is required at this phase to separate complex information. Because of the costs in question, numerous organizations use redistributing at this stage.
4. Preparing is when information is controlled in various manners and in various ways, where a PC program executes and contains the program code and its present action. The procedure may incorporate various execution strings that execute guidelines all the while, contingent upon the working framework. While a PC program is an inactive guidance set, the procedure is the genuine execution of the guidelines. Numerous product programs are accessible to process a lot of information in an exceptionally brief timeframe.
5. The End of translation is the phase wherein the prepared data is transmitted to the client. The yield is displayed to clients in an assortment of configurations, for example, a print report, sound, video, or screen. The outcomes ought to be deciphered to give significant data to direct future choices of the organization.
6. Capacity is the last period of an information handling cycle where information, guidelines, and data are put away for later use. The significance of this cycle is that it permits the prepared data to be immediately gotten to and recovered, permitting it to be sent legitimately to the following stage. Every PC utilizes the capacity to store framework and application programming.
2
CHALLENGING
APPLICATIONS
It has been demonstrated that mining information as a rule, and prescient displaying specifically, can give critical upper hands. In certain applications, most extreme exactness or other valuable estimation is fundamental, even to the detriment of less logical force. This archive tends to various testing application territories: protection, misrepresentation location, and printed arrangement. Insurance: Hazard evaluation is at the core of the protection business, where actuarial measurements are devices to show different parts of hazard, for example, mishaps, wellbeing harm or calamities, and the seriousness of these cases. Cases are uncommon and prone to happen. For instance, a fender bender with a protected driver will never be a reasonable issue without a mishap class and a mishap class. Rather, Poison is displayed as a conveyance. Claims by and large follow the typical log dissemination, mirroring the event of uncommon however high cases. Text Categorization: Electronic archives or content fields in databases are a huge level of the information put
away in concentrated information distribution centers. Content recovery is the quest for significant models in put away content. When put away records have the right names, for example, report points, at that point this type of content extraction is called content categorization. In numerous content stockpiling and recovery frameworks, archives are arranged with at least one codes chose by the grouping framework For example, news services such as Reuters carefully map topics to newsletters. Similarly, a bank can forward incoming emails to one of the dozens of possible response pages. Initially, people-based knowledge-based systems were designed to record news. Such a categorization approach may seem reasonable, but the cost of manual analysis needed to develop rules is no longer reasonable given the enormous increase in digital documents. Instead, automated procedures are a viable alternative, and researchers have proposed several techniques to overcome this. The use of a standard collection of analysis and testing documents, such as the 1987 Reuters Newsletter, has allowed researchers to measure progress in this area. Since then, automated performance has improved significantly. There are many automated forecasting methods for extracting model cases. When retrieving text, with particular regard to text categorization, raw cases are separate documents. The documents are encoded in a numeric form with some characteristics, and the text needs numerical conversion. Fraud Detection: Misrepresentation identification is a significant issue because deceitful protection claims and Visa exchanges alone cost many billions of dollars a year. On account of MasterCard misrepresentation, counterfeit neural-systems have been generally utilized by numerous banks. Cheats are generally uncommon, for example, a slanted conveyance that narrows numerous customary information mining calculations except if stratified examples are utilized in the preparation set. Some enormous banks add to the exchange information volume by a huge number of exchanges every day. The expense of preparing an extortion case, when recognized, is a noteworthy factor against bogus positive mistakes while undetected misrepresentation includes the exchange cost in the misfortune section. This not just impacts the choice of whether to announce an exchange to be prepared as extortion or not, yet also requires a more reasonable presentation measure than conventional precision. The example of fake exchanges shifts with time, requiring moderately continuous and fast age of new models. The JAM System (Java Agents for Meta-Learning) is an ongoing methodology for charge card extortion recognition. The huge arrangement of information with twofold marks of extortion or genuine exchanges is partitioned into littler subsets, for each taking an interest bank unit and for different examples to increase better execution.
3 PREDICTIVE
MODEL
AND
ONLINE
FRAUDULENT
The typical data mining process during model creation involves the following steps. This modeling can be further explained with four distinct phases as outlined below.
1. Collecting data into a dataset that will be used for analysis.
2. Creating, training and validating a predictive model against the dataset and its known outcomes.
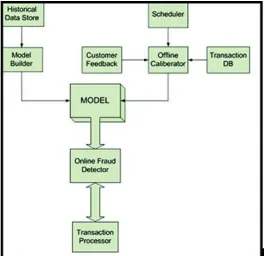
3619 Fig.1 Predictive Model and Online Fraudulent
There are many credit card payments, as described in Fig 3.1. It is controlled by fraudulent activities as illustrated. Businesses responsible for processing electronic transactions must effectively detect fraudulent activities to maintain customer confidence and business continuity. In this document, the developed algorithm detects credit card fraud. The prediction of each algorithm is based on a specific feature, such as the customer's buying behavior, the network of traders the customer usually deals with, the location of the transaction, the amount of the transaction, and much more. However, these properties change over time. Therefore, the algorithm model needs to be updated regularly to reduce this type of error. The proposed system offers two solutions for processing conceptual drift. One is active and the other is passive. The active solution is to trigger mechanisms with explicit detection of changes in statistics. The passive solution involves continually updating the model to take into account newly added records.
4 DESCRIPTIVE
ANALYSIS:
In the beginning, we built models based primarily on regression and decision trees. These algorithms focus primarily on the variable of interest and find the relationship between the variables or attributes. The introduction of advanced machine learning tools has made this process easier and faster, even with very complex calculations.Data Treatment: This is the most important step in creating the right input model, so we need to have an intelligent way to control the correct implementation. Here are two simple tricks you can apply.Create dummy flags for missing value(s): In general, missing values in a variable can sometimes carry quite a lot of information. So we can create a dummy flag attribute and use the ones in the model.Impute missing value with mean/any other simple value: In the main scenarios, the "medium" or "medium" pulse works well for the first iteration in a given situation. In other cases, when complex data is available with
the trend, seasonality, and low/high values, you may need a smarter way to solve missing values. Data Modeling: Generalized Amplifier Modules (GBM) are extremely effective for 100,000 monitoring cases. For larger data, you may want to consider starting Random Forest. The following fraud sheet will help you decide which method to use and when.
4.1 Estimation of Performance of the Model
The problem with predictive modeling is to create models that are good at predicting unpredictable data. Therefore, it is critical to use appropriate training techniques and evaluate models of available training data. The more reliable the performance evaluation, the more accurate the model. Many model evaluation methods can be used in R programming or Python. Below are some of these:Preparing Dataset: Prepare your model on the whole preparing dataset, at that point assess the model on the equivalent dataset. This is commonly hazardous because an ideal calculation could slant this assessment method by basically remembering (putting away) all preparation designs and accomplish an ideal score, which would be deluding. Provided Test Set: Split your dataset physically utilizing another program. Set up your model on the whole preparing dataset and utilize the different test set to assess the presentation of the model. This is a decent methodology on the off chance that you have an enormous dataset (a huge number of thousands of examples). Rate Split: Randomly split your dataset into preparation and testing allotments each time you assess a model. It's is as a rule in the split proportion of 70-30% of the information. What's more, this can give you the more critical gauge of execution and like utilizing a provided test set is best just when you have a huge dataset.Cross-Validation: Split the dataset into k-parcels or overlays. Train a model in every single imaginable part of information aside from one that is held out as the test set, at that point rehash this procedure making k-various models and give each overlap an opportunity of being held out as the test set. At that point ascertain the normal execution of all k models. This is one of the customary and standard strategies for assessing model execution, however, better believe it to some degree tedious and needs to make n-number of models to accomplish the exactness.
5 EXPERIMENTAL
RESULTS
The implementation of the proposed approach is evaluated using the credit card transaction data set using MATLAB software. The implementation of the proposed algorithm is based on the following factors
5.1 Precision Comparison
TABLE1
NUMBER OF DATASET VS PRECISION
S.No Number Of Dataset MSHMM SHMM
1 10 0.3 0.21
2 20 0.52 0.45
3 30 0.63 0.56
4 40 0.69 0.6
5 50 0.75 0.64
6 60 0.8 0.71
In this graph, we chose two parameters, the number of data sets and the accuracy, that is, the analysis of existing and proposed systems. The precision parameter is the Y-axis, and the number of data sets parameters is the X-axis. The blue line represents the existing system and the red line indicates the proposed system. This graph shows that the accuracy of the proposed system is higher than that of the existing system. This leads to the conclusion that the proposed system is accurate.
5.2 Recall Comparison
The system is increased which in for the best. The call speed values are given below:
This graph shows the call speed of an existing and recommended system based on two call parameters and the number of data sets.The graph shows that as the number of data sets numbers improves, the call speed in the proposed system improves, but as the number of data sets numbers improves, the call rate decreases in the existing system of the proposed system. From this diagram, we can say that the speed of the proposed system is increasing, which is best. The call speed values are given below:
Fig.2 Performance of Dataset Vs Precision
TABLE2
NUMBER OF DATASET VS RECALL
S.No Number Of Dataset MSHMM SHMM
1 10 0.35 0.23
2 20 0.43 0.32
3 30 0.5 0.42
4 40 0.59 0.49
5 50 0.72 0.6
6 60 0.87 0.69
In this graph, we chose two parameters, the number of so-called data sets and the call, which help in analyzing the existing system and the proposed systems based on the call.
On the X-axis, we take the data set parameter number and the Y-axis parameter call, and this graph shows that the proposed system call rate is at its peak. This leads to the conclusion that the proposed system has an effective download.
Fig.3 Performance of Dataset Vs Recall
5.3. F-Measure Comparison
This graph shows the degree of measurement of F on an existing and proposed system, based on two parameters of F and the number of data sets. The graph shows that if the data set number improves, the F measurement speed will also improve in the proposed system, but if the data set number improves, the F measurement rate will decrease in the existing system of the proposed system. From this graph, we can say that the measurement system F of the proposed system rises, which is the best. These values of degree F are given below:
TABLE3
NUMBER OF DATASET VS F-MEASURE
S.No Number Of Dataset MSHMM SHMM
1 10 0.89 0.76
2 20 0.82 0.71
3 30 0.74 0.62
4 40 0.65 0.52
5 50 0.54 0.42
6 60 0.42 0.32
3621 Fig.4 Performance of Dataset Vs F-Measure
6 CONCLUSION
Finally, it is worth the work involved in choosing algorithms to predict future trends and events. This can lead to better customer service, better sales, and better business practices. Of course, any of these things can result in increased profits or reduced costs. Both are desirable results. The above information should function as an essential part of any new fund using analytics.
7
REFERENCES
[1]. Markus Brameier Wolfgang Banzhaf, ―A Comparison of Linear Genetic Programming and Neural Networks in Medical Data Mining‖ Fachbereich Informatik University at Dortmund 44221 Dortmund, GERMANY.
[2]. T.T.Nguyen and D.N. Davis, ‖Predicting Cardio Vascular Risk Using Neural Net Techniques‖ University of Hull.
[3]. T.T.T.Nguyen and D.N. Davis,‖ Feature Selection and Predicting CardioVascular Risk‖, University of Hull. [4]. [4] G Kuhan, DN Davis, CN McCollum, PT McCollum,‖
The use of Artificial Neural Networks for risk prediction following Carotid Endarterectomy‖, Department of Computer Science, University of Hull Academic Surgery Unit,South Manchester University Hospital.
[5]. D.W. Gao P. Wang, H. Liang, ‖Optimization of hidden nodes and trainingtimes in ANN-QSAR model‖ ,College of Forest Resources and Environment, Northeast Forestry University, Harbin 150040, China ,School of Municipal and Environmental Engineering, Harbin Institute of Technology, Harbin 150090, Chin.
[6]. Darryl N. Davis and Thuy T.T. Nguyen,‖ Generating and Verifying Risk Prediction Models Using Data Mining (A Case Study from CardiovascularMedicine) ‖, Department of Computer Science, University of Hull, Cottingham Road, Hull, HU6 7RX, UK.
[7]. Emanuel MinedaCarneiro, ―Cluster Analysis and Artificial Neural Networks: A Case Study in Credit Card Fraud Detection,‖ in 2015 IEEE International
[8]. Dhiya Al-Jumeily, ―Methods and Techniques to Support the Development of Fraud Detection System‖, IEEE 2015.
[9]. Mukesh Kumar Mishra, ―A Comparative Study of Chebyshev Functional Link Artificial Neural Network,
Multi-layer Perceptron and Decision Tree for Credit Card Fraud Detection‖, 2014 13th International Conference on Information Technology.
[10]. Andrea Dal Pozzolo, Olivier Caelen,‖ Learned lessons in credit card fraud detection from a practitioner perspective‖, Expert Systems with Applications 41, 2014.
[11]. V. Mareeswari, ―Prevention of Credit Card Fraud Detection based on HSVM‖. 2016 IEEE International Conference On Information Communication And Em- bedded System.
[12]. Carlos A. S. Assis, ―A Genetic Programming Approach for Fraud Detection in Electronic Transactions‖ in Advances in Computing and Communication Engineering (ICACCE), 2015 Second International Conference.
[13]. Dustin Y. Harvey, ―Automated Feature Design for Numeric Sequence Classification by Genetic Programming‖, IEEE TRANSACTIONS ON EVOLUTIONARY COMPUTATION, VOL. 19, NO. 4, AUGUST 2015.
[14]. Kang Fu, Dawei Cheng, Yi Tu, and Liqing Zhang, ―Credit Card Fraud Detection Using Convolutional Neural Networks‖, Neural Information Processing, Springer.
[15]. Sahin Yusuf, BulkanSerol, DumanEkrem,‖ A Cost-Sensitive Decision Tree Approach for Fraud Detection‖, Expert Systems with Applications,vol.40, pp. 5916– 5923, 2013.
[16]. Andrea Dal Pozzolo, ―Credit Card Fraud Detection and Concept-Drift Adaptation with Delayed Supervised Information‖.
[17]. Véronique Van Vlasselaer, ―APATE: A novel approach for automated credit card transaction fraud detection using network-based extensions‖ published in Decision Support Systems 2015.