IJSRR, 7(2) April – June, 2018 Page 642
Case Study
Available online www.ijsrr.org
ISSN: 2279–0543
International Journal of Scientific Research and Reviews
A Study On Investors’ Awareness About The Stock Market Using
Variance Based Structural Equation Modeling
PRABAKARAN V.
Assistant Professor, Department of Accounting and Finance, Adigrat University, Ethiopia
ABSTRACT
This study examines the awareness about the stock market, it mainly focused the risk, general information and the Intraday trading procedure’s variables to create the model for the awareness. Through a two-step approach of the partial least square analysis, the four constructs of awareness were tested and validated. Furthermore,there were three hypotheses as significantly out of the six, which is related to the study. This research contributed to the investors, on which awareness as an important to invest before entering into the market.
KEYWORDS:
Investors, risk awareness, intra-day trading, Smart PLS*
Corresponding Author
Dr. V. PRABAKARAN
Assistant Professor, Department of Accounting and Finance Adigrat University, Tigray -04
Ethiopia.
IJSRR, 7(2) April – June, 2018 Page 643
INTRODUCTION
Investors’ awareness is the process by which the investors improve their understanding of the financial markets, products, concepts and risks. Financial literacy helps an investor to make an informed judgment about investments; keeping in mind the specific goals of investing.Stock market corrections have affected the trust of investors. When stock market becomes unreliable people get doubtful about information they receive that affect stock market participation, in this reasonmany potential investors do not invest in the stock market because of their limited information on stocks; they do not understand the operations and different pricing strategies of the stock market1. India has always been a nation of savers, but for the growth of the economy, it is important to channel these savings into productive capital via the capital markets. While volumes in daily trading of Indian markets grown substantially over the last two decades, it is largely from derivative trading that this growth has been derived. However, the investor aware is the most important in the stock market, particularly in India. Therefore, this study aims to attempt the investors’ awareness about the stock market investment.
OBJECTIVE OF THE STUDY
The following are the specific objectives of the study
To determine the level of general awareness of investors in the stock market
To examine the investors’ how do trading the stocks in intra-day market
To assess the investors’ level of risk awareness in the stock market
REVIEW OF LITERATURE
The past literature identifies the driving investors’ awareness about the stock market investment as follows:
The study investigated how stock market awareness of leader of selected organizations affects their level of performance on the Rwandan capital market and the findings are that directors have a high financial literacy while the level of organizations’ participation in the study area is moderate.2Investment portfolio, there is a need for knowledge, information around the investment process, risk spread, returns, etc. The responsibility of investment awareness of the investors is formed, stormed, normed and gets into performing mode by variousexternal social mediums like print, electronic media, investment professionals and associates.It is essential that investment awareness program needs effectivelyand reach by e-governance services so that investors are cognizant of the investment product features and risk areas.3
IJSRR, 7(2) April – June, 2018 Page 644
the short and long term portfolio risk that participants are willing to take differs.4Individuals who have more knowledge of finance are more likely to allocate the majority of their investment efficiently.5In general, there is risk tolerance for the unknown since the impacts are new, unobservable or delayed. Higher risk tolerance emerges when people feel more in control.6 Several dimensions necessary to build trust and awareness of investors in the stock market. To examine the level of trust and awareness, the study used primary data and later analyzed it using the statistical package for the social sciences to generate descriptive statistics, inferential statistics, correlation, regression and factor analysis. The main determinants that contribute 46% variation in awareness of investor were financial literacy and social learning, whereas the main determinants that contribute 68 percentage variation in trust of investors were regulations and supervision, disclosure of reliable information, willingness, convenient, getting returns, interpersonal trust and perceived risk. The findings also revealed a moderate positive correlation between awareness and trust among the investing public.7
Perceived risk, perceived returns and trust directly affect individual investors’ trading decisions while attitude towards the brand partially mediates the relationships.8 To gain insights and information into the factors that affect investment planners, financial advisers and individuals need to consider improving their choice of the portfolio and its performance. Furthermore, it intends to identify the factors that drive investors to choose one investment over another and determine how they make their investment portfolios.9
Hence, the existing studies covered the level of awareness about different dimension like risk, general, andfinancial awareness, etc., but in this study cover above said information along with the Intraday trading awareness of the stock market.
HYPOTHESIS OF THE STUDY
H1 - Risk awareness has a direct effect on intention to invest in the stock market.
H2 - Generalaware has a direct effect on intention to invest in the stock market.
H3 - Intra-day trading has a direct effect on intention to invest in the stock market.
H4 - The impact of the risk awareness ofintention to invest in the stock market mediated by the general awareness
H4 - The impact of the risk awareness of intention to invest in the stock market mediated by the intra-day trading
IJSRR, 7(2) April – June, 2018 Page 645
RESEARCH METHODOLOGY
Primary data were collected through the online survey and byusing SmartPLS software to perform Partial Least Squares Structural Equation Modeling (PLS-SEM) to test the hypothesized relationships among the constructs in the proposed model depicted. This method was chosen due to normality assumptions of the data distribution have not been met and small sample size of 75 responses.8The PLS-SEM model performed in two steps, the first step was the structural model, which involved estimation through modeling and the second step was the reliability and validity were used to measure the good model to fit.9
Table. 1 Measures of Latent Constructs
Constructs
General Awareness (GA)
GA1 I know where to get the information about the stock market.
GA2 I know, if any, problems come out from trading (non-receipt of dividend, non receipt of share certificate
after transfer, non receipt of letter of offer for the rights) compliance register against stock broker and
concerned stock exchange to Investor Grievance Redressal.
GA3 I know how the world economic and political environment affects the stock market.
GA4 I know don’t want to invest the huge money in stock in a day.
GA5 I know dynamic portfolio measures in case of stock selection.
Risk (RA)
RA1 I am cautious about stocks which show sudden changes in price.
RA2 I am often not afraid to invest in stocks that have shown a past positive performance in trading
RA3 I have worried investing in stocks that have a negative performance in trading
RA4 I feel regret of a drop in the price of a stock, I have purchased
RA5 I hopeful when undertaking investment in stocks that have exhibited a sure loss
Intra-Day Trading (IT)
IT1 I know how to open the de-mat and trading account
IT2 I know when they buy or sell the stocks during intra-day trading
IT3 I know the brokerage commission in case of either buy or sell the stocks
IT4 I know settlement procedure for both buying and selling the stock.
IT5 I know the broker impose fine and penalty for violation of the rules, delay of the settlement in intra-day
trading.
Intention to Invest (ITT)
ITN1 I intend to buy and sell the stock
ITN2 I expect to trade stocks in the future.
ITN3 If I have access trading information as positive, I willing to invest it as much as possible.
IJSRR, 7(2) April – June, 2018 Page 646
Sample Size
Online surveys are regarded as advantageous since they can overcome place and time constraints.10The survey was conducted as such that the investors answered it in their own preferred time. Hence, the data were collected through mail questionnaires from the 75 sample respondent in Chennai, India.
DATA ANALYSIS AND INTERPRETATION
A.
Measurement Model
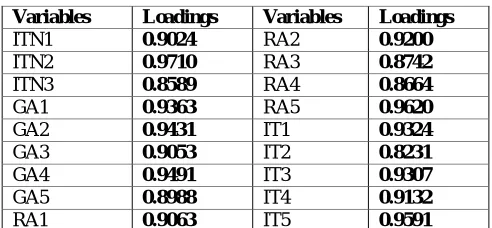
In utilizing a PLS path modeling technique, a similar twostep procedure normally conducted in structural equation modeling (SEM) was followed.11 This technique, the results of both confirmatory factor analyses of the model and path effect were obtained.The result of measurement model using a PLS algorithm (300 iteration, standard values and centroid scheme) suggests that all constructs that were made up of reflective indicators are reliable with loadings all above desired levels of 0.70.8
Fig: 1 Research Framework
Source: Primary data
Note: GA- General Awareness; IT- Intraday-trading; RA- Risk Awareness ITT – Intention to Invest
Table 2Loading of Indicators
Variables Loadings Variables Loadings
ITN1 0.9024 RA2 0.9200
ITN2 0.9710 RA3 0.8742
ITN3 0.8589 RA4 0.8664
GA1 0.9363 RA5 0.9620
GA2 0.9431 IT1 0.9324
GA3 0.9053 IT2 0.8231
GA4 0.9491 IT3 0.9307
GA5 0.8988 IT4 0.9132
RA1 0.9063 IT5 0.9591 Source: Computed from Primary data and using Smart PLS
GA ITT
IJSRR, 7(2) April – June, 2018 Page 647
From the Table 3 shows that all indicators present individual reliability coefficients superior to the more than 0.7 in confirmatory studies.12The factor loadings of items to their respective constructs are stronger than they load on other constructs providing evidence in support of the convergent validity of the derived measures. It can be concluded that reliable indicators exist.
B.
Model Validity
The model measurement tests include estimation of internal consistency, instrument validation for its convergent and discriminant analysis. The composite reliability of the constructs was measured using internal consistency, Cronbach’s alpha and average variance extraction (AVE), and the test scores are given in the table 3.13
Table 3Construct Reliability and Convergent Validity
Variables CR AVE CA
GA 0.9587 0.8230 0.9588
RA 0.9457 0.7772 0.9453
IT 0.9501 0.7924 0.9493
ITT 0.9017 0.7546 0.8975
Source: Computed from Primary data and using Smart PLS
Note: AVE-Average variance extracted, CR- Composite reliability,
CA – Cronbach’s alpha
Convergent validity can be accessed through constructing factor (item), the average variance extracted (AVEs) that should have minimum loading of 0.5, and composite reliability (CR) with an acceptable minimum of 0.70.11The CR values for all constructs range from 0.9017 to 0.9587 exceeding the acceptable requirement of 0.70 confirming the convergent validity of the measurement (outer) model. Discriminant validity was considered adequate since the AVEs are greater than their respective inter-construct correlations.14The AVEs of the latent variables are showing more than 0.5 values which are acceptable levels of convergent validities for these constructs.Cronbach’s alpha values showed the internal consistency of the constructs that varies between 0.8975 and 0.9588 in the validation model. Thus, the present validated model exhibits acceptable levels of reliability and validity measures for the constructs.
Table 4 Discriminant Validity
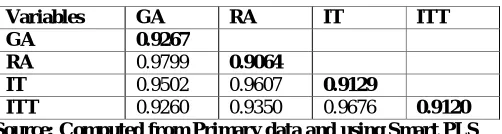
Variables GA RA IT ITT GA 0.9267
RA 0.9799 0.9064
IT 0.9502 0.9607 0.9129
ITT 0.9260 0.9350 0.9676 0.9120 Source: Computed from Primary data and using Smart PLS
IJSRR, 7(2) April – June, 2018 Page 648
Discriminant validity indicates the extent to which the measures in a model are distinct from the other steps in the same model. It was examined by testing correlations between measures of potential overlapping constructs, which must be different forms of unity.11It could be observed from the above table, discriminant validity was considered adequate since the AVEswere greater than their respective inter-construct correlation. Hence, this model has achieved desirable discriminant validity.
C.
Structural Model
Using a bootstrapping technique (500 re-samples), a test on structural model was conducted to assess the effect of each casual path, thus testing the stipulated hypothesis. 8This analysis has shown ITITT path, was significant at the 5% level. RA and GA hypothesis were not supported. Therefore, only one hypothesis were supported and suggesting that they have a relationship between Intra-day trading and intention to invest in the stock market.
Fig: 2 Results of Structural Model
Source: Computed from Primary data and using Smart PLS
D.
Summary of Hypothetical Test
IJSRR, 7(2) April – June, 2018 Page 649 Table 5Path Coefficient and Hypothesis Testing
H. No Hypothesis (Direction)
Path-Coefficient
T-value Supported
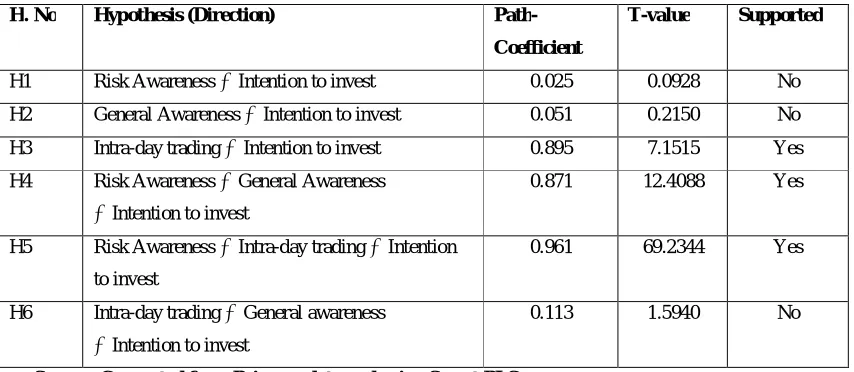
H1 Risk Awareness Intention to invest 0.025 0.0928 No
H2 General Awareness Intention to invest 0.051 0.2150 No
H3 Intra-day trading Intention to invest 0.895 7.1515 Yes
H4 Risk Awareness General Awareness
Intention to invest
0.871 12.4088 Yes
H5 Risk Awareness Intra-day trading Intention
to invest
0.961 69.2344 Yes
H6 Intra-day trading General awareness
Intention to invest
0.113 1.5940 No
Source: Computed from Primary data and using Smart PLS
FINDINGS OF THE STUDY
From the analysis, it could be found that, three different variables on awareness about the stock market investment. In this study the path analysis to test the six hypotheses generated, figure 2 and the table 5 shows the results. The R2value 0.937 reporting that, 93.7 of the variation in the extent of the intention to invest with the general information, risk and Intraday trading procedures of the awareness about the stock market.9
The hypotheses tested the impact of risk awareness on the intention to invest. It reveals that do notsupport with the variables that is, (t-value 0.0928) and thus H1 (β = 0.025, p>0.05) is rejected.
It indicates that risk awareness about the stock market has an insignificant. Therefore, they are likely to learn more information about the risk factors in the market. On the hypotheses (H2)highlights that
the impact of general awareness on the intention to invest. It reveals that do not support with the variables that is, (t-value 0.2150) and thus H2(β = 0.051, p>0.05) is rejected. It indicates that general awareness about the stock market has an insignificant.Moreover, hypotheses (H3)tested that impact
of the Intraday trading on their intention to invest. The effect of the objective is found to be significant, that is (t value= 7.1515, and β = 0.051, p<0.05) is accepted. It indicates that, Intraday trading awareness about the stock market is most important for consideration while invest inthe market. The rest of the hypotheses like H4,H5 and H6 tested and the effect of interrelationship
between among the all variables on their intention to invest. That is, H4 and H5significant, and the
last is insignificant at the 5 percent level (t value = 12.4088, 69.2344 and 1.5940, and β = 0.871,
IJSRR, 7(2) April – June, 2018 Page 650
CONCLUSION
This study was supported to the investors while investing into the market. Therefore, it concentrates with three variables like risk, general and the Intraday trading. In addition to the extent of intention to invest variable using by partial least squares (PLS) perform the various results in the data analysis part such asAVE-Average variance extracted, CR- Composite reliability, CA – Cronbach’s alpha and the discriminant validity were made in the par with the criteria setup by the various researchers. That is, all constructs,values became reliability and goodness of the measures. As stated earlier, three hypotheses weresignificantly out of the six, which is related to the study. Hence, awareness of the stock market was important to the investors because of without knowing any information; it leads to heavy loss and its never adjusting the forthcoming investment also.
REFERENCES
1. Rooij. M.V, et al. “Financial literacy and stock market participation”.Journal of Financial Economics. 2007;101; 449-472.
2. Pierre Sindambiwe. “Financial Literacy, Stock Market Awareness and Capital Market Participation of an Emerging Stock Market”. International Journal of Multidisciplinary Approach and Studies.Sep - Oct 2014; 01 (5); 366-406.
3. Imthiyas. Y. et al. “A study on Reach of Investment Awareness Programmes Organized by E-Governance Services over Social Media”. International Journal of Applied Environmental Sciences (IJAES). 2015; 10 (1); 65-69.
4. Siebenmorgen et al. “The influence of different investment horizons on risk behavior”. Journal of Behavioral Finance. 2004; 5 (2); 75-90.
5. Hibbert et al. “Can diversification be learned? ”. Journal of Behavioral Finance. 2012;13; 38– 50. https://doi.org/10.1080/15427560.2012.654547
6. Orerler et al. “Utility function and risk taking: An experiment”, Journal of American Academy of Business, Cambridge, 2006; 9 (2); 167-174.
7. Hamza Ahmad Qureshi et al. “Determinants of Trust and Level of Awareness of Retail Investors in Stock Market of Pakistan”. Sci.Int (Lahore).2014; 26 (5); 2501-2507.
IJSRR, 7(2) April – June, 2018 Page 651
9. Seetharaman. A et al. “A Study of the Factors Affecting the choice of Investment Portfolio by Individual Investors in Singapore”. Accounting and Finance Research. 2017; 6 (3) 153-168. http://afr.scidedupress.com
10.Joao Carlos etal. “Structural Equation Using Partial Least Squares: An Example of the Application of Smart PLS in Accounting Research”. Journal of Education and Research in Accounting. 2016; 10 (3)282-305.
11.Anderson, J.C and Gerbing D.W. Structural Equation Modeling in Practice: A review and recommended two-step approach.Psychol. Bull. 1988; 103 (3). 411-423. http://doi.org/10.1037/0033-2909.103.3.411
12.Hulland J. “Use of Partial Least Squares (PLS) Strategic management research: A review of four recent studies”. Strategic management Journal.1999; 20 (4);195-204.
13.BiswajitAcharjya et al. “Does Family Domicile changes Financial Planning Decision? – A Study Retail investor’ Behavior using TPB”.International Journal of Economic Research.2017; 14 (14); 443-464.