Construction of an integrated map of the genomic
locus lq21 harboring the Human Epidermal
Differentiation Complex as a platform for the
identification of all genes in this complex, the
study of their expression, regulation, function and
evolution
by
Andrew P. South
Thesis Submitted For The Degree of Doctor of Philosophy
University of London
1999
Centre For Applied Molecular Biology
ProQuest Number: 10104217
All rights reserved
INFORMATION TO ALL USERS
The quality of this reproduction is dependent upon the quality of the copy submitted.
In the unlikely event that the author did not send a complete manuscript and there are missing pages, these will be noted. Also, if material had to be removed,
a note will indicate the deletion.
uest.
ProQuest 10104217
Published by ProQuest LLC(2016). Copyright of the Dissertation is held by the Author.
All rights reserved.
This work is protected against unauthorized copying under Title 17, United States Code. Microform Edition © ProQuest LLC.
ProQuest LLC
789 East Eisenhower Parkway P.O. Box 1346
Abstract
The human Epidermal Differentiation Complex (EDC) on chromosome lq21 consists of three structurally different, yet functionally related, gene families. Members of all three gene families have been shown to play important roles in epidermal differentiation. This thesis initially describes the assembly of a completely contiguous set of overlapping bacterial clones covering 2.45Mb of human genomic DNA from the lq21 locus, encompassing the entire EDC. All known genes (28) and eight DNA markers within the EDC are precisely localized to EcoRI restriction enzyme fragments that constitute a partial EcoRI and full Notl and Sail restriction enzyme map. The bacterial clones presented in this thesis have been accepted as the substrate for long range genomic sequencing of this region for the chromosome 1 sequencing project at the Sanger Centre, UK.
In addition to providing a template for large-scale sequencing, the bacterial clones presented here will serve as a molecular resource for the elucidation of all transcripts within the EDC as well as the study of transcriptional regulation, function and evolution of the EDC. As an evaluation of this resource as a tool for the identification of transcribed sequences, exon trapping has been performed from three PAC clones. The exon trapping experiments described in this thesis have identified 13 putative exons that are shown to derive from the EDC. Searches of the publicly available databases with the sequences of these 13 putative exons have identified a novel cDNA clone that is shown to localize to the EDC. Two of the thirteen putative exons identified are homologous, but not identical, to this novel cDNA. These data coupled with Northern blot and RT-PCR analysis, suggests that yet another novel family of transcribed sequences has been identified within the EDC.
Thirteen gene members of the SI00 family of calcium binding proteins constitute one of the three so-far identified multi-gene families residing in the EDC. By using the contiguous bacterial clone map towards the study of EDC evolution, two findings have been made. Firstly, evidence of an ancestral break-point inversion during the evolution of mammals is supported by the elucidation of the transcriptional orientation of four SI00 genes and by the identification of extensive alternative splicing of the 5’ untranslated region of one of these SlOO genes. Secondly, a similar clustering of SlOO genes to that seen in human and mouse is described for the first non
Acknowledgements
Many thanks are due to my supervisor, Dean Nizetic, for his time, support and patience during the writing of this thesis. Respect and thanks also due to the members of D ean’s
laboratory, past and present - Jurgen Groet, Rachel Flomen, Pedro Baptista, and Jane Ives.
Appreciation to the lq21 consortium, especially Ghazala M irza and Jiannis Ragoussis for fluorescent in situ hybridizations, is given.
With much love and respect I thank my wife to be, Clare, for huge support and encouragement during the past years.
This work has been funded by the Constance Bequest Fund, The School of Pharmacy, and the BMH4-CT96-0319 grant from the Commission of European Communities to the
Table of Contents
Title
1
Abstract
2
Acknowledgements 3
Table of Contents 4
Figure finder 15
Table finder 17
Glossary of Abréviations 18
Aims of This Thesis
21
Chapter 1: Introduction
22
1.1. Towards a complete nucleotide sequence of human chromosome 1 22
1.1.1. Human genome project strategy 22
1.1.2. Genetic mapping 23
1.1.3. Somatic cell hybrid lines and radiation hybrid mapping 23
1.1.4. Long-range physical restriction enzyme mapping 24
1.1.5. Cloning genomic DNA with vectors capable of
propagation within a host organism 24
1.1.5.1. Yeast artificial chromosomes 24
1.1.5.2. Bacterial vector/host systems 25
1.1.5.2.1. Cosmids 26
1.1.5.2.2. P I artificial chromosomes and
bacterial artificial chromosomes 27
1.1.6. Sequencing 28
1.1.6.1. Clone end-sequencing approach 28
1.1.6.2. Whole genome “shotgun” approach 29
1.1.6.3. Clone mapping approach 30
1.1.7.1 Global sequencing project 31
1.1.7.2. Chromosome 1 sequencing project 31
1.1.8. Global mapping and local mapping: parallel endeavors 32
1.2. Epidermal Differentiation 33
1.2.1. Epidermal Differentiation as a model for the study of cell
differentiation in general 33
1.2.2. Biological markers of epidermal differentiation 34
1.2.2.1. The keratins 34
1.2.2.2. Profil aggrin 36
1.2.2.3. The Comified Envelope (CE) - protein content 38 1.2.2.4. The Comified Envelope (CE) - lipid content 43
1.2.3. Regulation of epidermal differentiation 44
1.3. The Epidermal Differentiation Complex 46
1.3.1. Gene families constituting the EDC 46
1.3.1.1. Loricrin, involucrin and the SPRR (CE
precursor) gene family 46
1.3.1.2. Profilaggrin, trichohyalin, and repetin
(intermediate filament association) gene family 48
1.3.1.3. S 100 gene family 49
1.3.2. Gene complexes and multi-gene families 50
1.3.3. Locus control regions 51
1.3.4. Clustered multi-gene families generally reside in ‘gene-rich’
regions of the genome 53
1.4. Genetic disorders associated with human chromosomal region lq21 55
1.4.1. Disorders of the skin associated with lq21 55
1.4.2. Other disorders linked to lq21 56
Chapter 2: Materials and Methods
58
2.1. Materials 58
2.1.1. Specialized materials 58
2.1.2. Chemicals 59
2.1.3. Enzymes 59
2.1.4. DNA oligonucleotide primers 59
2.1.5. Nucleotides 62
2.1.6. DNA cloning vectors used 62
2.1.7. DNA size markers 63
2.1.8. Culture media 63
2.1.9. Solutions 64
2.1.10. Sources of genomic DNA 66
2.1.11. Sources of RNA 66
2.1.12. Northern blot 66
2.1.13. Host strains used 66
2.1.14. Bacterial clone libraries 67
2.1.15. IMAGE consortium cDNA clones used 67
2.1.16. COS7 cell line 67
2.2 Methods 67
2.2.1. Filter spotting and processing 67
2.2.2. Restriction enzyme digestion 69
2.2.3. Agarose gel purification of DNA 69
2.2.4. Retrieving single clones from microtitre plates 70
2.2.5. Agarose plug minipreps of S.cerevisiae containing YAC clones 71
2.2.6. Pulsed Field Gel Electrophoresis 71
2.2.7. Southern blotting 72
2.2.8. Radio-labeled probe preparation 72
2.2.9. Suppression of probe sequence over-represented within the
genome 73
2.2.10. Hybridization of membranes (filters) containing Southern
2.2.11. Polymerase Chain Reaction (PGR) amplification 74
2.2.12. Preparation of plasmid DNA 74
2.2.13. Glycerol stock production 76
2.2.14. Preparation of probes from bacterial clones 76
2.2.15. Dot blot construction 77
2.2.16. Competent cell preparation 78
2.2.17. Transformation of competent cells 78
2.2.18. Tissue culture of C 0 S 7 cells 78
2.2.19. Exon Trapping 79
2.2.19.1. Preparation of pSPLB vector 79
2.2.19.2. Preparation of bacterial clone insert DNA 79
2.2.19.3. Ligation and transformation 80
2.2.19.4. Electroporation 80
2.2.19.5. Reverse transcription and PCR 81
2.2.19.6. Sub-cloning secondary PCR products 83
2.2.19.7. Generation of 3^^ PCR for library screening 83
2.2.20. Sequencing template preparation 83
2.2.21. Genomic DNA preparation 84
2.2.22. cDNA construction 86
2.2.23. Northern blot hybridization 87
2.2.24. Sub-cloning cosmid DNA fragments into pBluescript*^ vector 87 2.2.25. Oligonucleotide DNA primer design and annealing temperature
Chapter 3: Construction of overlapping segments of human
DNA cloned in bacteria representing the lq21 region,
specifically the Epidermal Differentiation Complex
903.1. Summary 90
3.2. Introduction 91
3.2.1. Advantages of bacterial clone physical mapping 91
3.2.2. Mapping status of lq21 92
3.3. Production of a sub-library of recombinant bacterial clones enriched for
1 q 2 1 originating DNA 95
3.3.1. Starting material 95
3.3.2. YAC isolation 95
3.3.3. Verifying the YAC STS/EST content 96
3.3.4. Screening the cosmid and PAC libraries 97
3.3.5. Construction of tools for hybridization and PCR based screening
of the lq21 sub-library 102
3.3.6. First round screens with DNA markers 103
3.3.7. Contig linking 107
3.4. Further screening of the whole genome and flow sorted chromosome 1
bacterial clone libraries 111
3.4.1. Further screening of the main PAC library 111
3.4.2. Screening BAC and cosmid library 114
3.4.3. Identifying the contents of the EDC within the contig 114 3.5. Restriction analysis and fine alignment of clones within the contig 116
3.5.1. Coverage (contig depth) 121
3.5.2. Localizing genes and markers 122
3.5.3. New ESTs and STSs from the region 123
3.6. Integrated 2.45 mega-base map of human chromosomal region lq21
encompassing the entire EDC 123
3.6.1. Submission of the bacterial contig for large scale sequencing 126 3.6.2. Comparison of the integrated 2.45Mb bacterial map with previous
3.6.3 Precise ordering of genes and markers within the EDC 127
Chapter 4: Use of the integrated map as a platform for the
identifîcation of novel transcribed sequences within the
Human Epidermal Differentiation Complex (via Exon
Trapping)
1294.1 Summary 129
4.2 Introduction 129
4.2.1 cDNA libraries and their screening 130
4.2.2 cDNA selection 131
4.2.3 Global cDNA sequencing and mapping 132
4.2.4 Approaches to identify transcribed sequences directly from
genomic DNA without prior knowledge of the tissue of expression 132
4.2.4.1 Zoo blots 132
4.2.4.2 Linking libraries 133
4.2.4.3 Sequence annotation 133
4.2.4.4 Exon trapping 134
4.3 Generation of “exon trapped” libraries from selected EDC PAC clones 135
4.3.1 Starting material 135
4.3.2 Production of “exon trapped” libraries 136
4.4 Analysis of “exon trapped” libraries 137
4.4.1 Screening 137
4.4.2 Assessment of trapped exon sequence from S 100 genes within
the “exon trapped” libraries 139
4.4.3 Selecting clones to pick 142
4.4.4 PCR amplification 142
4.4.5 Analysis of PCR products 142
4.4.6 Sequencing PCR products from “exon trapped” clones 146
4.4.7 BLAST analysis 146
4.4.9 Overall statistics relating to putative exons identified 147 4.5 Analysis of “exon trapped” clones showing homology to database entries 149
4.5.1 Clone 128L15bH 15 149
4.5.2 Clone 127E12sC3 and related EST 149
4.5.2.1 Screening the “exon trapped” libraries with IMAGE
clone 1676497 152
4.5.2.2 PCR with primers designed from the 3’ end of IMAGE
clone 1676497 152
4.5.2.3 Direct sequencing of PAC clone 127 E12 with primers
derived from IMAGE clone 1676497 sequence 152
4.5.2.4 ORE analysis of IMAGE clone 1676497 and BLASTX
2.0.9 data 154
4.5.3 Clone 127E12sB4 154
4.5.4 Fine mapping of IMAGE clone 1676497 and “exon trapped”
clones 127E12sC3 and 127E12sB4 155
4.5.5 Genomic mapping of IMAGE clone 1676497 and “exon trapped”
clone 127E12sB4 156
4.6 Transcriptional analysis of putative exons and novel EST 158
4.6.1 RT-PCR data 158
Chapter 5: Use of the integrated map to provide insight into
the evolutionary events shaping the Epidermal
Differentiation Complex
1625.1 Summary 162
5.2 Introduction 162
5.2.1 Evolution of multi-gene families 162
5.2.1.1 Gene duplication 162
5.2.1.2 Diversification 163
5.2.1.3 Random genetic drift and natural selection 164
5.2.1.4 Molecular drive 164
5.2.1.5 Block duplication 165
5.2.2 Comparative genomics 166
5.2.2.1 Other vertebrate models - Fugu rubripes and Gallus
gallus 167
5.2.3 Epidermal Differentiation Complex 168
5.2.3.1 Evolution 168
5.2.3 2 Mouse EDC 170
5.2.3.3 Transcriptional orientation within the EDC located SlOO
gene family 171
5.2.3.4 Chicken EDC genes 172
5.3 S I 00A 1 and S I00A 13 transcript species and orientation 173
5.3.1 Library screening with S 100A 1 and S I 00A 13 173
5.3.2 Sub-cloning and sequencing of the S100A13 positive EcoRI
fragment from cosmid clone ICRFl 12cP0780 175
5.3.3 BLASTN 2.0.9 search of GenBank human EST database with
genomic sequence derived from cosmid clone IC R Fl 12cP0780 178 5.3.4 Identifying other SIOOA13 EST entries with novel 5 ’ end
sequences 180
5.3.5 Extending the 2,668bp genomic sequence with PCR products
5.3.6 SlOOAl exon 1 identified with additional sequence derived
from cosmid ICRFcPO?80 181
5.3.7 Identification of additional SI OOA 13 species of ESTs 183 5.3.8 RT-PCR analysis of the various identified S100A13 species
of transcribed sequences 183
5.3.9 Sub-cloning and sequencing of an S 1 OOA 13-positive Sau3A l
fragment from the 10q23 localized cosmid clone
ICRFl 12cL0496 190
5.4 Transcriptional orientation of other SlOO genes within the EDC 193
5.4.1 S I00A2 orientation determined from mapping data 193
5.4.2 SI OOA 12 orientation determined from mapping data 194
5.5 SlOO cross-species comparison: Ga//m5 195
5.5.1 Published Gallus gallus SlOO genes and human equivalent
comparison 195
5.5.2 Identification of Gallus gallus SIOOAIO 195
5.5.3 Chicken genomic cosmid library screening using Gallus gallus
S100A6 and SIOOAIO 196
5.5.4 Direct sequencing S100A6, SIOOAIO and comparison 198
5.5.5 Analyzing the presence of other SlOO genes in chicken
C h ap ter 6:
Discussion
207
6.1 Evaluation of the integrated map as a molecular resource 207
6.1.1 As a substrate for large scale sequencing 207
6.1.2 As a resource for the characterization of chromosome 1 -specific
repeats implicated in cancer 208
6.1.3 As a resource for transfection studies 210
6.1.4 As a substrate for evolutionary comparisons 211
6.2 Exon trapping as a method of identifying transcribed sequences within
the EDC 211
6.2.1 Efficiency of exon trapping 212
6.3 Analysis of “exon trapped” products and a cDNA clone identified 214
6.3.1 Clone 128L15bH15 215
6.3.2 Clone 127E12sC3 and related cDNA 216
6.3.3 Clone 127E12sB4 217
6.3.4 Evidence for a novel gene family within the EDC? 217
6.3.5 Other “exon trapped” clones 219
6.4 Is lq21 a gene rich region? 221
6.5 The role of evolutionary comparisons in understanding the EDC 223 6.5.1 Transcriptional orientation of the S 100 genes as an indicator
of the evolutionary processes defining the organization of this
multi-gene family 223
6.5.2 Organization of the mouse S 100 gene family located on a
genomic region syntenic with the human EDC 227
6.5.3 Implications on the possible presence of locus control regions 228 6.5.4 The first identification of an S 100 gene cluster within the
chicken genome 229
6.5.5 The existence of a non-mammalian EDC? 231
6.6 Further work 232
6.6.1 Further characterization of (potential) transcripts identified by
6.6.2 Systematic, optimized exon trapping and cDNA selection of
bacterial clones presented in the integrated map 233
6.6.3 Analysis of long-range genomic sequence generated by the
Sanger Centre 234
6.6.4 Further analysis of the chicken S 100 cluster 234
C on clu sion s
235
R eferen ces
236
Appendix I: Details of vectors used for restriction analysis 267
Appendix H: Table of EDC bacterial map confirmations 268
Appendix III: EDC novel sequences 270
Figure finder
1.1... ...
35
1.2... ...
47
3.1 ... 94
3.2
...
98
3.3 ... 100
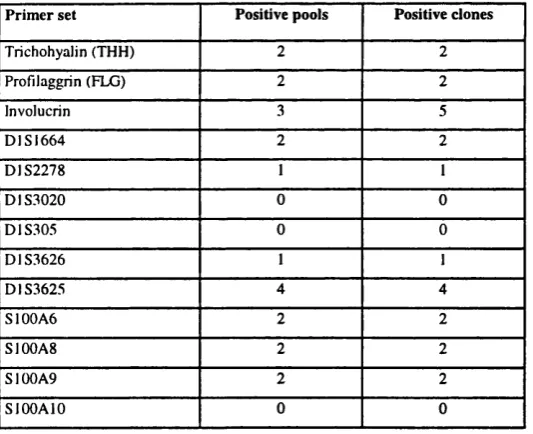
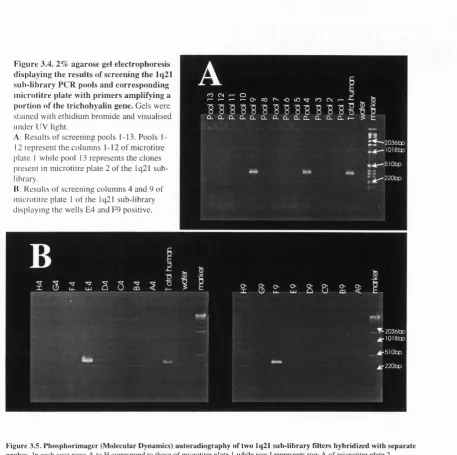
3.4
...
104
3.5
...
104
3.6 ... 106
3.7 ... 108
3.8 ... 109
3.9 ... 113
3.10 ... 118
3.11
...
119
3.12
124
4.1
...
138
4.2 ... 141
4.3 ... 143
4.4 ... 145
4.5 ... 151
4.6 ... 153
4.7 ... 157
4.8 159 4.9 ... 161
5.1... ... 174
5.2... 176
5.5 184
5.6 185
5.7 185
5.8 189
5.9 191
5.10 194
5.11 199
5.12 201
5.13 203
5.14 205
6.1 220
Table finder
Table 1.1... ... 40
Table 2.1 ... 60
Table 2.2 ... 67
Table 3.1... ... 96
Table 3.2 101
Table 3.3 103
Table 3.4 105
Table 3.5 I l l
Table 3.6 121
Table 3.7 121
Table 4.1 137
Table 4.2 139
Table 4.3 148
Table 4.4 160
Table 5.1 186
Table 5.2 196
Table 5.3 198
Table 5.4 200
Glossary of Abbreviations
ATP (dATP, ddATP, rATP) adenosine 5 ’ -jtriphosphate(deoxy, dideoxy, ribo)
BAC BIDS
bp BSA
bacterial artificial chromosome
Institute for Scientific Information Inc Science Citation Index Database
base pairs
bovine serum albumin
cDNA CE CEPH CGH Ci cM cpm CpG
CTP (dCTP, ddCTP, rCTP)
complementary DNA comified envelope
centre d'etude polymorphisme humaine comparative genome hybridization curie
centimorgans counts per minute 5’ CG 3’ dinucleotide
cytosine 5’ - triphosphate'deoxy, dideoxy, ribo)
DNA dNTPs DTT
deoxyribonucleic acid
deoxyribonucleic 5’ triphosphates dithiothreitol EDC EDTA EGF EST ETOH
epidermal differentiation complex ethylenediaminetetraacetic acid epidermal growth factor expressed sequence tag ethanol
FISH fluorescent in situ hybridization
GAPDH GDB GTP
GTP (dGTP, ddGTP, rGTP)
glyceraldehyde-3-phosphate dehydrogenase
Genome Database (http://www.hgmp.mrc.ac.uk/gdb/) guanosine trisphosphate
HEPES HGMP HGP HS
N-2-hydroxyethypiperazine-N’-2-ethanesulphonic acid human genome mapping project
human genome project DNase I hypersensitive site
IMAGE I.M.A.G.E. Consortium (integrated molecular analysis of genomes and their expression). Lennon et al, 1996
kb kilobase pairs
LCR locus control region
Mb MHC M-MLV MTP
megabase pairs
major histo-compatibility complex molony murine leukaemia virus minimal tiling path
NCBI national institute for biotechnology information
OD OMIM
optical density
OMIM (TM). Center for Medical Genetics, Johns Hopkins University (Baltimore, MD) and National Center for Biotechnology Information, National Library of Medicine (Bethesda, MD), 1999.
World Wide Web URL: http://www.ncbi.nlm.nih.gov/omim/ PAC
PCR PFGE PPARa
PI artifical chromosome polymerase chain reaction pulsed field gel electrophoresis
peroxisome proliferator-activated receptor alpha
RNA RPLB rpm P-ME
ridonucleic acid
random primed labeling buffer revolutions per minute
ssc
STC STS
sodium saline citrate sequence tagged connector sequence tagged site
TBE TE TIGR TG TGFa Tris tRNA
TTP (dTTP, ddTTP)
tris - borate/EDTA tris/EDTA
the institute for genomic research transglutaminase
transforming growth factor alpha tris(hydroxymethyl)aminomethane transfer-RNA
thymidine 5’ -triphosphate(deoxy, dideoxy)
rUTP U UK USA UV v/v
ribo-uracil 5’ - trisphosphate units
united kingdom united states of america ultra-violet
volume/volume
WUGSC w/v
Washington university genomic sequencing center weight/volume
YAC YLS
Aims of this thesis
The aims of this thesis are described generally by the title “Construction of an integrated map of the genomic locus lq21 harboring the Human Epidermal Differentiation Complex as a platform for the identification of all genes in this complex, the study of their
expression, function and evolution” . At the beginning of this thesis the three main areas of investigation were as follows:
1. Construction of an integrated map in ‘sequence-ready’ bacterial clones encompassing the entire Epidermal Differentiation Complex (EDC).
2. Identification of novel transcribed sequences within the EDC by using the bacterial clone map produced and the hypothesis that the EDC, like other complexes within vertebrate genomes, would reside in a ‘gene-rich’ region.
3. Contribute to the understanding of EDC evolution by use of the bacterial clone map produced. A species comparison of Homo sapiens and Gallus gallus was initiated.
Chapter 1: Introduction
1.1 Towards a complete nucleotide sequence of human chromosome 1
1.1.1 Human genome project strategy
The complete nucleotide sequence of the human genome will provide an invaluable reference point for the further understanding of human disease and biological function. The mammoth task of sequencing the some 3000 million base pairs of DNA is the ultimate goal of the human genome project (HGP). The HGP was initiated from the USA in 1990 by the two governmental bodies, the National Institutes of Health and the
Department of Energy. The fifteen-year program (estimated to cost $3 billion) was soon joined by the UK, France, Germany and Japan as an internationally collaborative project.
Towards the end of 1998 the projected deadline for the completion of the HGP was brought forward by two years, from 2005 to 2003 (Goodman, 1998).
The overall strategy of the HGP begins with the identification of reference points throughout the genome to facilitate mapping each of the 24 individual chromosomes. These reference points are specific stretches of sequence that can be positioned
coherently to a genomic region. The specific stretch of sequence, or sequence tagged site (STS), can take the form of an anonymous sequence template for PCR, a cloned genomic fragment, or an identified expressed sequence - formerly known as expressed sequence tagged site or EST (Olsen et al, 1989; Adams et al, 1991). Coherent positioning of these STSs or ESTs can be achieved by a number of mapping techniques (discussed below). Identifying and mapping STSs and ESTs is a circular and spiraling process - identifying STSs and ESTs facilitates mapping, which in turn facilitates the identification of STSs and ESTs. Technological advances increase the ability to achieve both goals.
ultimately suitability for sequencing of the cloned genomic fragment are dependent on the vector/host system used.
1.1.2 Genetic mapping
By following the segregation of polymorphic STS alleles through families, or pedigrees, a genetic map is produced (Donis-Keller et al, 1987; Weissenbach et al, 1992).
Segregation of STSs through generations can be followed due to the process of
homologous recombination between pairs of chromosomes during meiosis - the closer the proximity of two STSs, the more likely their alleles will be co-inherited. The STS in this case has to be polymorphic in order to follow two variant forms (alleles) on a pair of chromosomes as they segregate. The Centre d'Etude Polymorphisme Humaine (CEPH) collected DNA samples from carefully selected large families of at least three
generations. It is from this valuable resource (and others like it) that a great deal of genetic mapping information has been produced through collaborative projects (Murray
et al, 1994).
1.1.3 Somatic cell hybrid lines and radiation hybrid mapping
Human chromosomes can be separated onto a rodent background by the fusion of two somatic cell lines under chemical conditions, often resulting in uninucleate cells composing of chromosomes from both parental lines. Human chromosomes are
preferentially lost or deleted after rounds of culturing, enabling the establishment of cell lines containing few, single, or partial human chromosomes (Kao et al, 1976). By this means human chromosome specific markers can be generated or refined to chromosomal locations (McAlpine eta l, 1989).
Fragmenting chromosomes with a high dose of x-rays and then recovering the broken fragments on a rodent background can increase the resolution of somatic cell hybrid mapping. Broken ends of chromosomes are rapidly joined after x-ray exposure, usually resulting in the translocation or insertion of human chromosomes into rodent
distances can therefore be determined by estimating the frequency of breakage and separation in a manner similar to genetic mapping (Cox et al, 1990). This method, termed radiation hybrid mapping, has facilitated accurate mapping of a large number of STS and EST markers genome wide (Walter et al, 1994; Schuler et al, 1996).
1.1.4 Long-range physical restriction enzyme mapping
The ability to separate large multi-megabase fragments of DNA by pulsed field gel electrophoresis (PFGE) (Schwartz and Cantor, 1984) enables the construction of long- range physical maps by digesting DNA with restriction enzymes whose recognition sites are infrequently located along the length of human chromosomes (Barlow and Lehrach,
1987). The large DNA fragments produced by these ‘rare-cutting’ restriction enzymes are resolved by PFGE, transferred to a membrane (Southern, 1975), and recognized by DNA markers used as hybridization probes. This method has facilitated the construction of ‘restriction m aps’ covering large genomic regions, an example of which being the complete N otl restriction enzyme map of the entire long arm of human chromosome 21 (Ichikawa et al, 1993).
1.1.5 Cloning genomic DNA with vectors capable of propagation within a
host organism
Two main vector/host systems are used in direct physical mapping o f genomes for sequencing - yeast artificial chromosomes (YACs) and bacterial vectors (X-
bacteriophage, cosmid, PI-artificial chromosomes and bacterial artificial chromosomes).
1.1.5.1 Yeast artificial chromosomes
Yeast artificial chromosomes were first described in 1987 (Burke et al, 1987) and are able to clone large genomic DNA segments of up to 2 Mb (Larin et al, 1991 ; Chumakov
chromosomes were achieved by this means (Chumakov et al, 1992; Foote et al, 1992; Nizetic et al, 1994; Collins et al, 1995). This strategy has been further extended to produce a 75% coverage of the human genome in 225 YAC contigs with an average size of 10Mb (Chumakov et al, 1995). Higher resolution of an individual YAC clone can be achieved by randomly fragmenting the insert DNA at a specific end, thus producing a number of smaller clone derivatives. By sizing and ordering these derivatives a greater resolution of marker to marker distance and order can be achieved within a single clone or an overlapping set of fragmented clones (Lewis et al, 1992; Lioumi et al, 1998).
The major drawback in using YACs for faithful representation of genomic DNA is that a large proportion of clones suffer structural instability of insert DNA produced by
rearrangements, deletions and chimaerisms (Green et al, 1991). With no functional advantage conferred by the insert DNA present within a YAC clone, instability is not selected against. In fact a YAC clone containing a small insert will generally replicate at a faster rate than a YAC clone containing a larger insert, therefore any deletion early in the growth of a YAC clone colony or culture will predominate. Recombination between YACs can result in the deletion, rearrangement or the joining of DNA from different origins (chimaerism), thus reducing the advantages of YAC mapping. Additionally, even YAC clones with no rearrangements do not represent suitable substrates for sequencing, due to their large size and the relative difficulties faced in purifying cloned DNA from yeast genomic DNA. In some instances the sub-cloning of YAC DNA into smaller bacterial vector/host systems (which are more suitable for sequencing) has circumvented this problem. Although the bacterial sub-clones need to be ordered and the possibility of rearrangements can present a problem, this strategy has been employed with early human genomic sequencing such as within the major histocompatibility complex (MHC) on chromosome 6p (Shiina et al, 1999).
1.1.5.2 Bacterial vector/host systems
facilitates accurate restriction endonuclease mapping (Coulson e ta l, 1986) and provides a template for large scale sequencing (Sulston et al, 1992).
1.1.5.2.1 Cosmids
Cosmid based vectors were first described in 1978 (Collins and Hohn, 1978) and later modified (Hohn and Collins, 1980; Cross and Little, 1986) to clone up to 40kb of genomic DNA. The reduced size of the cloned insert DNA increases the resolution of a region represented by cosmid clones, but also increases the number of cosmids (and therefore the volume of work) needed to cover that genomic region when compared to YACs. In the case of a total genomic cosmid library, many more clones are needed to cover a similar genomic equivalent than would be needed by YAC clones. For example, a fivefold equivalent genome coverage in cosmid clones would be represented by close to 400,000 clones, whilst the number of YAC clones needed to provide equal coverage would be much smaller (if YACs averaged 800kb, 20 times the size of a single cosmid, then only 20,000 YAC clones are needed, 20 times less, to give similar genome
within a laser detection system. The availability of a cell line that gives an identifiable pattern of fluorescent emissions (or flow-karyotype profile) for the particular
chromosome of interest is of paramount importance (Davies et al, 1981). The use of somatic cell hybrid lines containing human chromosomes is particularly useful, as rodent chromosomes are considerably smaller and more uniform in size than human
chromosomes.
Although cosmid clones represent an important bacterial host/vector system that has contributed to high-resolution mapping and sequencing, a number of factors present difficulties when mapping large genomes (such as the human genome) with cosmid clones. The sheer size of the human genome means that the number of cosmids needed to provide ultimate coverage is large (400,000 for a five-fold equivalent). In addition
cosmid clones are occasionally susceptible to deletions and rearrangements within the insert DNA. This has been shown to be a result of the high plasmid copy number (up to 50) when using conventional cosmid vectors (Kim et al, 1992). With a large number of identical plasmid copies within a bacterial cell, recombination between plasmid DNA, as a result of repetitive elements (likely to be present within the 40kb insert, Smit, 1996) is thought to mediate rearrangement and deletion events.
1.1.5.2.2 PI artificial chromosomes and bacterial artificial chromosomes
1.1.6 Sequencing
Sequencing of genomic DNA proceeds from small fragments (1.4 - 2.2kb) derived from bacterial clones (or in some cases total genomic DNA, see below) which are sub-cloned into bacteriophage M l3 or plasmid vectors (Bankier et al, 1987) for sequencing by the chain termination method (Sanger et at, 1977). This sub-cloning is random and termed
‘shotgun’ cloning. Sequence reads from random shotgun clones are assembled into contigs on the basis of sequence overlap. These contigs represent an ‘unfinished’ stage where sequence gaps remain. Closing of sequence gaps (or ‘finishing’) is then facilitated by direct sequencing of the bacterial clone (another stage is needed before this can take place when shotgun cloning from total genomic DNA, discussed below) effectively linking the edges of the sequenced contigs (Sulston et al, 1992). This represents the basic strategy for genomic sequencing. Variations to this theme, as well as a more detailed look at the HGP strategy are discussed below.
1.1.6.1 Clone end-sequencing approach
displaying a minimal overlap based on fingerprint analysis are themselves sequenced. It is proposed that sequencing of the entire genome will be generated from as little as 20.000 completely sequenced BAC clones.
Although this project is underway it has been argued that a proportion of redundancy in (and therefore wasteful) sequencing will be completed (the Sanger Centre and the W ashington University Genome Sequencing Centre, 1998). The random selection of 3.000 clones is unlikely to be equally spaced throughout the genome. However, recent data suggests this might not be the case (Mahairas et al, 1999). As of February 1999, 314.000 BAC end sequences (known as sequence-tagged connectors, STCs), constituting approximately 135Mb of sequence (4.5% of the human genome), had been produced by The Institute for Genomic Research (TIGR) in collaboration with two groups at the University of Washington. The projected number of STCs to be generated has increased from 600,000 to 900,000 (Venter et al, 1996; Mahairas et al, 1999). Analysis of the current 314,000 STCs produced gives the following findings. The average length of an STC is 432bp, of which the average non-repetitive sequence o f this is 281 bp (the human genome contains a substantial amount of repetitive sequence, reviewed in Smit, 1996). Over 75,000 DNA fingerprints, (representing 77% of the BAC clones used to generate STCs) have been produced. 5% of the fingerprinted clones are seen to contain artifacts. New repetitive elements within the genome have been identified from STC sequence. The estimated random distribution of STCs across the genome is 1 per 6kb, the mean
distribution of 275 STCs across more than 1.8Mb of sequence gives a value o f 1 per 6.6kb. Non-repetitive STC sequences are rarely identical, suggesting they are not clustered within one genomic region, while the mean GC content is 40.2%, very similar to that of the whole genome (Saccone et al, 1993).
1.1.6.2 Whole genome “shotgun” approach
journal issue, a complete rejection of this strategy was made citing convincing arguments against the supposed advantages (Green, 1997).
W ith the announcement of a technological advance in sequencing equipment from PE Applied Biosystems, coupled with the data produced from the BAC end sequencing project, an actual strategy of whole genome shotgun sequencing was initiated (Venter et al, 1998). The technological advance made by PE Applied Biosystems was the launch of a new sequencing machine, the A B I3700. Apparently, the machine is capable of
processing 1000 samples a day with minimal operating time (approximately 15 minutes when compared to 8 hours for the pre-existing equipment). The Institute for Genomic Research (TIGR) and Perkin-Elmer have initiated what they predict to be a 3-year program, costing between $200-250 million (compared to the $300 million of the HGP) which includes laboratory infrastructure costs and all computational equipment needed to analyze the data.
The strategy (similar to that proposed by Weber and Myers) is based on fragmenting total genomic DNA into small (2-lOkb) fragments and then cloning these fragments into a two vector system. The need for multiple cloning vectors is due to the regions of the genome that seem to be unclonable in a single particular vector. A large number of small fragment (2kb) clones (30,000,000 in total) and larger fragment (lOkb) clones (5,000,000 in total) are produced with two separate vectors respectively, creating a 31 fold coverage of the genome. Initially all clones are not completely sequenced, only their ends. By incorporating the BAC end sequencing data, a total of 46-fold coverage will be achieved. By this approach, it is estimated that 99.9% of the genome will be sequenced by 2003, although the authors accept that they cannot predict with confidence how many gaps, or how many unclonable or unsequenceable regions will be encountered (Venter et al,
1998).
1.1.6.3 Clone mapping approach
fingerprinting. Contigs are extended by generating new markers either from the ends of bacterial clones or from YAC clones bridging distances between the original markers used. Bacterial clones are selected for sequencing on the basis of redundancy (determined from fingerprinting), STS content, and chromosomal localization determined by
fluorescent in situ hybridization (FISH). As of September 1998, these two groups have mapped approximately 890Mb coverage in bacterial clones and sequenced over 98Mb (3.3% of the genome). Projected finished sequence output is expected to rise to 150- 200Mb per year. No marker tested has failed to identify a positive clone within the libraries being used. On chromosome 22q, the longest contig produced is estimated at 14.7Mb and any gaps between contigs are being actively pursued. This general approach is said to present two advantages over the end sequencing and whole genome shotgun approaches. Firstly, neither of these two approaches can be coordinated to minimize overlap of sequencing and secondly, neither utilizes current mapping information to order and verify clone fidelity (SC and WUGSC, 1998; Green, 1997).
1.1.7 Current status of publicly available genome sequencing
1.1.7.1 Global sequencing project
As of May 1999 420.2Mb (13.1%) of finished human genome sequence is available in the public domain, while 328.3Mb are awaiting finishing (10.2% of the human genome). These statistics were obtained from the National Institute of Biotechnology (NCBl) at: http://www.ncbi.nlm.nih.gov/genome/seq/pag.cgi ?F=HsHome.html&ORG=Hs
1.1.7.2 Chromosome 1 sequencing project
As part of the HGP initiative the Sanger Centre (Hinxton, UK) has undertaken
approximately 15Mb in 1998. The projected date for the complete sequence of chromosome 1 is 2005.
Data obtained from the report of the Fourth International Workshop on Human Chromosome 1 Mapping (Gregory et aU 1998) details statistics on chromosome 1 mapping progress. Integration of publicly available datasets described that 4,024 PAC clones and 1,998 YAC clones had been localized to chromosome 1. Over 100Mb covered by PAC clones had been ‘fingerprinted’ and over 3000 STSs has been hybridized to bacterial clone libraries.
1.1.8 Global mapping and local mapping: parallel endeavors
Global mapping initiatives have been implemented by large institutions capable of generating vast quantities of sequence on a weekly basis. These institutions are essential if the projected target of 2003 is to be reached. The overall strategy of the ‘global’ bacterial-clone based mapping approach (adopted by institutions within the HGP framework), has been based on the pioneering work of smaller ‘local’ mapping groups, studying specific regions of the genome that are of particular biological interest (such as the so-called ‘Down syndrome critical region’ on human chromosome 21, Osoegawa et al, 1996). Work being undertaken by ‘local’ mapping groups is actively encouraged by large mapping and sequencing institutions such as the Sanger Centre (Hinxton, UK), who readily incorporate collaborative data into their global programs (Gregory et al, 1998).
1.2 Epidermal differentiation
The outer epidermis of an organism is the first line of defense between itself and the environment. The epidermis must provide properties to shield the organism from desiccation, physical, mechanical, chemical and microbial assault. For example, human infants born prior to 30 weeks gestation (normal gestation period is 40 weeks) lack a skin barrier and can suffer from fluid imbalance, heat loss and infection (Cartlidge and Rutter,
1992). In the mammalian epidermis, the sequential process of keratinization provides shield function. Keratinization is effected by kératinocytes (the major epidermal cell constituent) during terminal differentiation as they migrate from the epidermal basal layer (point of origin), to the epidermal stratum comeum. Kératinocytes at the outermost layer (stratum corneum), having undergone terminal differentiation, become lifeless, flattened, squames, and are eventually sloughed into the environment. During keratinization, epidermal cells follow a programmed regulation of gene activity, thus facilitating the necessary modifications to protein structure and expression. Many genes encoding structural, functional, and transcriptional proteins playing a part in terminal
differentiation of the epidermis have been identified. A number of models have been presented to describe the involvement of the wide variety of proteins in keratinization. This introduction hopes to present to the reader a brief outlook on the current
understanding of these processes.
1.2.1 Epidermal Differentiation as a model for the study of cell
differentiation in general
The mammalian epidermis presents an insightful model of differentiation. Cells follow a programmed life cycle beginning at a specific site of origin and migrating through spatially organized layers (directly relating to maturation) until they reach a specific site of termination. This cycle progression is continuous throughout the mammalian adult life, thereby not limiting observations to early embryonic development as with other cell types of tissues and organs within the body (central nervous system, for example).
characteristics (Leigh and Watt, 1994). Much of the current understanding of keratinization has come from investigating cultured kératinocytes under varying conditions.
Kératinocytes are common targets for neoplastic transformations. The incidence of skin cancers throughout southern USA and Australia now exceeds all other cancers combined, and is still increasing (Brash, 1997). A consistent characteristic of malignant human kératinocytes in culture, is aberrant terminal differentiation - it has been proposed that this might be a necessary step in the neoplastic transformation of these cells in vivo
(Rheinwald and Becket, 1980; Yuspa and Morgan, 1981). Understanding how terminal differentiation is regulated will not only elucidate the transformation processes, but will also present valuable information regarding cell cycle and tumor progression in general.
1.2.2 Biological markers of epidermal differentiation
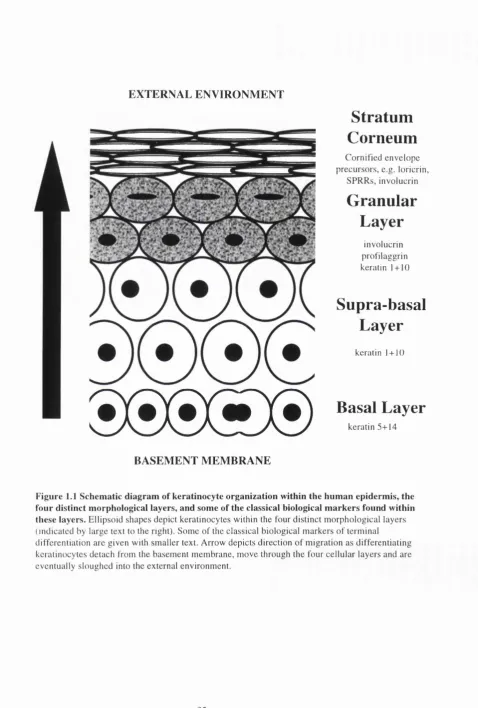
The morphological state of the keratinocyte can be classified into four phenotypically distinct groups corresponding to four epidermal cellular layers. Figure 1.1 displays a schematic of these cellular layers and indicates the relative location of a number of proteins classically used as biological markers of epidermal differentiation (for reviews see Watt, 1989; Christiano, 1997; Eckert et al, 1997). The following paragraphs detail the history and current understanding of these markers.
1.2.2.1 The keratins
The keratins are a class of intermediate filament proteins present as various species throughout the differentiating epidermis. Intermediate filament proteins are, in general, thought to be
involved in the physical co-ordination of cell shape and nuclear centration as well as maintaining cell differentiation (Franke, 1987). In the epidermis, keratins are critical in maintaining
cytoskeletal integrity, cell-cell interactions and contribute to specific structures within a differentiating keratinocyte (Corden and McLean, 1996). The protein content of a fully
EXTERNAL ENVIRONM ENT
ή®®®
Stratum
Corneum
Cornified envelope precursors, e.g. loricrin,SPRRs, involucrin
G ranular
Layer
involucrin profilaggrin keratin 1 + 10
Supra-basal
Layer
keratin 1 + 10
Basal Layer
keratin 5+14BASEMENT MEMBRANE
Over 30 keratin genes that are differentially expressed in epithelial cells can be found within the human genome (Fuchs and Cleveland, 1998). Keratin protein sequences conform to the basic blueprint of all intermediate filament proteins - an approximately 310 amino acid central alpha-helical rod domain, flanked by end domains highly variable in sequence and structure (Blumenburg, 1993). Two sub-families exist: basic and acidic. One member o f each family must be present for the formation of a keratin 'couple', aligned via the interaction of the two alpha-helical regions. Each member has a preferred couple, such as the K5 and K14 couple which composes 20-25% mass o f cells at the basal layer and are one of the molecular markers of the this layer (Fuchs and Cleveland,
1998).
Comprising the basal layer and attached to the basement membrane are the basal cells, which contain a population of stem cells. These highly proliferative stem cells represent an undifferentiated keratinocyte and give rise to the population of terminal differentiating cells. Morphological changes occur once a keratinocyte detaches from the basal
membrane, primarily with an increase in size and the production of the keratin K l/K lO marker couple. The density of the desmosomes (cellular junctions) also increases, with the overall resulting morphology said to be spinous, coining the term spinous layer, also referred to as the supra-basal layer. Most cells within the supra-basal layer have lost the ability to proliferate but are metabolically active.
Other keratins are expressed selectively depending on tissue type. K9 is localized exclusively to the skin of palms and soles, while K6, K16, and K17, are expressed in the supra-basal layer of palms, soles, nails, hairs, and in oral and genital mucosal surfaces (Christiano, 1997; Ekanayake-Mudiyanselage e ra /, 1998).
Above the supra-basal layer lies the granular layer, so termed due to the presence of membrane coating granules, L-granules and keratohyalin granules. Keratohyalin granules are rich in the protein filaggrin (Lee et aU 1993).
1.2.2.2 Profilaggrin
specific terminal domains flanking the block of tandemly repeated filaggrin units, which are individually separated, by linker domains. Human profilaggrin contains a variable number of filaggrin units ranging from 10-12 and is highly heterogeneous with 39% of the 324 amino acid positions variable (out of a sample of 11 cDNA clones; Gan et al.,
1990). Evidence suggests that the expression of profilaggrin is suppressed at the transcriptional level until very late on in the granular layer, although the mechanism of suppression is unknown (Mckinley-Grant et at., 1989).
Profilaggrin accumulates in a non-functional, phosphorylated form within keratohyalin granules. Early in the final layer (stratum comeum), profilaggrin is dephosphorylated and proteoliticaly cleaved by the excision of the short peptide linker sequences to yield functional filaggrin molecules. Functional filaggrin molecules aggregate keratin
intermediate filaments (KIF) into tightly aligned bundles called macrofibrils, which are packed into the flattened squames of the upper stratum comeum (Dale et at, 1994). The process of tightly aligning KIF into macrofibrils severely alters cell shape and facilitates cytoskeletal collapse within a single cell layer between the granular layer and the stratum corneum, indicating that this is a highly regulated event (Kuechle et at, 1999).
Less is known about the terminal domains of profilaggrin and their role in epidermal differentiation. M ost of the information available is focussed on the amino terminal domain, which can itself be divided into two sub domains, A and B. The A domain is 81 amino acids in length, is hydrophobic, and contains two calcium binding E-F hand motifs which display homology to those of the S I00 protein family (see section 1.3.1.3). The B domain consists of 212 amino acids and is highly hydrophilic. The amino acid sequences of domain A (predicted from cDNA clones) display greater than 90% identity among rat, mouse and human profilaggrin. Homology between the filaggrin repeats of these three species is less (42% to 60% identity) leading to the suggestion that domain A is of functional importance (Presland et at, 1995).
targeting into keratohyalin granules as well as other calcium dependent processes during terminal differentiation (see 1.2.3).
Distinct conformational changes occur as a keratinocyte migrates through the granular layer and into the stratum comeum. Additional proteins, lipids and cell surface
carbohydrates are synthesized while proteins that are no longer needed, nucleic acids, and even whole organelles are successively destroyed. The final terminally differentiated keratinocyte is a flattened squame composed of mainly macrofibrils, enclosed in a highly insoluble protein structure termed the cornified envelope. It has been proposed that unused filaggrin molecules are degraded into mostly free amino acids which are used in maintenance of epidermal osmolarity and flexibility (Dale et al, 1994). However, it has also been demonstrated that filaggrin is incorporated into the cornified envelope (see below).
1.2.2.3 The Cornified Envelope (CE) - protein content
The final process of a terminally differentiating keratinocyte is the deposition of a highly insoluble structure on the inside of the plasma membrane, termed the cornified envelope (CE). This structure replaces the plasma membrane in lifeless, flattened squames, and is the mammalian front line defensive shield (for review see Riechert et al., 1993, Hohl and Roop, 1993).
The CE is an amalgam of proteins (90%) cross-linked by a membrane bound transglutaminase (TG) via covalent bonds, into a rigid scaffold with lipids (10%)
covalently attached to its external surface (Swartzendruber et al., 1988). Three epidermal transglutaminases have been studied in detail, two of which are cytosolic: TOE and TOC, and one of which is membrane bound: TGK (Park et al., 1988). TGC is expressed in the basal layer and is thought to play a role in stabilization of the dermo-epidermal junction (Aeschlimann et al, 1998), rather than in CE formation (TGC is induced by retinoic acid, a potent inhibitor of CE formation; Thacher and Rice, 1985). The membrane bound TGK is certain to participate in envelope formation, while the possibility of TGE involvement has not been ruled out. TGE could play a role, as it is thought that TGK would be
1985). Expression of TGE has been demonstrated in cultured kératinocytes but not in vivo (Aeschlimann et al, 1998). Recently, an additional TG has been identified, TGX. Early evidence suggests a role in CE formation based on expression increases in differentiating kératinocytes (Aeschlimann et at, 1998).
Two distinct types of CE have been identified via Normarski contrast microscopy: fragile and rigid. CEs recovered by tape stripping from the granular layer/stratum
corneum interface show a considerable presence of fragile CEs, while tape stripping from the upper stratum comeum reveals only rigid CEs (Michel et a l, 1988), This provided the first clues that CE formation is a process of sequential layering of components. More evidence for such a model comes from the identification CE components.
Elucidating the exact nature and composition of the CE has proven difficult due to the irreversible cross-linked nature of the structure. The isodipeptide bonds cannot be hydrolyzed to release intact proteins without the use of reagents that also cleave peptide bonds. A number of clues can point towards a protein being a constituent of the CE, such as its ability to serve as a transglutaminase substrate, reactivity to antibodies of the CE, mRNA abundancy in the epidermal upper layers, or its ability to become cross linked.
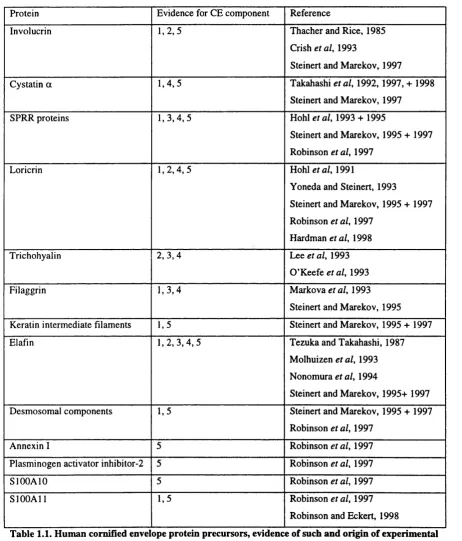
Table 1.1 lists the majority of literature cited CE components. Others exist, particularly a number of unidentified components of known mass (Steinert and Marekov, 1995;
Protein Evidence for CE component Reference
Involucrin 1 ,2 ,5 Thacher and Rice, 1985
Crish etal, 1993
Steinert and Marekov, 1997
Cystatin a 1 ,4 ,5 Takahashi etal, 1992, 1997, + 1998 Steinert and Marekov, 1997
SPRR proteins 1 ,3 ,4 , 5 Hohl etal, 1993 + 1995
Steinert and Marekov, 1995 + 1997 Robinson etal, 1997
Loricrin 1 ,2 ,4 , 5 Hohl eta l, 1991
Yoneda and Steinert, 1993
Steinert and Marekov, 1995 + 1997 Robinson et al, 1997
Hardman etal, 1998
Trichohyalin 2 ,3 ,4 Lee etal, 1993
O ’Keefe era/, 1993
Filaggrin 1 ,3 ,4 Markova etal, 1993
Steinert and Marekov, 1995 Keratin intermediate filaments 1,5 Steinert and Marekov, 1995 + 1997
El afin 1,2, 3 ,4 ,5 Tezuka and Takahashi, 1987
Molhuizen etal, 1993 Nonomura et al, 1994
Steinert and Marekov, 1995+ 1997 Desmosomal components 1,5 Steinert and Marekov, 1995 + 1997
Robinson eta l, 1997
Annexin I 5 Robinson et al, 1997
Plasminogen activator inhibitor-2 5 Robinson etal, 1997
SIOOAIO 5 Robinson et al, 1997
SlOOAll 1,5 Robinson eta l, 1997
Robinson and Eckert, 1998
Table 1.1. Hum an cornified envelope protein precursors, evidence of such and origin of experim ental data. Evidence: 1 - demonstrated cross-linking via N^-(y-glutamyl)lysine isodipeptide bonds. 2 -
immunogold/ immuno-fluorescent electron microscopy. 3 - immunoblotting/staining. 4 - mRNA
Steinert and Marekov site that the ultimate definition for a CE constituent is an identifiable protein sequence cross-linked by a membrane bound transglutaminase- catalyzed, isodipeptide bond. In the first of two studies, Steinert and M arekov predicted CE composition by treating purified CEs from human foreskin with low-specificity proteases over a period of two to four days, followed by direct amino acid sequencing of the many peptides recovered and immunogold electron microscopy, using monospecific antibodies. This elucidated much of the cytosolic portion of the CE, but was unable to identify involucrin or cystatin a (two proteins they suggested as initial envelope scaffold - Steinert and Marekov, 1995). The second study identified involucrin with immunogold microscopy after removal of extracellular lipids (seel.2.2.4)with methanol/KOH and also identified cystatin a (amongst others - see table 1.1) via protein digestion and sequencing of released peptides (Steinert and Marekov, 1997).
Robinson and co-workers used CNBr digestion, followed by trypsin and then proteinase K treatment of CEs from cultured kératinocytes to release peptides, which were purified and sequenced to predict CE composition. These two independent studies using slightly different digestion techniques of CEs from different sources produced varied results. Steinert and Marekov demonstrated the presence of elafin, filaggrin, KIF, loricrin, involucrin, cystatin a , desmosomal components, SPRRl and SPRR2. Robinson e ta l,
demonstrated the presence of SIOOAIO and SlOOAl 1 (two previously unknown CE components) as well as annexin-I, desmosomal proteins, SPRRs, plasminogen activator inhibitor-2, and ivolucrin. Surprisingly, no evidence of loricrin was determined by
Robinson et al, 1997, although it is widely accepted that loricrin is a major precursor (see table 1.1).
show cross-linking of the human homologue as well as the murine loricrin (Yoneda and Steinert, 1993).
The middle layer of the CE includes the proteins elafin, loricrin and members of the SPRR family, while the outer layer includes involucrin, cystatin-a and perhaps further unknown proteins. Transgenic mice over expressing human involucrin display an abnormal phenotype, suggesting that this protein forms part o f the essential internal structure (Crish e ta l., 1993).
Although evidence of keratins and filaggrin present in the CE are seen after rounds of proteolysis, it is possible that this is a result of contamination of these proteins from the CE/macrofibril junction. The desmosomal proteins desmocolin 3a/3b, desmoglein 3, desmoplakin I, plakoglobin, envoplakin, and plakophilin are possibly located toward the middle and outermost layers of the CE. Evidence o f desmoplakin cross-linked to elafin in the middle layer was seen (Steinert and Marekov, 1995).
Based on the amino acid composition of proteins known to isolate to the stratum corneum, Steinert and Marekov used a mathematical model to determine that the CE is composed of the following:
loricrin <70% filaggrin 8% elafin 6% SPRRs 5% cystatin a 5% involucrin 2% keratins 2%
The model is limited to known proteins but is based on the overall amino acid
Three mechanisms involved in facilitating precursor proteins to the site of envelope formation have been proposed. The first describes precursors diffusing passively to the vicinity of a TG and being cross-linked via an intermediary complex formed with the enzyme. The second model proposes vesicle delivery of the precursor, while the third describes ‘envelope organizer proteins’, with annexin I as the given example (Robinson
et al, 1997). In this model it is suggested that, as calcium levels rise within the differentiating cell (calcium regulates differentiation, see below) annexin I (which is known to bind membrane phospholipids in the presence o f calcium) forms a complex with SlOOAl 1 and moves to the inner surface, facilitating binding to the plasma membrane (Robinson et al, 1997).
Analysis of in vivo expression of certain CE precursor proteins reveals that, although expression is restricted to keratinocyte terminal differentiation, differences can be seen in the locality of expression. As with certain keratins (see 1.2.2. l)pther CE precursor
proteins are differentially regulated. Involucrin is present in all squamous epithelia while loricrin is found solely in keratinizing epithelia. SPRRl is localized predominantly in follicular epidermis and oral mucosa, SPRR2 is expressed in follicular and inter-follicular epidermis, while SPRRS is absent in epidermis and strongly expressed in internal
squamous epithelia (Lohman et al, 1997).
1.2.2.4 The Cornified envelope (CE) - lipid content
(û-hydroxyceramides derive in large part from hydrolysis of glucosylceramides, mediated by the stratum comeum p-glucocerebrosidase enzyme. This hydrolysis is initiated by four distinct sphingolipid activator proteins that are functionally produced via cleavage of a single, large precursor protein, prosaposin (Doering et al, 1999). It has been demonstrated that the targeted deletion of murine prosaposin in transgenic mice produced either a neonatally fatal or a later onset fatality of complex pathology that included an ichthyosiform phenotype (see 1.4.1), indicating that prosaposin, and therefore
sphingolipid activator proteins, are required for normal epidermal differentiation (Doering et al, 1999).
More recently, a novel function of TGK has been identified in that it can form ester bonds between specific glutaminyl residues of involucrin and long-chain co-
hydroxyceramides (Nemes et al, 1999). This is the first study to identify specific attachments of protein CE components to lipid CE components via TG activity, and confirms suggestions that involucrin forms the initial protein scaffold of the CE.
1.2.3 Regulation of epidermal differentiation
Determination of epidermal differentiation regulation has concentrated on two main areas: the induction of terminal differentiation (by demonstrating expression of markers) and the expression of individual gene and protein markers. Early in vitro studies show that Ca^"^ (Yuspa et al, 1989), cell density (Ryle et al, 1989) and depletion o f retinoic acid (vitamin A - Fuchs and Green, 1981) induce terminal differentiation based on the
presence of markers such as filaggrin and the keratin couple K l/K lO . Transcription of loricrin is induced in the same manner (Hohl, e ta l 1991). Ca^"^ and TPA (12-0- tetradecanoylphorbol-13-acetate) induces involucrin expression (Takahashi and Ezuka,
1993) as do isoforms of protein kinase C (Takahashi et al, 1998) and the transcription factor SPl (Banks et al, 1999).
Keratinocyte proliferation and differentiation is regulated by an increasingly large number of growth factors and cytokines (Gibbs et al, 1998). This is not surprising
has been proposed that platelet activating factor is an intrinsic regulator of keratinocyte proliferation and differentiation (Shimada et al, 1998). Activin A is indicated in the inducement of cultured keratinocyte differentiation and the suppression of proliferation (Seishima et al, 1999). Sulfur mustard induces markers of terminal differentiation and apoptosis in kératinocytes (Rosenthal et al, 1998). Activators of the nuclear hormone receptor PPA R a also stimulate keratinocyte differentiation (Hanley et al, 1998).
Very recently, a member of the ‘kruppel’ transcription factor family, klf4, was demonstrated to be crucial in the orchestration of correct murine epidermal barrier function (Segre et al, 1999). Mice, homozygous for a targeted deletion (knockout) o f the murine klf4 gene, displayed loss of barrier function without gross alterations to the process of epidermal differentiation, followed by lethality after 15 hours. Loss of barrier function was demonstrated by weight loss, measured hydration of the skin (tested by surface electrical capacitance), and dye exclusion. Ultrastructural data suggested resulting alterations in CE formation and gross defects in the secretion or deposition of lipids onto the CE scaffold. Subtractive hybridizations identified three murine CE precursor proteins to be up regulated in klf4-/- mice: SPRR2a; repetin (Krieg et al, 1997); and plasminogen activating inhibitor 2. This data suggests that removal of transcription factor klf4 up- regulates certain CE components, leading to abnormal CE formation via the normal differentiation pathway (Segre e ta l, 1999).
gradients in the skin regulate morphogenesis via temperature sensitive regulatory pathways (Gibbs e ta l, 1998).
1.3 The Epidermal Differentiation Complex
A remarkable clustering of three gene families involved in epidermal terminal
differentiation is seen within a genomic segment of human chromosome lq21. This is why this segment has been termed the Epidermal Differentiation Complex and is defined by an approximately 2Mb stretch of human chromosome lq21 (Mischke et al, 1996). The Epidermal Differentiation Complex (EDC) contains 28 genes of three families and
includes a number of the classical biological markers of terminal differentiation,
discussed in the previous section (1.2). Figure 1.2 shows a schematic of the EDC and its location on human chromosome 1.
1.3.1 Gene families constituting the EDC
1.3.1.1 Loricrin, involucrin and the SPRR (CE precursor) gene family
1q21
0Mb
0 . 5 __
1Mb
1.5
2Mb
r ~ ~ i SIOOAIO r ~ r —1 S lO O A ll
THH
FLG
INV
SPRR
LOR S1 0 0 A 9 /1 2 S1 0 0 A 8 r— 1 S1 0 0 A 7
S 1 0 0 A 6 -2
SlOOAl 3 SlOOAl
Figure 1.2. Human Epiderm al D ifferentiation Com plex on chrom osom e lq21.
1.3.1.2 Profilaggrin, trichohyalin, and repetin (intermediate filament association) gene family
The second family consists of three genes encoding the intermediate filament association proteins filaggrin (section 1.2.2.2), trichohyalin (Mckinley-Grant e ta l, 1989; O ’Keefe et al, 1993), and the less characterized protein repetin (Krieg et al, 1997; Huber et al, 1999). Trichohyalin and repetin are similar to profilaggrin in that they share almost identical exon structure and contain two functional calcium-binding domains of the E-F hand type. The first exon is short and purely untranslated, followed by an intermediate second exon of both untranslated and translated sequence, and a long final exon, containing the majority of coding sequence and 3’ untranslated sequence (Markova et al, 1993 and Lee
et al, 1993). Both trichohyalin and profilaggrin are thought to aggregate keratin intermediate filaments (KIF), although in different ways and in different tissues.
Trichohyalin functions to cross-link KIF into loose networks in the inner root sheath cells of the hair follicle as well as the granular layer of the epidermis (Lee et al, 1993), while filaggrin functions to tightly aggregate KIF into bundles, solely in the granular layer of the epidermis (Ishida-Yamamoto e ta l, 1997a). Although it has been demonstrated that profilaggrin and trichohyalin are co-expressed, they have distinct expression and
processing mechanisms (Ishida-Yamamoto eta l, 1997a). Even though both proteins are known substrates for TG, it is still debatable whether or not these proteins are precursors of the CE (Steinert and Marekov, 1995 and Ishida-Yamamoto et al, 1997a).
Repetin was first isolated by subtractive cDNA cloning of benign and malignant tumors of mouse skin (Kreig et al, 1997). Cloning and characterization of repetin described a novel gene exhibiting striking similarity to profilaggrin and trichohyalin, and co
localization to mouse chromosome 3. Expression of the repetin gene is seen in stratified internal epithelia and normal skin epidermis, where it is restricted to the differentiated suprabasal layers (see 1.2.2.1). Based on the high presence of glutamine residues within the central repetitive domain, it has been speculated that repetin could act as a substrate for transglutaminase-mediated cross-linking (section 1.2.2.3). Human repetin has been cloned and localized to human chromosome lq21 (see chapter 3) and has been