INTRODUCTION
Purine bases are constituent part of nucleic Acid. 8-Azagunine is one of the unnatural purine base, not available normally in biological systems. The action of such unnatural base which is of course confined only to a limited number of cases seems to be two fold : (a) Unnatural purine bases generally block some stage in the process of biosynthesis of the normal purine nucleotides. In this context mention may be made of the inhibition of biosynthesis of guanosine monophosphate by AZN. (b) These bases themselves after conversion to nucleotides, are incorporated in varying degree, although this incor poration may result in an abnormal form1-3. The metal complexes of 8-Azaguanine are scantly known, In this paper use of paper electrophoresis technique5-25 is described in the study of metal complexes involving 8-Azaguanine as ligand.
Oriental Journal of Chemistry Vol. 24(1), 261-266 (2008)
Studies on binary complexes of
Cu(II)/ UO
2(II)/Ni(II)/ Co(II)/ Zn(II)/ Cd(II)
by paper electrophoresis
PADMAKSHI SINGH and SATYENDRA SINGH
Kashi Naresh Govt. Post Graduate College, Gyanpur, Bhadohi - 221 304 (India)
(Received: February 28, 2008; Accepted: April 09, 2008)
ABSTRACT
Stability constants ML and ML2 type binary complexes of Cu (II)/ UO2(II)/ Ni(II)/ Co(II)/ Zn(II)/ Cd (II), 8-Azaguanine system is determined by paper electrophoresis. The technique is based on the movement of a spot of metal ion under an electric field with the change of pH of back ground electrolyte at ionic strength 0.1 M perchloric acid. The stability constant of the ML and ML2 complexes of metal - 8-Azaguanine have been found to be (7.65, 5.50), (7.38, 5.75), (5.64, 3.82), (5.75, 3.68), (5.33, 4.21) and (4.45, 3.73) for Cu (II)/ UO2(II)/ Ni(II)/ Co(II)/ Zn(II)/ Cd (II) complexes respectively.
Key words : Paper Electrophoresis, Stability constant, mobility.
EXPERIMENTAL Instruments
Systronics paper electrophoresis equipment horizontal cum vertical type No. 604 (India) have been used. The apparatus consisted of a PVC moulded double tank vessel. In our laboratories significant change has been made for controlling the temperature. Two hollow metal plate covered with thin polythene plate have been used. For controlling the temperature, thermo stated water supply has been made through hollow plate. The tank is closed with a transparent PVC moulded lid. The whole assembly is tight which prevent moisture changes, which may upset the equilibrium in the paper.
Each electrolyte vessel containing a separate electrode chamber in which the anode and cathode are placed respectively. The auxiliary unit is a specially designed one, which can be operated upon either voltage mode or on current mode. The voltage can be changed through three ranges viz., 0 - 100, 100 - 200 and 200 - 300 volts.
Filter Paper
Strips of Whatman No. 1 filter paper for chromatography (30 × 1) cm² were used and the potential gradient was 7.7V/cm.
pH - Indicator and Accessories
CP 901 Century digital pH-meter having glass electrode assembly and working on 220 volts/ 50 cycles stabilized A.C. Main was used.
Solution of the complexing reagents
Stock solutions of the complexing reagent viz., 8-Azaguanine, (BDH Anala R grade) were prepared by dissolving accurately weighted amounts in water. Solution of required strengths were then prepared by suitable dilution.
Electro-osmotic indicator
5.0 × 10⁻³M glucose (BDH Anal R) was prepared in water and used as an electro-osmotic indicator for the correction due to electro-osmosis.
Detecting reagent for metal ions
1 - (2-pyridylazo)-2-naphthol (PAN) ; 0.1% (w/v) solution in ethanol for Cu (II), UO2(II), Ni (II), Co (II), Zn (II), and Cadmiun-2B for Cd (II).
Indicator for glucose
A saturated aqueous solution (0.9 ml) of silver nitrate was diluted with acetone to 20ml. Glucose was detected by spraying with this solution, and then with 2% ethanolic hydroxide, when a black spot was formed.
Perchloric acid as background electrolyte A stock solution (5.0M) was prepared by suitable dilution of 70% perchloric acid (SDS Anal R). The solution was standardized by titrating as suitable volume of its dilute solution against a standard sodium hydroxide solution.
Procedure
For recording observation on particular metal ion, five strips are spotted with metal ion solution along with additional one spotted with glucose using 1.0µ pipette and then mounted on the insulated plate. Each of two electrolyte vessel was filled with 150 mL of background electrolyte containing 0.1 M perchloric acid and ligand (1.0 × 10⁻²). The paper was moistened with the background electrolyte and then allow to drain off excess electrolyte. The second insulated plate was placed on paper strips and then thermo stated water supply allowed to supply. The lid was then closed, placed on the electrode vessel and the chamber was made tight. It was left for ten minute and a direct current (200 Volt) was applied for 60 minutes. After electrophoresis, these strips were removed from tank dried. The metal ions and glucose spot were detected by specific reagents. The leading and tailing edge were measured from the marked point and the mean were taken. The distance moved by glucose was taken into account for obtaining the correct path length. Migration towards anode and cathode were designed by -ve and +ve signs respectively.
The observed mobility of migrant was calculated by using the formula :
After applying the correction factor the observed mobility is given as :
Where U = mobility of metal ion/complex ion/ligand, d = distance traveled by metal ion/ complex ion / ligand, dG = distance traveled by glucose spot, X = field strength, t= time for electrophoresis.
Electrophoretic technique used in these studies consists in examining the speed of metal ions in a mixture containing ligand solution under a definite potential gradient in a tube. The speeds are recorded at different pH’s of the mixture solution.
A ligand may be assumed to be poly basic acid dissociating in stages as follows :
The dissociation steps can be illustrated by the following scheme
:-(Charges have been ignored)
The concentration of a protonated species HPL can be expressed as :
...(1)
where αP = K1, K2 ... KP
The poly basic acid thus distributes itself in the form of different anionic species. The following expression holds good for the total concentration.
in the view of this expression equation (1) becomes
A metal ion M from many complex with any deprotonated species of acid and the reaction can be expressed in a general way as (charges being ignored) :
The concentration of a general complex species can be expressed as
-...(2)
where βxp is over all stability constant of the complex and is given by the expression the relative abundance of a particular anionic species
...(3)
of the poly basic acid depends upon the pH of the aliquot. The metal ion in solution form varieties of complexes with these anionic species of the poly basic acid depending upon their stability constants as well as on the availability of the different anionic species. Under the influence of electric field imposed on the ends of electrophoretic tube the complex will move whose speed under the unit potential gradient can be given by the well known equation of Jok4.
.... (4)
where ux.p. is the speed and fx.p. is the mole fraction of the general complex M (HPL)x present in the conglomeration. It may be noted that the general formula (4) clearly takes into account, the stability of each species of complex in view of variability of x and p from zero to any integral number. The more fx.p. intrinsically stands for the actual fraction constituted by the particular complex species in the total agglomeration of all the complexes formed in the poly basic acid present in the solution under the specific conditions of acidity.
This expression in view of equation (2) simplifies to
...(5)
Ux.p. of the individual complexes present in the solution and as well as with their relative abundances. If par tially unprotonated and protonated species are considered, the equation (5) can be expressed as :
....(6)
In this expression β0.0 = 1 in view of the expression (6) u0.0 is the speed of uncomplexed metal ion is u1.0 is that of the complex formed by the combination of one deporotonated anionic ligand with the metal ion and ux.p. is the speed of the metal complex formed by the combination of x anions, containing p protons each. b’s are the overall stability constant of the different metal complexes formed in interact. This equation differs from Jokl in as much as it comprehends different mononuclear complexes formed with a particular liganding anionic species. As the experiments consist in recording the speed of the metal ion with progressive increase of pH due to addition of hydroxyl ion (sodium hydroxide solution) the overall speed would steadily change because of change in relative abundance of a particular species obviously depends upon its overall stability constants as well as the availability of the particular liganding ionic species in the solution which in turn depends on the acidity status of the solution.
Hence a graphical representation correlating overall speed and the pH of the background electrolyte would give a curve wherein a number of plateaus would occur. Each plateau would correspond to a region where a particular metal complex predominates over others. The speed in the region of the plateau will be the speed of the particular metal complex. The stretch of the plateau will be large if the stability constant of the relevant metal complex is large as compared to that to the neighbouring complexes.
The stability constants of different complexes can be calculated with the help of the
equation (4) and its graphical representation of mobility ‘U’ as related to pH value of the background electrolyte. In the beginning stages the hydrogen ion concentration is very high (i.e., low pH value). The overall mobility of metal ion spot could be chiefly due to uncomplexed metal ion. Thus first plateau in the mobility curve would correspond to the region where metal ions in the spot are practically uncomplexed. The constant speed of this plateau is obviously the speed of uncomplexed metal ions i.e., ‘uo,o’. Beyond this region at higher pH the overall speed falls steadily due to steadily increasing complexation of metal ion with increasing concentration of the acid anion. This process of the fall persists till the complexation with the particular liganding ion increases. A stage is reached where almost all metal ions in the spot are complexed with the liganding ion with the result that the overall mobility will tend to become constant. The constancy of overall mobility persists as long as the formation of the complex is overwhelmingly dominant. Obviously constant speed of this plateau will be the speed of the ionic complex formed in this region. It is thus seen that overall mobility of the metal spot varied along a curve beginning with a plateau and then reaching another plateau of constant mobility. IN between these two plateaus the overall mobility of the spot would be contributed mainly by the mobilities of the two species viz. uncomplexed metal ion and first complex of the metal with the particular anion of the ligand.
Assuming HpL anion of the liganding acid to have preferentially formed the complex with the metal ion as :
in the earlier stages the equation (5) simplifies to :
equal to the average mobility of u0.0 and ux.p. (which are actually the mobilities corresponding to the first and second plateaus), when βx.p. [HPL]x is equal to one. The pH value on this condition is find out by taking the mean value and by the knowledge of different dissociation constants of the ligands the concentration of HPL variety can be calculated at this pH with the help of the equation (1). The reciprocal of the concentration gives the overall stability constant βx.p.
On further increasing the pH value of the, solution other anionic species of the ligand are increasingly for med at the cost of the more deprotonated ones. This would lead to the formation of a new complex. Now the absorbance difference which was constant at the second plateau will steadily suffer a transition till a stage is reached where a new complex is overwhelmingly formed. The absorbance difference remains constant as long as the new complex is in dominant majority.
Supposing HqL to be the new anionic species of the ligand to be preferentially generated on the system on increasing its pH from the second plateau onwards, its complexation with the metal ion would be –
The overall average in the region between he second and the third plateaus can be given by the simplified equation :
A number of terms in the numerator and denominator have been deleted because of obvious reason of their contribution. Ux.p. is obviously the mobility of the newly for med complex which corresponds to the third plateau.
Applying the earlier technique the average of the two mobilities Ux.p and Uy.q. would be the overall mobility at a point where
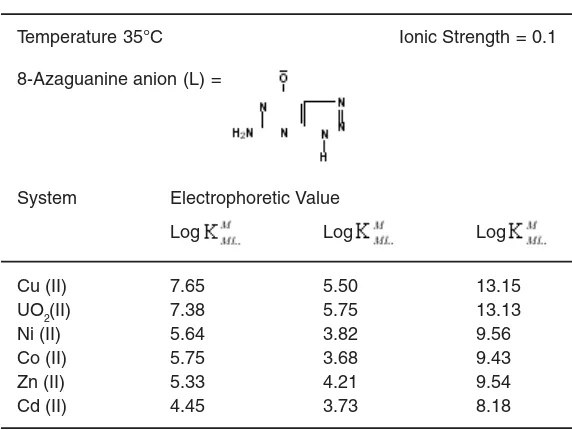
-Table 1: Stability constants of various binary complexing systems involving 8-Azaguanine as Ligand
Temperature 35°C Ionic Strength = 0.1
8-Azaguanine anion (L) =
System Electrophoretic Value
Log Log Log
Cu (II) 7.65 5.50 13.15
UO2(II) 7.38 5.75 13.13
Ni (II) 5.64 3.82 9.56
Co (II) 5.75 3.68 9.43
Zn (II) 5.33 4.21 9.54
Cd (II) 4.45 3.73 8.18
The pH value of the system at this point was found out by taking the mean point of the slope and the concentration of HpL can be calculated from the equation (1). Knowledge of these value and that of bx.p. help in calculating overall stability constant by.q. of the other complex M (HqL)y. By this method we can calculate stability constants of any complex formed subsequently.
The calculated value of stability constants are given in table 1.
In the end, it is to be stressed that paper electrophoresis technique used in these study is simple and handy for the study of complexation reaction. It give vivid picturization of complex formation whose stability constant can be very easily determined.
1. Fruton, J.S. and Simmonds, S., General Bio chem., 2nd Ed. Charles, E. Tutle (Japan), 633-635 (1962).
2. Hobson, G.E. and Rees, K.R., Biochemistry, J. 61: 549 (1955).
3. Fruton, J.S. and Simmonds, S., J. Am. Chem. Soc., 67: 194 (1945).
4. Jokl, V., J. Chromatography, 6: 432 (1964). 5. Yadava, P.C., A.K. Ghose, K.L. Yadava and
A.K. Dey, Chromatographia 9 (1996). 6. Singh, R.K.P., J.K. Sircar, J.R. Yadava and K.L.
Yadava, Elektrochem. Acta 26
7. Singh, R.K.P., P.C. Yadava and K.l. Yadava, Proc. Nat. Aca, Sci. 15 (A) IV: 365 (1981).
8. Singh, S., H.L. Yadava, P.C. Yadava and K.L. Yadava : Rev. De. Chem. Mineral. 121: 141 (1984).
9. Singh S. and Yadav K.L., Z. Phys. Chemie Leipzig 267: 153 (1986).
10. Singh S. and Yadav K.L., Chemica Scripta 26: 363 (1986).
11. Singh S. and Yadav K.L., Electrophoresis 7: 187 (1986).
12. Singh S. and Yadav K.L., Croatica Chemica Acta. 59 (4), 907 (1986).
REFERENCES
13. Singh S. and Yadav K.L., Bull. Soc. Chim. Belgium. 9: 2527 (1992).
14. Tiwari, B.B., Biomed. Chromatograhy 10(5): 221, (1996).
15. Tiwari, B.B., J. Chromatography 910 (1): 181 (2001).
16. Singh, S.S., Singh, V.K. and Singh, S., J. Pur. Aca. Sci. 12: 246 (2006).
17. Singh Satyendra and Yadav K.L., J. Electrochem. Soc. 32-4: 377 (1983). 18. Singh Satyendra and Yadav K.L., Z. Fur. Phy.
Chem. 267(5S): 1008 (1986).
19. Singh Satyendra and Yadav K.L., Electro Chimica, Acta 30(2): 223 (1985).
20. Singh Satyendra and Yadav K.L., Acta Chimica Hugarica 120(i): 47 (1985). 21. Singh Satyendra and Yadav K.L., Z. Phys.
Chemie Leipzig 267: 153 (1986).
22. Singh Satyendra and Yadav K.L., Chemica Scripta 26: 363 (1986).
23. Singh Satyendra and Yadav K.L.,
Electrophoresis. 7: 187 (1986).
24. Singh Satyendra and Yadav K.L., Croatica Chemica Acta 59(4): 907 (1986).