INTERNATIONAL JOURNAL OF PHARMACEUTICAL, CHEMICAL AND BIOLOGICAL SCIENCES
Available online at
www.ijpcbs.com
A NOVEL STUDY OF ELECTRO-REDUCTION OF GOLD CYANIDE
COMPLEX IONS Au(CN)
2
IN WEAK ACIDIC SOLUTION
Nguyen Duy Ket*, Tran Van Chung, Vu Minh Thanh, Ninh Duc Ha and Le Quang Tuan
Institute of Chemistry and material, 17 Hoang Sam street, Hanoi Vietnam.
INTRODUCTION
Gold cyanide complex Au(CN)2- has a high stability that leads its complicated reduction process at cathode surface with many steps. The cyclic Voltammetric method (CV) showed that there were 2 steps in the reduction process, in which one is adsorption process. In 1986, the research of Kurnoskin1 by CV proposed the cyclic curve with maximum at a potencial in the range from -0.5 to -0.9V. In 1996, Z. Chzanowski’s study2 on gold plating under acid condition proposed a more complicated mechanism for the electroreduction of gold cyanide complex as following:
- Adsorption mechanism (polarizing at -0.5V to -0.9V):
Au(CN)2- (AuCN)adsorb + CN -(AuCN)adsorb + e- (AuCN-)adsorb (AuCN-)adsorb +2H+ Au + HCN -Direct discharge (from -1.1V)
Au(CN)2- + e- + 2H + Au + 2HCN
This mechanism was fitted with other studies on gold plating and gold alloy plating5-7 In this paper a mechanism of electroreduction of gold cyanide complex ions was again investigated in detail and finally leading the increased plating rate, obtaining more uniform and brilliant plating layers.
EXPERIMENTAL METHODS
The gold electroplating acidic electrolyte consisting of the oxalate buffer (pH= 4.5) was used for the elctrodeposition of gold and gold alloy with high rate4. The chemical components of the studied electrolyte with different concentrations were prepared from the stock solutions as follows:
Oxalate buffer (pH = 4.5) with total concentration: 60g/L (denoted Ox) KAu(CN)2 solution (pH = 4.5 adjusted by H2C2O4 acid ) : 37.5 g/L
The electroreduction process of cyanide complex ions has been studied by CV measurements, potential linear scanning (LS) and electrochemical impedance spectroscopy (EIS).
Research Article
ABSTRACT
A study on the electro-reduction of gold cyanide complex ions Au(CN)-2 in acidic solution was
presented in detail in this paper. Analyzing capacity of electrical double layer at the different polarized potentials let’s predict more precisely that the adsorbed product on electrode surface was reduced. Using the methods such as electrochemical impedance spectroscopy (EIS), potential linear scanning (LS,) has indicated that the gold cyanide complex ions Au(CN)-2 were
discharged at cathodic electrode through some steps. Indeed the obtained results showed that the gold cyanide complex ions Au(CN)-2 were discharged at the electrode through three steps
accompanying the CN- ion adsorption on cathode surface and that steps were controlled by the charge transfer rate. The presence of formic acid or trace amounts of Pb2+ (ppm) in the working solution might reduce cathodic polarised potencials so results in the improvement for the electroreduction process leading the increased plating rate, giving more uniform and brilliant plating layers.
RESULTS AND DISCUSSION
The electroreduction of gold cyanide complex ions Au(CN)2- under weak acidic medium
The cyclic Voltammtry determination of Au(CN)2
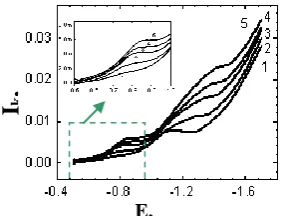
The cyclic Voltammetric curves of Au(CN)2- with the varied concentrations were registered. The cyclic Voltammetric curves of samples containing [Au+] concentration interval (in KAu(CN)2) of 0, 1, 4, 5, 7.5 g/L (denoted Ox, Ox1Au, Ox4Au, Ox5Au, Ox7.5Au respectively) were indicated in Fig.3.1. The obtained experimental data showed that in the potential range (from -1.3V to -1.5V) there was no significant increase in the limiting current density, when the gold cyanide complex concentrations, Au(CN)2- increase. Even in the case, when the concentration of Au(CN)2- was7.5 g/L, the limiting current density decreases. It was discovered that the limiting current densities at the potential of -1.3V were not changed when the Au(CN)2- concentration varied. This current does not depend on the dissociation of the gold cyanide complex ions Au(CN)2-, but might depend on other phenomenon due to the intrusive change of the Au(CN)2- in the samples
In the electrolyte of Au(CN)2- (Au+ = 7.5 g/L) with the different potential scanning rate, beside the peak at the potential range from -1.3V to - 1.5V, when the potential rate increases, there are two peaks sharp else at the potential range between -0.7V to -0.9V, (Fig.2).This might indicate that there are three different electroreduction processes on the cyclic Voltammetric curve. The first peak corresponds to the process:
Au(CN)2- + 1e- ---> Au + 2CN- , E0 = - 0.61V.
This is the direct reduction of Au(CN)2- ions at the electrode. The process producing the second and the third peak will be determined by electrochemical impedance spectroscopy.
Fig. 2: The obtained CV curvse in Au plating solution of 7..5 g/l Au+ (in KAu(CN)2); at pH 4..5,
scannig rate v = 100, 200, 300 and 400 V/s
Fig. 1: Obtained CV curves in Au plating solution of : 0, 1, 4, 5 and 7..5 g/L Au+ ( in KAu(CN)2); at pH 4..5,
scanning rate v = 30mV/s
-0.5
-1.0
-1.5
-2.0
0
-20
-40
-60
-80
-100
-120
I
K(
m
A
/c
m
2
)
E (V/SCE)
Ox Ox1Au Ox4Au Ox5Au Ox7,5Au
I
k,
m
A/c
m
2
Electrochemical impedance spectroscopy and electric capacity
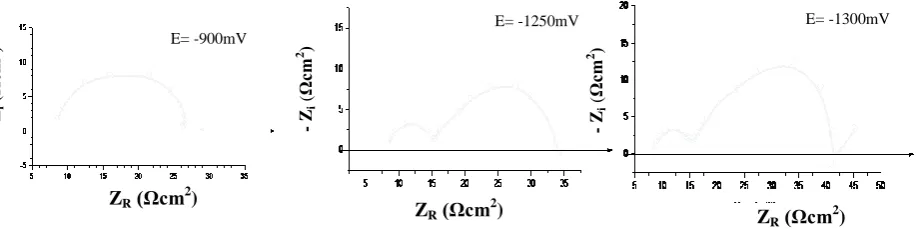
The results of electrochemical impedance spectroscopy of the electrolyte with 4.0g/L Au+, in the potential range from-1.0mV to 1.3mV are presented in (Fig. 3).
At the more positive polarized potentials than -900 mV there is only one arc on the Nyquist electrochemical impedance spectroscopy, but at the potential more negative than -1.3 V, there are the second and third arcs. It showed that reduction of Au(CN)2- consists of many steps that coincided with the results obtained by above cyclic voltammetry.
The double- electric layer capacity depends on the electric transfer resistence (Rct) and frequency corresponding to the maxium imaginary electrochemical impedance, as follows:
Cik= ( 2
fmax.Rct)-1.For every Nyquist curve, the obtained values of electric capacity corresponding to the polarized potential in the electrolyte of 4g/l Au+ are presented in Fig. 4
The curve 1 showed the dependence of electric capacity on polarized potentials. The electric capacity decreases when the polarized potentials moves toward the negative potentials and reaches the minimum value at a potential around – 1.3 V. In the AB interval, with the increase of the polarized potentials, the decrease of electric capacity was obtained due to the positive charged electrode surface and the adsorption of the negative charged ions Au(CN)2-. At interval BC corresponding to the minimum capacity, there is a maximum adsorption of Au(CN)2-. From interval CD the surface electricity becoming more negative has caused the increase of electric capacity to the maximum value due to the desorption of adsorbed Au(CN)2. These phenomena indicated that adsorption of Au(CN)2- is accompanied with the electroreduction of this compound.
On the curve EFG there is a decrease of electric capacity with the minimum value at -1.35V corresponding to the maximum adsorption of AuCN, when the polarized potential increases toward negative values. After this potential value there is the desorption process. The potential corresponding to the maximum adsorption obtained by electrochemical impedance spectroscopy coincided with the second maximum
ZR (Ωcm2)
E= -1250mV
-
Zi
(
Ωc
m
2 )
ZR (Ωcm2)
E= -1300mV
-
Zi
(
Ωc
m
2 )
ZR (Ωcm2)
-
Zi
(
Ωc
m
2 )
E= -900mV
Fig. 3: The obtained Nyquist impedance in Au plating solution of 4 g/L Au+ (in KAu(CN)2) at the depolarized potentials
C
1AuCN
2
- ,
F
C
2
AuCN
2
-,
F
- E, V(CSE)
1 2
D
C
B
A
E
F
G
current at the cyclic curve showed in Fig. 4 might conclude that there was a eletroreduction of adsorbed neutral component AuCN on electrode. In this case the maximum current depends only on the adsorbed AuCN amount and environmental condition such as temperature, stirring rate respectively. The more negative potential accompanying with the desorption of AuCN leads the reduction of Au(CN)2- and H2O, to obtain the limiting diffuse current.
Electroreduction model of Au(CN)
2-From the obtained experimental data an electroreduction model of Au(CN)2- could be proposed.
In the acidic gold plating electrolyte without free CN-, the complex Au(CN)2- are discharged through three steps depending on the potential values.
Step 1. At the potentials more positive than – 0.9V there is an electroreduction of the adsorbed [Au(CN)2]- :
[Au(CN)2-]ad. + e + 2H+ Auo + 2HCN
Step 2. At the potential more negative than -1.0V there is the electroreduction of adsorbed compound [Au(CN)]ad.:
[Au(CN)]ad. +e + H+ Auo + HCN
Step 3. At the potential more negative than -1.35 V, there is the electroreduction of complex [Au(CN)2-] from bulk solution:
[Au(CN)2-.] + e + 2H+ Auo + 2HCN
The influence of formic acid
The influence of formic acid on the reduction of Au+ complex was presented in Fig. 3.5. It showed that when the range of formic acid concentration was from 2 to 8g/L, at more positive potential than -1.3V, the formic acid does not influence on the cathodic reduction of Au+ complex, but after -1.3 V, it might cause the reduction rate increased. When the acid concentration being 20g/L causes the reduction rat increased in whole polarized potential range.
Due to the standard redox potential of HCOO/CH2O = -1.14 V, at the potential more positive than -1.3 V, there is no reduction of this acid. The presence of formic acid in this case increases the reduction rate of Au+ due to the decrease of adsorbed gold complex. The role of HCOOH in Au+ reduction process depends on the its concentration and the polarized potential. When the potential more negative than -1.3 V with the reduction of HCOOH, there are increases the reduction rate and the limiting current respectively. By the CV method, in buffer electrolyte with HCOOH the reduction of HCOOH causing an increase in limiting current was discovered (Fig. 6).
1 16/02/04
2 3
4 5 6
-2.250 -1.688
-1.125 -0.563
0 -0.1000
-0.0650
-0.0300
0.0050
E (V/SCE)
J
(A
)
Fig. 5: The obtained CV curve in solution of:2,4,8,10 and 40 g/L HCOOH, pH = 45 scan rate v = 30mV/s
Fig. 6: The obtained CV curve in Au plating
solution of 7..5 g/L Au+containing HCOOH
at pH 4.5, scan rate v = 30 mV/s
ED Origin50.Graph
|
-0.6 -0.8 -1.0 -1.2 -1.4 -1.6 0
-20 -40 -60 -80 -100 -120 -140
Ik
(
m
A
/c
m
2)
E (V/SCE)
0 g/lHCOOH 2 g/lHCOOH 4 g/lHCOOH 8 g/lHCOOH 40 g/lHCOOH
Both cases showed that the reduction of HCOOH was carried out at the potential more negative than – 1.2 V. At more positive potential than -1.2 V the presence of HCOOH improved the plating surface layer quality.
The influence of Pb2+ ions
The reduction of Pb2+ ions in weak acid medium
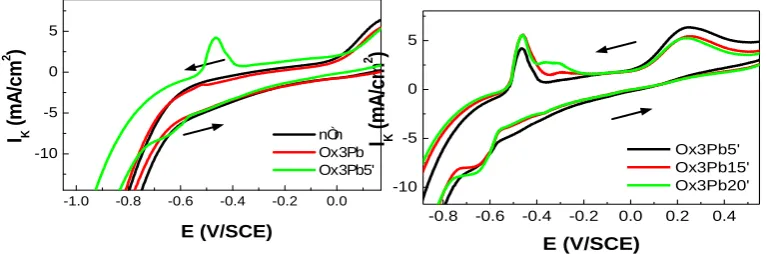
The CV character of the electrolyte H2C2O4, pH = 4.5, containing Pb2+ (3ppm), polarized potential from -1.0 V to 0.1V with the potential scanning rate of 100mV/s was presented in Fig. 7. In the lead - free electrolyte there is only the reduction of H+ and oxidation of OH-. In the presence of Pb2+,there is a small peak on the CV curve at -0.52 V, corresponding to the dissolution of Pb0. After plating at -1.0V with implemented anodic polarization different time of 5,15, 20 minutes, The obtained CV results are presented in Fig. 8. The curves showed that with 5- minute- plating, on the CV curve there are two peaks at the potential -0.65 V and -0.45 V corresponding to the reduction Pb 2+ ions and oxidation of deposited fresh lead layer respectively. In this condition, in the absence of prior cathodic polarization, at the CV curve we have obtained two peaks, in which the anodic peak more higher than cathodic one. With the cathodic polarizing time increasing from 5 minutes to 20 minutes the anodic peak height corresponding to the dissolution of deposited lead metal on electrode increases.
Normally the lead metal is difficult to dissolve by electrolysis and it was used to make noble electrode, so the lead dissolving limiting current increased in this case showed that fresh deposited lead atoms at the gold electrode exhibited a high active behavior and would influence on the gold electreodeposition.
The influence of Pb2+ addition on gold electrodeposition
The presence of Pb2+ addition even in ppm concentration would influence on the gold plating. The obtained results of the potential - current relationship are illustrated in Fig. 9. Pb2+ ions made a decrease in cathodic polarization of gold plating. In the Pb2+ concentrations from 0.5ppm to 4ppm, first the depolarization increases then decreases and appears one maximum value corresponding to the lead concentration of 2ppm (Fig. 10).
In the presence of Pb2+, the nonlinear change of polarization potential is caused by the adsorption of lead ions on electrode surface. The maximum limiting current of gold reduction was obtained when the Pb2+ adsorption is mono layer. The increase of the adsorption layer thickness causes the decrease in the depolarization.
-0.8 -0.6 -0.4 -0.2 0.0 0.2 0.4
-10 -5 0 5
I
K(
m
A
/c
m
2)
E (V/SCE) Ox3Pb5' Ox3Pb15' Ox3Pb20'Fig. 8: The obtained CV curve in solution of 3 g/L Pb2+, pH 4..5. after plating
15 and 20 minutes scanning rate v = 100mV/s
-1.0 -0.8 -0.6 -0.4 -0.2 0.0 -10 -5 0 5 I K ( m A /c m 2 ) E (V/SCE) nÒn Ox3Pb Ox3Pb5'
Fig. 7: The obtained CV curve in solution of: 0, 3 g/L Pb2+, pH 4..5 and after
plating 5minut, scanning rate v = 100mV/s
Fig. 9 : LS curve obtained in solutionAu plating contain Pb2+, pH = 4..5scan rate v = 50mV/s
Ik ( m A /c m 2 2 3 4 5
0 1 2 3 4
Fig. 10: The depedence of Dk on
concentration of Pb2+ in
[Pb2+], (ppm)
355
The freshly formed lead metal on the cathode surface would take part in oxido-reduction reaction with Au+ ions to leave Pb2+ ions. This process can be illustrated as follows :
Pb2+bulk sol Pb2+ads (1)
Pb2+ads +2e Pb (2) Pb + Au+ Pb2+ads + Au (3)
The Pb2+ ions concentration in the bulk and absorbed at electrode from reaction (3) exhibited the high electrochemical behavior that increase the reaction rate (reaction (2)). In this condition the Pb2+ ions play a role of catalyst for the reduction of AuCN2- complex. The rate of chemical oxidation of lead metal by Au+ to form Au is fast, to form uniform gold crystal centers at cathodic surface so that improve the higher quality of gold plating layer than in the case of absence of Pb2+.
CONCLUSIONS
The gold electroreduction in the weak acidic electrolyte consists of three steps accompanying with the adsorption, depending on the electrode potentials.
The presence of formic acid causes a decrease in depolarization and to produce the gold uniform fine surface.
In the gold plating process, absorbed Pb2+ ions improved the gold electrodeposition to form more easily the metallic lead layer at electrode to take part in oxido-reduction reaction with Au+ and generated Pb2+ ions. These ions play a role of catalyst.
The obtained data showed that: formic acid and lead salt can be used for the gold electrodeposition to increase the deposition rate and to improve the quality of plating layer.
ACKNOWLEDGEMENTS
The authors gratefully acknowledge the financial support from the National Foundation for Science and Technology Development (NAFOSTED) in topic number 104.05-2012.32.
REFERENCES
1. Z. Chzanowski, Y. G. Li and A. Lasia 1996, J. of applied Electrochemistry, 26, 385. 2. E. T. Eisenmann 1978, J. Electrochem. Soc., 125, 5, 717
3. Р. Ю. Бек, А. Г. Зелинский, С. Н. Овчиннисова, А. А. Вайс, 2004: Эектрохимия, 40, 2, 143. 4. United States Paten: 5,169,414, Dec. 1992 and 4, 615,774, Oct. 1986.
5. Epelboin I., Wiart R., 1971 J. Electrochem. Soc., 118, 10, 1557 6. Han Keping and Fang Jingli, 1997 : Trans IMF ,74 95 74 (3).