Published online February 13, 2015 (http://www.sciencepublishinggroup.com/j/earth) doi: 10.11648/j.earth.20150401.15
ISSN: 2328-5974 (Print); ISSN: 2328-5982 (Online)
The Neotectonic Activity Along the Lower Khazir River by
Using SRTM Image and Geomorphic Indices
Ziyad Elias
Geomorphic Research / Salahaddin University, Erbil City
Email address:
To cite this article:
Ziyad Elias. The Neotectonic Activity Along the Lower Khazir River by Using SRTM Image and Geomorphic Indices. Earth Sciences. Vol. 1, No. 1, 2015, pp. 50-58. doi: 10.11648/j.earth.20150401.15
Abstract:
Lower Khazir River is crossing three mountains (Maqlub , Ain Al-Safra, and Makhmoore) and it is adjustment to the neotectonic activity by fold. During the study evaluate active tectonics by using DEM derived drainage network and geomorphic indices stream-length gradient (SL), basin asymmetry factor (AF), hypsometric integral (HI), valley floor width to valley height ratio (Vf), Basin shape (Bs) and mountain front sinuosity (Smf). Geomorphic indices are calculate (IRAT) in the study site. So I classified the IRAT index into very higher, higher, modern and lower active of tectonic. The value of very higher is in sub basin 1 and 18 , higher is in sub basin 6, 10, 14 and 17 , modern is in sub basin 2,3,4, 5 ,7 , 9 ,16 and 19; and lower is in sub basin 8,11,12,13 and 15. About 10.5% of the study area (about 29.87) km2): 21% (111.63 km2) to Class 2: 42% (312.59 km2) to Class 3 and 26.5% (133.75 km2) to Class 4. IRAT tends to be high along the fold and fault zone. Two different levels of the rock are found in the study site (middle hard and soft rock).Keywords: Geomorphic Indices, SRTM, Neotectonic Activity, Lower Khazir River
1. Introduction
Drainage systems adapt to changes in the surface slope, recording fold growth and evolution (Jackson et al. 1996).The stream network is a good substitute indicator of the landform organisation and the density of the lowest order streams clearly delimits the landforms (Cudennec and Fouad, 2006).
In this paper, the geomorphological indices of the nineteen sub basins to investigate the distribution neotectonic active in the Simply Folded Belt. Study area lies in the Lower folded zone in the Iraqi Kurdistan (Fig. 1, a).
2. Data Set
DEM data and a digital drainage network generated using River Tools (Rivix LLC.). Geomorphic indices were measured from the contour maps (DEM) using ARC GIS software. I analyzed nineteen sub-basins (Fig. 1B) using six geomorphic indices: stream-length gradient (SL), hypsometric integral (HI), basin asymmetry factor (AF), valley floor width to valley height ratio (Vf ) , Basin shape (Bs) and mountain front sinuosity (Smf).
3. Setting
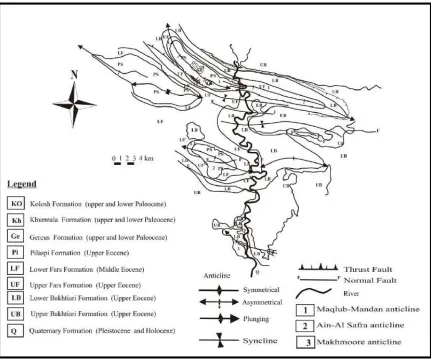
Study area lies in the Lower folded zone in the Iraqi Kurdistan (Fig. 1, A). Geology formations in the study area are Khurmala, Gercus, Pilaspi, lower, upper Fares, lower, upper Bakhtairy and Quaternary (Fig.2). Khurmala, Gercus, and Pilaspi formations are medium hard rocks while lower, upper Fares, lower, upper Bakhtairy and Quaternary are soft rocks
Lower Khazir river is crossing structural geology of the Maqlub- Mandan, Ain Al-Safra and Makhmoore anticlines. Changes in the river channel are evidenced by the braided throw of low to high sinuosity. The gradient of channel deformation corresponds to the valley slope and power of the flow. This channel is narrow as anomalous meandering reaches upstream in the Maqlub, this is the case of the fold and thrust fault activity within the channel. The channel widens abruptly in the trace of the Ain Al -Safra anticline being impact. Morphology of the stream is straighter with narrow channel in the Makmoore anticline - the stream meanders both in the Maqlub and Ain Al - Safra anticlines (Fig.2).
caused by the growth of anticlines. Tectonic uplift and anticline movements play a vital role in the lower section of the Khazir River. These movements are clearly visible in the morphology of the bed of the valley as they induce river
meandering. Anticline growth influences changes in the river bed course and sinuosity. Faults also play a role on the nose of the anticline and become observable in the whole morphology of the river.
Fig 1.... (a) location of the study in tectonic sub division of Iraqi Kurdistan (by Numan 1997), (b) study area sub division into nineteen sub basins
4. Geomorphic Indices
The geomorphic indices are either based on analysis of the drainage network or mountain fronts. These indices may detect anomalies in the drainage system or along mountain fronts (El Hamdouni et al., 2008). These anomalies are possibly due to local changes from tectonic activity resulting from uplift or subsidence. So assessment of the neotectonic activity by using geomorphic indices is helpful tools. These indices are descripting below.
4.1. Stream-Gradient Index (SL)
The SL index was defined by Hack (1973) to discuss influences of environmental variables on longitudinal stream profiles and to test whether streams have reached equilibrium or not, mathematically SL is given by,
SL = (∆H /∆L)* L
SL denotes the Stream Length Gradient Index, ∆H /∆L denotes the channel slope or gradient of the reach (∆H is the change in elevation of the reach and ∆L is the length of the reach), and L denotes the total channel length from the point of interest.
The topographic evolution results from an adjustment between the erosional processes as streams and rivers flow over rocks and soils of variable strength (Hack, 1973). This adjustment eventually reaches a dynamic equilibrium and river systems display slightly concave longitudinal profiles (Schumm et al., 2000). The SL index can be used to evaluate relative tectonic activity (Keller and Pinter, 2002). Although an area on soft rocks with high SL values indicates recent tectonic activity, anomalously low values of SL may also represent such activity when rivers and streams flow through strike-slip faults (Keller and Pinter, 2002, Mahmood, and Gloaguen 2012).
Fig. 3. Classified the volume of SL
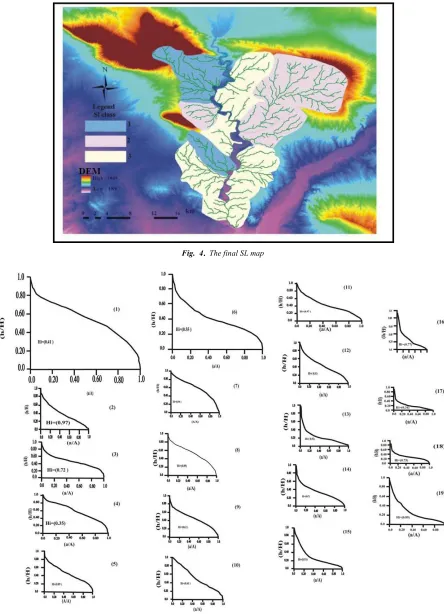
The values were classified into three classes: class 1 (>600), class 2 (300≤ Sl <600) and class 3 (SL <300) according to El Hamdouni et al. (2008) (Fig. 3). The result of the classification is shown in Fig 4 and Table 1. The lithology is playing roller on the SL index.
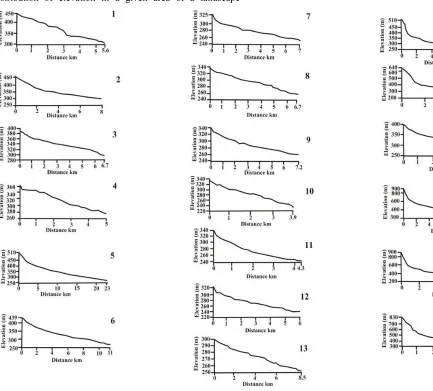
Longitudinal profiles of the nineteenth sub basins are illustrated in Figure 5. Curve of profile is shown total length and elevation of the all sub basins from the spring to the mouth.
4.2. Asymmetric Factor (Af)
The Asymmetry Factor is defined as Af =100*(Ar/A)
Where : -
on a tilted side of the main stream grow. The latter is not the case for those located on the other side (Pinter 1996, Keller,Pinter, 1996, 2002)
The values are classified in to three classes: 1 is (<35 Af ) ;
classes 2: (>35Af < 45 ) ; classes 3: (> 45).(Fig.6) This classification of the Af is close to the (El Hamdouni et al., 2008).
Fig. 4.... The final SL map
Fig. 6. The final Af map
4.3. Hypsometric Integral (Hi)
The hypsometric integral (Hi) describes the relative distribution of elevation in a given area of a landscape
particularly a drainage basin (Strahler, 1952). The index is defined as the relative area below the hypsometric curve and thus expresses the volume of a basin that has not been eroded.
A simple equation to approximately calculate the index (Pike, Wilson, 1971; Mayer, 1990; Keller, Pinter, 2002) is:
Hi = (average elevation-min.elev.) / (max.elev-min.elev.)
This index is similar to the SL index in that rock strength as well as other factors affects the value. High values of HI generally are mean that not as much of the uplands have been eroded, and may propose a younger landscape.
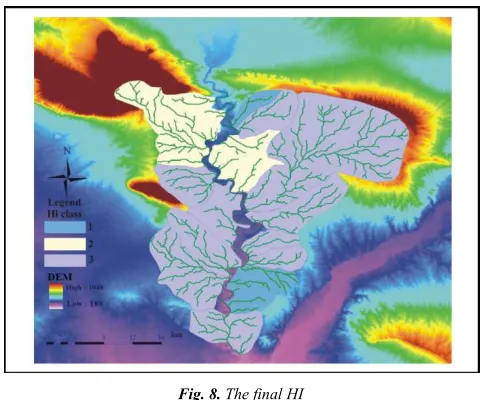
I computed HI for each sub-basin. It ranges from 0.34 (sub-basins 17) to 0.97 (sub-basins 2, 11 and 14) figure 7. Then HI values were grouped into three classes with respect to the convexity or concavity of the curve: class 1 with convex hypsometric curves (0.51-0.78); class 2 with concave-convex hypsometric curves (0.37-0.50) and class 3 with concave hypsometric curves (<0.37) as shown in Fig.8 and Table1.
Fig. 8. The final HI
4.4.Ratio of Valley Floor Width to Valley Height (Vf)
They can be differentiated by index of ratio of valley floor width to valley depth (Vf). This parameter is calculated as:
Vf = 2Vfw / [(E ld − E sc) + (E rd − E sc)]
Where: Vf denotes the valley floor width to valley height ratio, Vfw denotes the width of the valley floor, E ld and E rd stand for elevations of the left and right valley divides, respectively, and E sc denotes the elevation of the valley flower. Because uplift is associated with incision, the index is thought to be a proxy for active tectonics where low values of Vf are associated with higher rates of uplift and incision. Deep V-shaped valleys (Vf < 1) are connected with linear, active down cutting streams distinctive of areas subjected to active uplift, while flat floored ( U- shaped) valleys (Vf > 1) show an attainment of the base level of erosion mainly in response to relative tectonic quiescence (e.g., Keller and Pinter, 2002; Keller, 1986).
Because uplift is associated with incision, the index is thought to be a proxy for active tectonics where low values of Vf are associated with higher rates of uplift and incision. Deep V-shaped valleys (Vf < 1) are connected with linear, active down cutting streams distinctive of areas subjected to active uplift, while flat floored ( U- shaped) valleys (Vf > 1) show an attainment of the base level of erosion mainly in response to relative tectonic quiescence (e.g., Keller and Pinter, 2002; Keller, 1986). The Vf was calculated for the main valleys that cross mountain fronts of the study area using cross section drawn from the DEM. Then Vf was classified into three classes: class 1 (vf ≤ 6); class 2 (6 ≤ vf < 12) and class 3 (Vf ≥12) as shown in Fig 9. and Table 1. The range of Vf is from 0.02 (subbasin2) to 3.25 (sub-basin 33).
The Vf was calculated for the main valleys that cross mountain fronts of the study area using cross section drawn from the DEM. Then Vf was classified into three classes: class 1 (vf ≤ 6); class 2 (6 ≤ vf < 12) and class 3 (Vf ≥12) as shown in Fig 9. and Table 1. The range of Vf is from 0.02
(subbasin2) to 3.25 (sub-basin 33). Vf is relatively low for V-shape valleys but high for U-V-shape valleys. According to the Vf values, most valleys in the study area are V-shaped.
Fig. 9. The Final Vf map
4.5. Basin Shape Index
This index is identified as : Bl /Bw Bs =
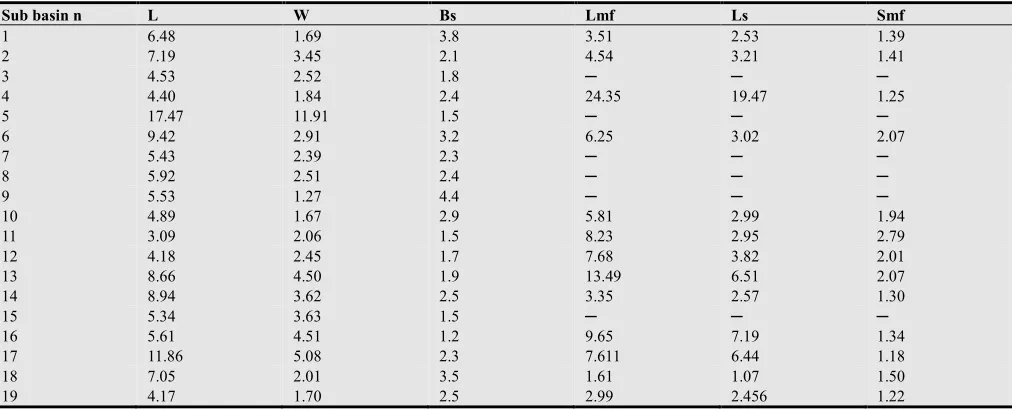
Bl is the length of a basin measured from the headwaters point to the mouth of the sub basin, and Bw is the width of sub basin measured at its widest point. High values of Bs are associated with elongated basins, generally associated with relatively higher tectonic activity. Low values of Bs indicate a more circular-shaped basin, generally associated with low tectonic activity. Therefore, Bs may reflect the rate of active tectonics. Bs was computed using the DEM and classified into three classes: class 1 (2.93-4.37); class 2 (2.47-1.80) and class 3 (1.70-1.24) table 2 and Fig.10.
Fig. 10. Final Basin shape
4.6. Mountain-Front Sinuosity Index (J)
denotes the length of the mountain front along the foot of the mountain at the pronounced break in slope: and L s denotes the straight-line length of the mountain front. Mountain front sinuosity is an index that reflects the balance between erosion forces that tend to cut embayment into a mountain front and tectonic forces that tend to produce a straight maintain front coincident with an active range- bounding fault (Verrios et. al., 2004). The sinuosity of highly active mountain fronts generally ranges from 1.0 to 1.5, that of moderately active fronts ranges from 1.5 to 3, and that of inactive fronts ranges from 3 to more than 10 table 2 and Fig.11.
Fig. 11. Final mountain front sinuosity
5. Index Relative Active Tectonic (IRAT)
The average of the six numbers of the geomorphic indices was used to calculate the index of relative active tectonic in the study area. The values of the (IRAT) were classified into four classes to defined the degree of the relative active on the nineteen sub basins. Classes 1: 6.1 ≥ very high, classes 2: (1.6 ≤INTR<2.0) high , Classes 3:2.0≤INTR <2.5 ( modern) and class 4: 2.5 ≤INTR (Low) ( El Hamdoni et ,al 2008). The result of IRAT is shown in table 1 and Figure 12, so the nineteen sub basins are divided between very high to low values of the relative active. Different values of active tectonic may be case to Lithology of rock.
Fig. 12. Index of relative active tectonic (IRAT )
6. Result
Analyzed geomorphic indices are amassment for the neotctonic activity in the study area. In order different values as the indices related to the lithology of the rock (resistance).So two different levels of the rock are found in the study site ( middle hard and soft rock) values of Geomorphic index. Fault along the mountains also display in the values of the geomorphic indices. Very high and higher values of the 11 sub basins (table 1) are located along the fold and faults in the study area.
Regarding the order analyzing parameters for the sub basins in the study site structural control plays a significant in the development of basin asymmetry (El Hamdouni et al., 2008), the highest values of Af that demonstrate the most prominent asymmetry occur in the fault zones ; examples are Sub basins 2, 6, ,14 and 16. The sub basins with the highest values of Hi also occur along these fault zones. Distribution of Vf indicates that rivers are deeply incised into the ground where they flow over an active and the most elongated sub basins with the highest values of Bs occur along the fold and fault zone. J values reflect the existence of straight mountain fronts in the study area and thus active tectonics. Three of them (Fronts 1, 2, 4, and 6) have been truncated.
Relative active tectonic (IRAT) is classified into four classes. About 10.5% of the study area (about 29.87) km2 to class 1: 221% (111.63 km2) to Class 2: 42% (312.59 km2) to Class 3 and 26.5% (133.75 km2) to Class 4. IRAT tends to be high along the fold and fault zone.
Table 1. Geomorphic indices of the Nineteen sub basins
Basin no area km Class of SL Class of AF Class of Hi Class of Vf Class of Bs Class of J Value of Lat Class of lat
1 15.11 3 3 1 1 1 1 1.6 1
2 25.37 3 1 3 3 2 1 2.1 3
3 20.32 3 3 2 2 2 ─ 2.4 3
4 11.85 3 2 2 3 2 1 2.1 3
5 184.69 2 2 3 2 3 ─ 2.4 3
6 22.45 2 1 3 3 1 1 1.8 2
7 20.48 3 3 3 1 2 ─ 2.4 3
Basin no area km Class of SL Class of AF Class of Hi Class of Vf Class of Bs Class of J Value of Lat Class of lat
9 16.89 3 3 1 3 1 ─ 2.2 3
10 9.97 3 1 1 2 1 3 1.8 2
11 6.91 3 1 3 3 3 3 2.6 4
12 22.75 3 3 3 2 3 3 2.8 4
13 59.68 3 3 3 3 2 ─ 2.8 4
14 30.64 1 1 3 1 3 ─ 1.8 2
15 13.55 3 2 3 2 3 ─ 2.6 4
16 37.44 2 1 3 2 3 2 2.1 3
17 36.71 1 2 2 2 2 2 1.8 2
18 14.76 1 1 2 1 1 3 1.5 1
19 12.44 1 3 2 2 3 3 2.3 3
Table 2. Basin shape and Mountain front sinuosity values
Sub basin n L W Bs Lmf Ls Smf
1 6.48 1.69 3.8 3.51 2.53 1.39
2 7.19 3.45 2.1 4.54 3.21 1.41
3 4.53 2.52 1.8 ─ ─ ─
4 4.40 1.84 2.4 24.35 19.47 1.25
5 17.47 11.91 1.5 ─ ─ ─
6 9.42 2.91 3.2 6.25 3.02 2.07
7 5.43 2.39 2.3 ─ ─ ─
8 5.92 2.51 2.4 ─ ─ ─
9 5.53 1.27 4.4 ─ ─ ─
10 4.89 1.67 2.9 5.81 2.99 1.94
11 3.09 2.06 1.5 8.23 2.95 2.79
12 4.18 2.45 1.7 7.68 3.82 2.01
13 8.66 4.50 1.9 13.49 6.51 2.07
14 8.94 3.62 2.5 3.35 2.57 1.30
15 5.34 3.63 1.5 ─ ─ ─
16 5.61 4.51 1.2 9.65 7.19 1.34
17 11.86 5.08 2.3 7.611 6.44 1.18
18 7.05 2.01 3.5 1.61 1.07 1.50
19 4.17 1.70 2.5 2.99 2.456 1.22
7. Conclusion
Geomorphic indices divided sub basin into nineteen sub basins to determined index of active tectonic. Geomorphic indices and SRTM are useful tools for assessment the neotectonic in the lower Khazir river. Lithology of rock and fault are play roller in the active tectonic.
8. Software
The digital drainage network generated using (Rivix LLC.). Geomorphic indices were measured from the contour maps. The final map outline was drawn in Arc Gis.
References
[1] M. A., 1980, Geology of Shaikhan Area. M. Sc. Thesis, University of Mosul.187
[2] Al-Daghistany, H. S.Y. and Salih, M. R., (1993) Adjustment of the Khazir River to the style of structural Deformation. Using Remote Sensing data, Iraq Geological Journal 25, 1, 65-79.
[3] Alipoor, R., Poorkermani, M., Zare, M., and El Hamdouni, R., (2011) Active tectonic assessment around Rudbar Lorestan dam site, High Zagros Belt (SW of Iran), Geomorphology
journal 128, 1-14.P.P.
[4] Arian M., Pourkermani M. (2001) River morphology and active techtonic (Reviewing the current status of Ghezel Ozon River in the province of Zanjan). Fifth annual conference of Geological Society of Iran, National Iranian Oil Company and Shahid Beheshti University.
[5] Bull W B,and McFadden L. (1977) Tectonic geomorphology north and south of the Garlock Fault, California, Geomorphology in Arid regions, D. O. Doehring, ed., Publications in Geomorphology, State University of New York at Bingamton, 115 – 138.P.P.
[6] Bazhenov M L, Lauer J P, and Biju-DuvalB. (1986) Geological evolution of the Tethys belt from the Atlantic to the Pamirs since the Lias. Tectonophysics 123, 241–315.P.P. [7] Cudennec, C. and Fouad, Y. (2006) Structural patterns in river
network organization at both infra- and supra-basin levels: The case of a granitic relief. Earth Surface Processes and Landforms, 31, 369-381.P.P.
[8] Cuong, N Q, and Zuchiewicz W A. (2001) Morphotectonic properties of the Lo River Fault near Tam Dao in North Vietnam, NaturalHazards and Earth System Sciences 1, 15- 22.P.P.
[10] Hack J T. (1973) Stream-profiles analysis and stream-gradient index. Journal of Research of the U.S. Geological Survey 1, 421-429.P.P.
[11] Jackson, J., R. & Youngson, J., (1996) The structural evolution of active fault and fold systems in central Otago, New Zealand: Evidence revealed by drainage patterns. Journal of Structural Geology, 18, 217-234.P.P.
[12] Keller E, Pinter N., (1996) Active Tectonics, Earthquakes, Uplift and Landscape, Earth Sciences Series, Prentice – Hall, Englewood, 171-173.P.P.
[13] Keller E A, Pinter N., (2002) Active Tectonics: Earthquakes, Uplift, and Landscape, Prentice Hall, Upper Saddle River, New Jersey, 359.P.
[14] Mahmood, S.A., and Gloaguen, R., (2012) Appraisal of active tectonics in Hindu Kush: Insights from DEM derived geomorphic indices and drainage analysis, Geoscience Frontiers 3 (4) 407-428.P.P.
[15] Mayer, L., (1990) Introduction to quantitative geomorphology, Prentice Hall, Englewood, Cliffs, NJ.
[16] Numan, N.M.S. and Bakose, J.Y., (1985) Remote Sensing Data Versus the Geological Ground Truth in Ba'shiqa-Maqlub area Nineveh District, Jour. of Space and Astronamy Research, Vol. 2, pp. 65-84
[17] Numan N. M. S., (1997) A plate tectonic scenario for the Phanerozoic succession in Iraq.- Journal of Geol. Soc. Iraq , 30 (2) , 85- 110.Vol. 2 Issue 11, November-2013,: 22-34.P.P. [18] Strahler, A. N., (1952) Hypsometry (area- altitude) analysis of
erosional topography, Geological Society of American Bulletin, 63, 1117-1142.P.P.