Operational Research: Application of the
Arena Software for the Optimization of the
Inox Tower Manufacturing Process
Raquel Silva Reis¹, Tiago Bittencourt Nazaré², Douglas Barbosa³
¹Student of Industrial Engineering, Faculdades Integradas de Cataguases - FIC/UNIS ²Master in Engineering systems management, Universidade Católica de Petrópolis - UCP ³Specialist in Strategic Business Management, Faculdades Integradas de Cataguases - FIC/UNIS
Cataguases/MG, Brazil
Abstract
This study aims to use the operational research techniques to seek improvements in the performance of the production of stainless-steel towers for bodyguards in a Brazilian microenterprise in the state of Minas Gerais. The data obtained through the process mapping and the chronoanalysis were treated through the statistical control of the process and later in the Arena Student software 14 for the simulation of the current and proposed scenarios. During the study, it was found that many interruptions occurred during the production process, mainly caused by the lack of site organization, materials and tools, and machine setup. With this, the alternative presented for the optimization of process time was the application of the FacPlan method and the restructuring of tools. The results of the simulation of the proposed scenario showed a reduction of 13 minutes in each batch of towers, increasing the productive capacity of the company to 163 towers/month.
Keywords: Operational Research, Simulation, Arena.
I. INTRODUCTION
Today, the increasing market competitiveness has required companies to strive to optimize and improve the performance of their processes. Some factors, such as making proper use of available resources, maintaining organization and process standardization, contribute to this improvement by increasing productivity, quality, and therefore profit.
One of the great difficulties faced by micro and small Brazilian companies is related to the lack of knowledge of their production processes, because many do not have techniques that allow a more factual view of them. According to [1], these companies are of great importance to Brazil, accounting for 27% of GDP, a result that has been growing in recent years.
Therefore, this study is relevant because it deals with the operational research to understand and improve the productive processes of stainless-steel towers for a bodyguards in a Brazilian microenterprise located in the state of Minas Gerais,
providing growth for the same and, consequently, for the country's economy.
The objective of the study is to evaluate the process of production of the towers and to find alternatives to improve the performance and obtain greater control of the internal processes through the operational research. The specific objectives are: to use the mapping of processes to know the production flow and to understand the processes; through the chronoanalysis record the duration of each process; verify the variability of each one through the statistical process control tool; and use the Arena Student software to simulate the company's current scenario and scenario suggested.
II. LITERATUREREVISION
A. Operational Research
As the name itself denotes, the operational research is the investigation of operations. “The operational research procedures in an organization encompass, interconnect and benefit all levels, that is, they help decisions at the strategic, tactical and operational levels” [2].
According to [3], through the use of mathematical modeling techniques and efficient computational algorithms, the operational research can assist the decision maker in the analysis of the most varied aspects and situations of a complex problem, allowing the effective decision making and the construction of systems.
Reference [4] affirm that, although its application is more common in the operational areas, the use of operational research is real in the most diverse scenarios, which demonstrates the flexibility of the technique, adaptable to any type of situation, provided there are numerical data on the process.
1) Simulation using Arena software: One of the most used techniques in operational research is simulation.
the solution of costly and complex problems, difficult to solve by means of experiments or analytical methods [5].
Reference [6] point out that this technique involves the use of a computer to mimic the performance of an entire process or system, and that because of its speed, the computer can simulate even years of operation in one matter of seconds. Thus, by recording the performance of the simulated system operation for various alternative design or operating procedures, it is possible to evaluate and compare the alternatives before choosing one. “Through the simulation technique, it is also possible to construct theories and hypotheses, considering observations generated through computational models” [7].
The Arena was developed by Rockwell
Automation. “It is a simulation software integrated with a graphical environment. It has resources for modeling, drawing, animation, statistical analysis and analysis of the results of processes in general” [8]. According to [9], in this software it is not necessary to write any line of code, because the whole process of creating the simulation model is graphic and visual, and in an integrated way.
The Arena “was designed to simulate event-driven systems and in particular to analyze the impacts of introducing changes to the real system” [10]. According to [11], it was considered by renowned simulation experts as the most innovative simulation software because it combined the capabilities of a simulation language with the ease of use of a simulator in an integrated graphical environment.
B. Process Mapping and Optimization
Reference [12] says that the process mapping aims to facilitate understanding, communication at all levels of the organization and allow the analysis of the points to be improved. According to [13], if mapping is performed correctly, opportunities for improvement will become more visible to the company because processes will be easier to understand and better to analyze.
According to [14], process optimization is a set of methods that aims to identify among a set of alternatives, the best solution for a given problem, without necessarily explicitly evaluating all possible alternatives.
C. Statistical Process Control (SPC)
Reference [15] states that the variability is present in all processes of production of goods and services and is usually the result of changes in the conditions under which observations are made. These changes may reflect differences between the raw materials, the conditions of the equipment, the working methods, the environmental conditions and the operators involved in the processes considered.
According to [16] the statistical process control is a powerful tool for finding the stability of a process and for improving capacity by reducing variability.
One of the tools of statistical process control is the control chart, “used to analyze trends and patterns that take place over time. Its main purpose is to monitor a process, verifying if it is under statistical control indicating its range of variation” [17].
Reference [16] argue that even in a well-designed and carefully maintained production process, there is some inherent or natural variability, called “background noise.” According to the authors, when this noise is relatively small, the system is operating only on a casual (common) cause, the process is at an acceptable level of performance, and is said to be under statistical control. Otherwise, the level of performance is unacceptable, the process is operating in the presence of assigned (or special) causes and is out of statistical control.
According to [16], the control plot is formed by a center line (LC) representing the mean value of the quality characteristic corresponding to the state under control, and two horizontal lines called upper control limit (UCL) and lower control limit (LCL). These limits are chosen so that if the process is under control, approximately all points in the sample will fall between them.
The authors also state that a common choice of control limits is the 3σ (3-sigma) “distance” from the center line, and the graphs developed according to these principles are known as Shewhart control charts. “It is often advantageous to construct the graph along with the 2σ limits, which are called alert limits. The limits 1σ can also be inserted, forming three regions in the control chart that help detect some patterns” [18].
For [19] it is important to note that control limits can not be confused with design specifications or tolerances. These limits only reflect the random variations of the process imposed by the so-called common causes of variation, whereas the specifications or tolerances refer to deterministic calculations of design.
III. METHODOLOGY
The present work is a case study. For the elaboration of the same, visits were made to the place and from there it was possible to analyze and describe the manufacturing processes, characterizing it as a descriptive study.
A. The company
The company is Brazilian and is located in Zona da Mata Mineira and operates in the production and installation of stainless-steel products, such as handrails, guard rails, stairs, among others. It is classified as a microenterprise by Brazilian Complementary Law No. 123 [20], which states that in each calendar year, gross revenue of the same shall be equal to or less than R $ 360,000.00. The company was created in 2012 and currently has 4 employees, working 8 hours a day, 20 days a month.
1. Applicability of Stainless-steel Towers
Stainless-steel towers are used on glass guard rails. The guard rails is defined by the norm NBR 14718: 2008 of [21] as a mandatory element in certain places of free access and is intended to protect people against the risk of accidental fall without, however, prevent their forced passage or voluntary.
The requirements of the standard combined with the pursuit of beauty and comfort have contributed to the increased demand for the most diverse models of stainless steel body guards, including stainless steel with glass, due to the elegance of the design, modernity and resistance of the corrosion and temperature variations.
2.Manufacture of towers
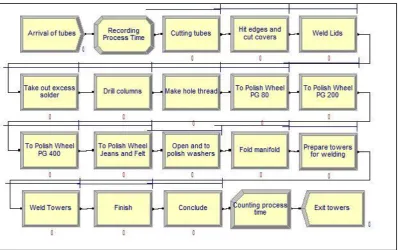
The mapping of the manufacturing processes of the towers was carried out and to facilitate their understanding, a flowchart of the production sequence was created in the Visio 2013 software, according to figure 1.
The process of manufacturing the towers consists of:
- Cut tubes: the tubes are cut into pieces of 30 cm (column) and in pieces of 5 cm (junction), both cut in a machine of multiple cut.
- Adjust edges and cut covers: the burrs coming from the cut are removed with a grinder to enable the
welding process. Cutting the covers is done in a guillotine, where the 1mm thick stainless-steel plate is cut according to the size of the columns and joints. - Weld lids and remove excess weld: the lids are welded and then passed through the ventilated disc polishing to remove any excess weld from the ends. - Drill columns and drill into the hole: two holes are made in the columns with a distance of 11cm to give more resistance to the glass, preventing it from balancing. Then, to make it possible to fit the screws, it is necessary to thread the hole.
- Polishing: The columns and joints pass through four polishing wheels, the PG 80, 220, 400 wheels and the Jeans and Felt wheel. These varied models of polishing wheels are used for sanding, finishing the weld and finishing on the flat surfaces and contours of the parts.
- Open and to polish washer: this process consists of widening the hole of the washer to fit the size of the bolt and rivet, which are then polished on the jeans and felt wheel.
- Fold Manifold: in a folding machine of sheets, the manifold, that arrive already cut, go through the process of fold in its four sides.
- Prepare and weld the towers: this process consists of joining two columns and between them a joint and welding them on the flange. To do this, it is necessary to fix the screws and rivets in order to give more stability at the time of welding.
- Finish the towers: After welding the flange, the bolts and rivets are removed, and the towers pass through the polishing wheel of jeans and felt to remove stains and/or dust, and to the final finish.
- Conclude: Silicone plastic strips to prevent friction of stainless steel with glass, manifold, screws, rivets and washers, thinner (solvent) to clean and pack.
B. Chronoanalysis
“Chronoanalysis is a tool used to evaluate and record the time spent in the company's production area, which aims to identify a logical sequence of the most appropriate and efficient operational flow to the work” [22].
According to [23], the use of chronoanalysis is advised when there is a need to improve productivity, and contributes to a better and more detailed perception of what happens in each production process. Thus, it is possible to identify the constraints and the losses of the process, allowing for successive improvements.
At the time of the study, two requests for towers were available in the company, one of 60 units and another of 30. Thus, the chronoanalysis was performed on alternate days, according to the order planning, between the months of June and July/2018, from 8:30 a.m. to 11:00 a.m. and a 2:30 p.m. to 6:00 p.m.
C. Statistical study
The technique of probabilistic sampling by conglomerate was used, where the production was divided into 9 lots of 10 towers. According to [24], in conglomerate sampling the population elements are grouped into conglomerates, and these elements can be: departments, streets, boxes, lots products, etc.
After the timing, the data were released in Minitab to obtain and analyze the control charts. Next, the production model was developed in Arena Student 14, with the objective of identifying the monthly productive capacity of towers and the average time of production per lot.
1.Control chart
In order to verify the statistical control of the process, the Shewhart control chart for individual measurements (I-MR), indicated by [25], was used when the sample size n = 1. The author guides to interpret the graph of individual observations first.
Therefore, the graph of the mobile amplitudes was considered as complement only in cases in which the graph of individual values was out of control. The result obtained through Minitab pointed out three out of control processes and the main causes detected were:
Fig. 2: Control chart for “Weld lids”
As shown in Figure 2, the samples from 1 to 5 were welded by an employee with less practice, so the two initial samples were inspected, exceeding the upper limit of control.
Fig. 3: Control chart for “Thread in the hole”
As shown in Figure 3, the sample 9 was executed with the help of another employee who was available, making the finishing process faster, with the sample being below the lower limit of control.
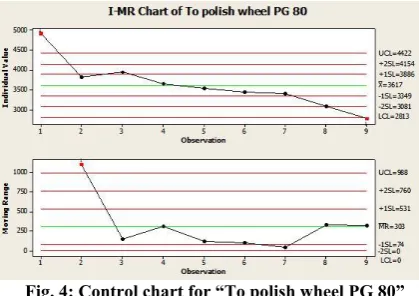
Fig. 4: Control chart for “To polish wheel PG 80”
As shown in Figure 4, the initial delay in this process was related to the machine setup. The exchange between wheel types is not performed with an appropriate tool, which eventually causes a delay in the process. The chart also shows lot 9 below the lower control limit. This was because the employee was more agile due to being at the end of working hours.
The other processes were presented within the statistical control, but during the chronoanalysis it was possible to observe many stops along the manufacturing processes related to the organization of production, location machines and equipment and machine setup.
organization, it is possible to optimize the layout [26] and obtain an increase in productivity [27].
Another proposed alternative was the restructuring of tools and equipment to reduce the machine setup, since, according to [28] [29] the reduction of the setup is important and can significantly affect the production time, and [30] affirm that the increase of productivity in the medium and long term indicate investments in innovation and technology.
IV. RESULTSANDDISCUSSION
The simulation performed in the Arena Student 14 software displays reports with the statistical calculations according to the replication parameters used. For this study, only the “Entities” and “User specified” reports will be analyzed, which will report the production capacity and the total manufacturing time of each batch, respectively. The graphical representation for the simulation is shown in figure 5.
For the construction of this model the triangular distribution type was used, applying the minimum, maximum and average values of the times (in seconds) of production presented in Minitab. The simulation was performed with 3 employees operating, since one of them operates in the administrative area, not participating effectively in the production, and for the calculation of the monthly productive capacity the replication parameters were 8 hours daily, during 20 days, according to the hourly rate practiced currently. Figure 6 shows the Entities report.
Fig. 6: Current productive capacity
The results obtained from the simulation showed that the company has a total monthly production capacity of 16 allotments (160 towers), according to figure 6.
Figure 7 shows the User specified count report.
Fig. 7: Actual average production time per allotment
The total average time to manufacture an allotment is 37373.25 seconds, which corresponds to 10 hours and 23 minutes, according to figure 7.
From this, to simulate the possible improvements obtained from the FacPlan method for the organization of tools and the environment, and the reduction of the machine setup through the restructuring of tools, presented in item C of the methodology, a tolerance was established for the time of production based on the company's proven capability, representing a manufacturing goal.
This specification is for analyzing how production performance would be in an environment with less interference. Therefore, to perform the new simulation a new triangular distribution was used with the batch values produced at the times contained within the 2-sigma limits in the control charts. The result obtained is shown in figure 8.
Fig. 8: New average lead time per allotment
According to the figure 8, the new average production time per lot became 36583.90 seconds. There was a reduction of 789 seconds (about 13 minutes) in each lot, which gave a gain of 3 hours and 30 minutes in the month. Thus, with the proposal presented would take 10h and 09min to produce 10 towers, with an average of one hour for each unit.
The process of production of the stainless-steel towers is long, however, with this gain of 3 hours and a half it would be possible to produce 3 more units in the month, increasing the company's productive capacity to 163 towers/month.
V. CONCLUSION
This study aimed to optimize the production of stainless steel towers in a Brazilian microenterprise in the Zona da Mata Mineira. Through the flowchart it was possible to visualize, describe and understand the relationship between processes. Chronoanalysis was used to measure the duration of the processes, to verify the factors involved in the production area and to construct the control charts. From there, it was observed that some of the variations in the times occurred due to machine setup delays, production organization problems, environment and tools.
Given this, a tolerance was established for the execution time of the processes based on the productive capacity of the company and therefore, only the times contained between the 2-sigma limits in the control charts would be used for the proposed simulation.
The simulations were performed in the software Arena Student 14 and showed that currently the company's monthly productive capacity is 160 towers. However, the proposed model reduced 13 minutes of the current time of manufacture of each batch of towers, allowing an increase in the productive capacity of the company to 163 towers/month.
In this way, it is concluded that the proposed simulation optimized the production of stainless-steel towers. Therefore, through the implementation of methods for organization such as FacPlan, and the restructuring of tools and equipment as suggested, it
is possible to achieve a better level of productivity and improve the operational dynamics of the manufacturing process.
REFERENCES
[1] Serviço Brasileiro de Apoio às Micro e Pequenas Empresas,
SEBRAE. Micro e pequenas empresas geram 27% do PIB
do Brasil. 2018. Available in:
<http://www.sebrae.com.br/sites/PortalSebrae/ufs/ro/artigos/ perfil-das-microempresas-e-empresas-de-pequeno-porte-2018,a2fb479851b33610VgnVCM1000004c00210aRCRD> Accessed in: 10.06.18
[2] BARBOSA, Marcos Antonio; ZANARDINI, Ricardo
Alexandre D. Iniciação à pesquisa operacional no ambiente de gestão. 3ª ed., Curitiba: Editora Intersaberes, 2015
[3] Sociedade Brasileira de Pesquisa Operacional, SOBRAPO.
Pesquisa Operacional. 2018. Available in:
<http://www.sobrapo.org.br/o-que-e-pesquisa-operacional>
Accessed in: 09.16.18
[4] RODRIGUES, Lucas Lopes Filholino; OLIVEIRA, Igor
Henrique Inácio de. Aplicação da pesquisa operacional como ferramenta para auxílio na redução dos gargalos de um processo produtivo: Um estudo de caso no setor automobilístico. INOVAE - Journal of Engineering, Architecture and Technology Innovation, v. 3, n. 2, p. 19-33, 2015
[5] BELFIORE, Patrícia; FÁVERO, Luiz Paulo. Pesquisa
Operacional para cursos de Engenharia. 1ª ed., Rio de Janeiro: Elsevier Editora, p. 15, 2013
[6] HILLIER, Frederick S.; LIEBERMAN, Gerald J. Introdução
à pesquisa operacional. 9ª ed., Porto Alegre: McGraw Hill Brasil, 2013
[7] SANTOS, Marcos dos et al. Simulação de eventos discretos
na identificação de gargalos no processo seletivo de estagiários de um órgão público federal: uma abordagem sistêmica. Universitas: Gestão e TI, Brasília, v. 7, n. 1, 2017
[8] SILVA, Marcela Carolina Rodrigues. Otimização de um
processo de produção de linguiças frescais utilizando o software ARENA®. Trabalho de Conclusão de Curso, Repositório Institucional da Universidade Federal de
Uberlândia, Uberlândia, MG, 2017. Available in:
<https://repositorio.ufu.br/handle/123456789/20838>
Accessed in: 03.28.18
[9] CORREIA, Rony Rodrigues et al. Simulação do fluxo de
ônibus no terminal de integração do Varadouro: Um estudo computacional. XXXII Encontro Nacional de Engenharia de
Produção - Desenvolvimento Sustentável e
Responsabilidade Social: As Contribuições da Engenharia de Produção, Anais Eletrônicos - Bento Gonçalves, RS, 2012
[10] FERNANDES, Alexandra Cristina Moreira. Simulação de
Linha de Produção usando a Plataforma ARENA. Relatório de Projeto, Instituto Politécnico de Bragança, 2012. Available in:
<http://projinf.estig.ipb.pt/~a21274/relatoriooo.pdf>
Accessed in: 04.17.18
[11] SANTOS, José Airton Azevedo dos; GRANDER, Gustavo.
Análise e simulação do sistema de estocagem de uma indústria moveleira: um estudo de caso. Fasci-Tech- Periódico Eletrônico da FATEC, São Caetano do Sul/SP, v.1, n. 6, p. 64 a 76, 2012
[12] PEREIRA, Alexandre Macedonia et al. Redesenho dos
processos de negócio e aprendizagem organizacional: estudo em uma empresa de medicina ocupacional. REA-Revista Eletrônica de Administração, v. 13, n. 1, p. 120-134, 2014
[13] ROMANO, Rodrigo Fernandes. Mapeamento de processos
com foco no controle de estoques de uma empresa do setor metalúrgico. Trabalho de Conclusão de Curso, Universidade
Estadual de Maringá, Maringá, PA, 2015. Available in:
<http://www.dep.uem.br/gdct/index.php/dep_tcc/article/vie w/93/19> Accessed in: 10.23.18
[14] NOBREGA, Maria Biana M. de Mello. Otimização de um
utilizando simulação de processos e métodos estatísticos. Dissertação de mestrado, Universidade Federal do Rio Grande do Norte, Rio Grande do Norte, RN, 2018. Available in:
<https://repositorio.ufrn.br/jspui/bitstream/123456789/2511 2/1/MariaBiancaMedeirosDeMelloNobrega_DIDISSE.pdf> Accessed in: 10.23.18
[15] WERKEMA, Cristina. Ferramentas estatísticas básicas do
Lean Seis Sigma integradas ao PDCA e DMAIC. 1ª ed., Rio de Janeiro: Elsevier Editora, 2014
[16] MONTGOMERY, Douglas C; RUNGER, George C.
Applied statistics and probability for engineers. 4th ed., John Wiley & Sons, Inc, 2007
[17] HENNING, Elisa et al. Um estudo para a aplicação de
gráficos de controle estatístico de processo em indicadores de qualidade da água potável. Revista Eletrônica Sistemas & Gestão, v. 9, n. 1, p. 2-13, 2014
[18] OLIVEIRA, Camila Cardoso de et al. Manual para
elaboração de cartas de controle para monitoramento de processos de medição quantitativos em laboratórios de ensaio. 1ª ed., São Paulo: SES/SP, 2013
[19] PYLRO, Adriano Siqueira. Modelo Linear Dinâmico de
Harrison & Stevens Aplicado ao Controle Estatístico de Processos Autocorrelacionados. Tese de Doutorado, Repositório Pontifícia Universidade Católica do Rio de Janeiro, Rio de Janeiro, RJ, 2008. Available in:
<https://www.maxwell.vrac.puc-rio.br/12173/12173_3.PDF> Accessed in: 09.17.18
[20] BRASIL. Lei complementar nº 123, de 14 de dezembro de
2006, Capítulo II, artigo 3°. Da definição de microempresa e
de empresa de pequeno porte. Available in:
<http://www.planalto.gov.br/ccivil_03/Leis/lcp/lcp123.htm>
Accessed in: 05.27.18
[21] ASSOCIAÇÃO BRASILEIRA DE NORMAS
TÉCNICAS. NBR 14718. Guarda-corpos para edificação. Rio de Janeiro, 2008
[22] ROCHA, Juliana Aparecida Vieira da; NAVARRO,
Alexandre. A importância da capacidade produtiva e cronoanálise para empresas do polo moveleiro de Ubá. IX SAEPRO - Simpósio Acadêmico de Engenharia de Produção. Anais Eletrônicos - Universidade Federal de Viçosa, Viçosa, MG, 2014
[23] CAETANO, Maria Eduarda C. de Souza et al. Análise do
impacto da utilização da cronoanálise nas atividades do planejamento e controle da produção - um estudo de caso em uma usina siderúrgica. XXXVI Encontro Nacional de Engenharia de Produção - Contribuições da Engenharia de Produção para Melhores Práticas de Gestão e Modernização do Brasil, Anais Eletrônicos - João Pessoa, PB, Brasil, 2016
[24] FOGO, José Carlos. Técnicas de amostragem. Universidade
Federal de São Carlos, SP, 2017. Available
in:<http://www.ufscar.br/jcfogo/EACH/Arquivos/Material_
Aula_2.pdf> Accessed in: 08.18.18
[25] MONTGOMERY, Douglas C. Introdução ao controle
estatístico da qualidade. 4ª ed., Rio de Janeiro: LTC, 2004
[26] LIMA, Marina Assunção et al. Optimization of the
industrial layout of a metallurgical using Tabu Search Metaheuristic and the FacPlan method: Analysis of the productive flow and departmental área. International Joint Conference. Valencia, Spain, 2017
[27] HEPFNER, Rafael. Planejamento de layout: estudo de caso
em um laboratório metalúrgico. Trabalho de Diplomação 2. Universidade Federal do Rio Grande do Sul, Porto Alegre, RS, 2008. Available in:
<http://scholar.googleusercontent.com/scholar?q=cache:tlrn cUXBvWYJ:scholar.google.com/+PlanejamePla+de+layout :+estudo+de+caso+em+um+laborat%C3%B3rio+metal%C3
%BArgico.+&hl=pt-BR&as_sdt=0,5> Accessed in:
10.19.18
[28] D.van Goubergen and H. van Landeghem, “Rules for
integrating fast changeover capabilities into new equipment design,” Robotics and Computer-Integrated Manufacturing, vol. 18, no. 3- 4, pp. 205–214, 2002.
[29] LOW, Shye-Nee et al. Measurement of Overall
Performance Effectiveness in Setup Improvement. Journal
of Industrial Engineering, volume 2014, Article ID 264980. Available in:
<https://www.hindawi.com/journals/jie/2014/264980/abs/>
Accessed in: 10.04.18
[30] MARTINS, Petrônio G, LAUGENI, Fernando Piero.