www.nat-hazards-earth-syst-sci.net/14/2993/2014/ doi:10.5194/nhess-14-2993-2014
© Author(s) 2014. CC Attribution 3.0 License.
Hydro-morphodynamic modelling in Mediterranean storms –
errors and uncertainties under sharp gradients
A. Sánchez-Arcilla, M. García-León, and V. Gracia
Laboratori d’Enginyeria Marítima, Universitat Politècnica de Catalunya, Barcelona, Spain
Correspondence to: A. Sánchez-Arcilla ([email protected])
Received: 29 October 2013 – Published in Nat. Hazards Earth Syst. Sci. Discuss.: 20 February 2014 Revised: 29 July 2014 – Accepted: 7 October 2014 – Published: 17 November 2014
Abstract. This paper deals with the limits in hydrodynamic and morphodynamic predictions for semi-enclosed coastal domains subject to sharp gradients (in bathymetry, topogra-phy, sediment transport and coastal damages). It starts with an overview of wave prediction limits (based on satellite im-ages and buoy records) in a restricted domain, namely the Mediterranean basin, followed by an in-depth analysis of the Catalan coast, one of its land boundaries. The morphody-namic modelling for such regions is next discussed, based on the impact of a characteristic storm. The driving wave and surge conditions produce a morphodynamic response that is validated against the pre- and post-storm emerged beach state, recovered from two lidar images. The quality of the fit is discussed in terms of the physical processes and the suit-ability of the employed modelling suite. From here an assess-ment of errors and uncertainties is presented, with the aim of establishing the prediction limits for flooding and erosion analyses, key elements for coastal engineering decisions.
1 Introduction
Coastal regions are often characterized by sharp gradients in meteo-oceanographic drivers, sedimentary fluxes and socio-economic pressures. This happens under present climate con-ditions and is also expected to occur under the projections for future scenarios, which makes such coastal areas a challeng-ing test case for predictions and projections alike. Our study case is the Catalan coast in the northwestern Mediterranean (Fig. 1). This region is characterized by a complex coastal orography with the Pyrenees to the north as the main oro-graphic feature running in an east–west direction. The coastal area is conditioned by the opening between the Pyrenees and
the Alps in southern France and including the Rhone valley. The Catalan coast domain also features several abrupt moun-tain ranges parallel to the coast in a northeast–southwest direction.
During regional northern wind events the orography favours wind channelling down the river valleys and through the openings in the coastal mountain range, which leads to jet-like wind patterns over the coastal area with a northwest direction. These land to sea winds from the northwest (Mes-tral in the local vernacular) are particularly intense and per-sistent, especially during the autumn and winter seasons. In winter and early spring the eastern wind fields present the highest wind speeds and the longest fetch, resulting in the largest waves acting on this coast. They are associated to low pressure centres over the western Mediterranean, which of-ten spend several days recirculating in this part of the basin and therefore generating wave storms with more than one peak. This turns out to be an effective mechanism for pro-ducing erosion, flooding and various types of damage along the coast.
Figure 1. Western Mediterranean Sea and the three domains employed in the numerical simulations. The purple one represents the western
Mediterranean Sea, the green one represents the Balearic Sea (D-2) and the red one the Catalan Coast Shelf (D-3). The red crosses denote the XIOM buoy positions. The two insets (Mataró and Badalona municipalities and beaches) correspond to the areas selected for morphodynamic analysis.
reach up to 50 cm (Conte and Lionello, 2013). The astronom-ical tidal range, between 10 and 30 cm, is quantitatively less important, making the area a micro-tidal environment.
For this type of coastal domain, the sharp gradients (due to the topobathymetric features) in the spatial patterns of wind, wave and circulation fields impose a tough challenge for numerical simulations, demanding a mesh discretization fine enough to solve these variations. To prove this point, the paper will start by presenting wave simulations, the nesting strategy and how the computational results have been cali-brated with available observations. This allows some bound-aries to be established for a hindcasting evaluation (Sect. 2). The paper continues with a description of a significant wave storm that has recently affected the Catalan coast and for which there are observational data (Sect. 3). We shall anal-yse the wave evolution from deep to shallow water depths and assess the resulting errors, linking them to the control-ling physical processes.
The morphodynamic response is analysed next, based on pre-/post-storm emerged lidar images and the simulated ero-sion and flooding (Sect. 4). This allows calculation of the errors between observations and simulations and discus-sion of the underlying hydro-morphodynamic uncertainties (Sect. 5). After this there is a discussion on the limits of hydro-morphodynamic predictions and the implications for engineering design and management decisions (Sect. 6), fol-lowed by some conclusions (Sect. 7).
2 Regional wave assessment and modelling
The wave code selected is the third-generation model SWAN (Simulating Waves Nearshore), which is based on a finite differences discretization of the wave action balance equa-tion (Booij et al., 1999). It incorporates wind wave growth,
quadruplet and triad wave–wave interactions plus depth-induced breaking. For this analysis, Janssen (1991) formu-lation has been selected for the wind wave growth, based on previous work in the area. Non-linear wave interactions are parameterized through the DIA scheme (Hasselmann et al., 1985) and the LTA method (Eldeberky, 1996) at deep and in-termediate waters, respectively. Regarding sink terms, white-capping dissipation corresponds to the Komen et al. (1984) formula and bottom friction dissipation is derived from the JONSWAP results (Hasselmann et al., 1973). Finally, depth-induced breaking is triggered through the Battjes and Janssen (1978) bore-based model.
Calculations are performed through a set of three nested domains that cover the Mediterranean Sea. The first is the Mediterranean sea grid which has a resolution of 0.09◦×0.09◦, comprising from−6 to 36.93◦longitude and from 30 to 45.93◦latitude. The second one is the Catalan sea domain, with a 0.025◦×0.025◦ grid size, comprising from −0.5 to 4.0◦longitude and from 33.5 to 38.5◦latitude. The last one is a 1×1 km grid that represents the shelf domain off the Catalan coast, with a land boundary on the northwestern side and three open boundaries at the north, south and east of the domain. In all three cases, the bathymetry comes from the GEBCO (GEB-2008) data set which has a resolution of 1 km approximately.
(Tonani et al., 2009). The latter have a horizontal grid reso-lution of 1/16◦(ca. 6–7 km). Recently, Alomar et al. (2014) tested higher resolution wind models going down to a mesh size of 4 km and a wind input every one hour. In all cases the differences between the input and dissipation terms were not relevant for such limited coastal domains.
Simulations span 20–31 December 2008 (i.e. they are ini-tiated six days prior to the storm peak on 26 December). This start point guarantees enough time margin to avoid warm-up phenomena, excluding them as a possible uncertainty factor during the extreme event simulation. The model outputs are compared with different data sources ranging from altimeters (deep water) to buoy network data (intermediate water). Usu-ally, a storm event is characterized by the storm duration and wave height, peak period and direction. Wave height records are available at both regional and local scales, providing a natural integrator of meteorological parameters at the differ-ent spatial resolutions. The suitability of the models for the studied domain and some of the associated errors have also been analysed in Pallarés et al. (2014).
The first step in the error estimation is to compute the rela-tion between satellite preprocessed wave height data (Quef-feulou, 2004) and the numerical output at deep waters. Up to 14 000 data are within the considered regional area, derived from the combined tracks of four satellites: ERS-2 (21 % of the total), ENVISAT (22 %) , JASON-1 (27 %) and JASON-2 (30 %). The second step deals with intermediate water com-parisons, based on the XIOM meteo-oceanographic network observations. In this case, hourly wave height, period and di-rection are recorded. Three didi-rectional buoys cover the three main Catalan coastal sectors (Fig. 1): Barcelona (Llobregat buoy, deployed at 45 m depth), Girona (Tordera buoy, de-ployed at 75 m) and Tarragona (Cap Tortosa buoy, dede-ployed at 60 m). This network of observational points allows both average and extreme hydrodynamic patterns along the Cata-lan coast to be captured accurately (Bolaños et al., 2009). In the studied period, 22–31 December 2008, there were inter-vals of average and extreme wave energy levels. The error analysis begins two days after the simulation initial time. Based on previous results, it was known that when start-ing from a stationary state (pre-defined JONSWAP spectra), about 48 h is needed to reach an stabilization of the error.
3 Storm simulation and analysis
In the last two decades, up to 200 damaging wave storms have been reported at the Catalan coast. Although this zone could be considered as well monitored in terms of hydrody-namics (see Sect. 2), the lack of pre- and post-storm beach data introduces an important constraint in terms of storm im-pact evaluation. However, for the selected storm (Decem-ber 2008), pre- and post-storm sub-aerial profiles from a lidar campaign were available, offering an opportunity for
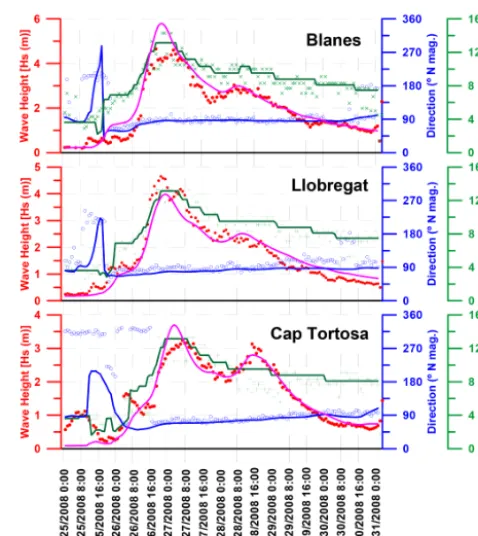
Figure 2. Intercomparison of the recorded (XIOM network) and
calculated wave parameters near the coast (Llobregat buoy, moored at 45 m; Blanes buoy, moored at 75 m and Cap Tortosa buoy, moored at 60 m). Magenta solid line: computed wave height. Blue solid line: Computed direction. Green solid line: computed peak period. Red dots: XIOM wave height. Green crosses: XIOM peak period. Blue circles: XIOM wave direction.
improvingmorphodynamic response assessment under ex-treme conditions.
The selected event is a Mediterranean storm that affected the entire Catalan coast during almost 3 days (26–29 Decem-ber). A high pressure centre in northern Europe displaced a weak low pressure centre in front of the Catalan coast which kept on growing due to the difference in air–water tempera-tures, generating strong eastern winds with speeds of about 50 km h−1and gusts of up to 85 km h−1. As a consequence, an energetic storm centre, travelling from north to south, af-fected the Spanish northeast coastal zone for about 3 days, producing severe damage to many coastal infrastructures.
The highest waves recorded (XIOM network) appear in the central and northern coastal sectors with significant wave height (Hs) values up to 4.65 m and peak periods up to 14.3 s
(Fig. 2). In that area,Hsgrew from 0.5 m to 4.65 in about 12 h
as a result of the eastern strong winds, with maximum height values of about 8 m. The southern buoys registered smaller wave heights and periods, up to 3.3 m and 13.3 s respectively. The storm duration (considering a threshold value ofHs=
If only the wave height is considered, the storm had an as-sociated return period of about 5 years. However, its duration and the integrated energy contents make the event more ex-treme and belonging to the most damaging category that a storm can have in the Catalan coast (Sánchez-Arcilla et al., 2011b). The impact of this storm was significant shoreline retreat, with intense overtopping and flooding, especially at the northern sector, together with damage in many coastal and harbour structures. There were also three casualties and a generalized social alarm, which resulted in the closing of beaches and promenades. Further details of the storm char-acteristics and effects can be found in Sánchez-Arcilla et al. (2013) and Gràcia et al. (2013a).
To evaluate the influence of the wave dissipation term in the action balance equation, a quadratic cost function (Eq. 1) has been fitted. Only the whitecapping component has been considered since for deep to intermediate depths the contri-bution of depth-induced breaking and bottom friction are sig-nificantly smaller. The data set is the same as in Sect. 2, from which the source terms have been also evaluated.
The cost function establishes a scale of model error to observed variance. If the cost,χ, is equal to zero, both the recorded and computed time series reach the same value. In-creasing costs indicate lower degrees of similarity. Further-more, the quadratic term ensures that large differences weigh heavily in the totalχvalue. Such a cost function can be writ-ten as:
χ=
s
1
N σY2 N
X
n=1
(Xn−Yn)2, (1)
whereXandY refer to the computed and observed signals respectively, N is the number of data points andσY2 is the variance of the observations.
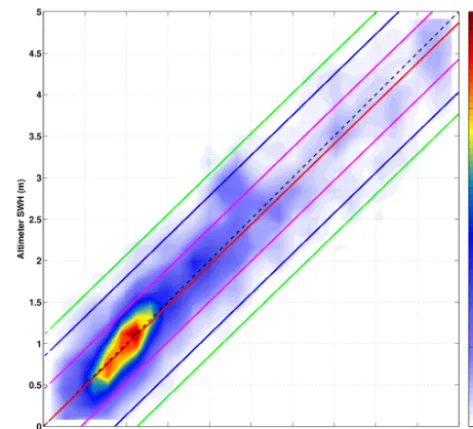
The minimum χ cost obtained with altimeter wave height is 0.37 with a rate of whitecapping dissipation of 2.25×10⁻⁵. Costs between 0.4 and 1.0 may be interpreted as the range in which the variables are well-modelled and the predictive skill is acceptable (Holt et al., 2005). The dissipa-tion parameter has been obtained with a sample that includes both moderate and extreme conditions (34 % of the data records are above Hs=2 m) spanning the different storm
stages (i.e. calm, growth and decay). Higher data densities are found in the interval of Hs 0.5 to 1.5 m, where model
outputs vs. observations almost follow a linear trend (see red line in Fig. 3). The obtained fit degrades, i.e. tends to separate from the optimum ratio (dashed black line) at more energetic Hsvalues. Furthermore, when this linear trend is assumed, a
forecasting error from 0.5m to 0.75m would be within a con-fidence interval from 70 % (magenta lines) to 99 % (green lines), respectively.
The spatial distribution of wave height differences has been analysed with a normalized root mean square error ap-proach (NRMSE, Eq. 2). This statistical indicator is obtained clustering the data subset within a 0.5◦×0.5◦grid and a time
Figure 3. Colour scale representing the density of significant wave
height (SWH) points for the whole Mediterranean basin. The axes represent the altimeter wave height (vertical axis) vs. the SWAN wave height (horizontal axis), both in metres. The red line corre-sponds to a linear fitting, the magenta, blue and green lines indicat-ing the confidence intervals of 70, 95 and 99 % respectively.
window of 20 min. In case of having more than one time point on the same grid node a mean NRMSE is obtained (Fig. 4):
NRMSE=
v u u u u u t
n
P
i=1
(Xi−Yi)2
n
P
i=1
Yi2,
(2)
whereX and Y refer again to the computed and observed signals respectively.
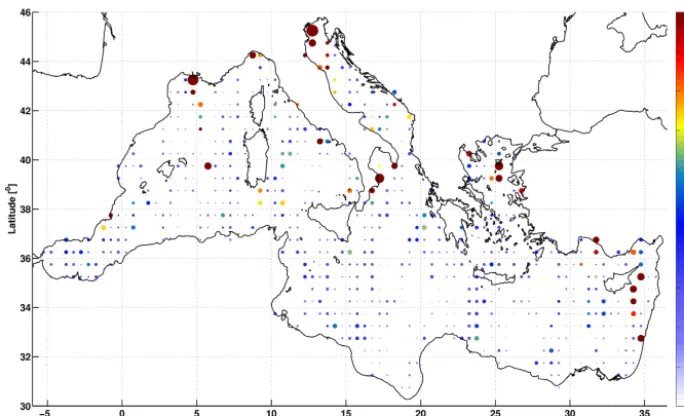
This analysis has shown that wave heights are accurately reproduced with values ranging from 0.2 to 0.6, at deep waters (i.e. with no obstacles such as islands, mountains and peninsulas that modify the meteo-oceanographic fields). However, sheltered nearshore areas such as the southern part of France, northern part of Adriatic Sea, Aegean Sea and the eastern part of Cyprus confirm the more limited model per-formance (NRMSE near 1.0) when using the coarse mesh. This phenomenon is partially alleviated by a suitable nest-ing strategy and by implementnest-ing more advanced nearshore physical parameterizations.
Figure 4. Comparison between simulations and altimeter data for the wave height in the Mediterranean basin. The bubble size indicates the
wave height total error in %. The colour scale represents the NRMSE.
betweenpredicted and measured wave height was obtained during the first storm peak, although the second one pre-sented a much better fit. In the southern part of the coast, at the Cap Tortosa buoy, the first peak is overpredicted (3.14 m measured vs. 3.5 m modelled) while the second storm maxi-mum is underpredicted. At the same place, it is observed that a 3 h lag exists for the predicted storm peak. Llobregat and Cap Tortosa points show a smaller error than the Blanes loca-tion (the Llobregat buoy for the first storm peak presented a discrepancy of 0.56 m). In these central and southern parts of the coast the storm impact was lower. In all cases, the storm (wave height) growth and decay slopes were well hindcasted, capturing both the storm onset and peak pattern.
The peak period and average direction exhibit a similar behaviour, but with slightly higher cost levels (with a max-imum value ofχ=0.55), underlining that the model repro-duces better the wave height pattern, particularly for the cen-tral coast (Llobregat buoy). The quality of the fit for peak periods depends on spectral shape and fetch geometry, com-plicating the hindcast. This makes the fit more complex, par-ticularly when considering the directional veering and tran-sient features typical of semi-enclosed domains with variable winds, where the growth rates may be larger than the com-monly parameterized values (Alomar et al., 2014)
4 Nearshore hydro-morphodynamic impact – erosion and flooding
The main storm-induced coastal impacts (erosion and flood-ing) can be predicted from a coupled nearshore model driven by the waves generated in the previous section. For that purpose we have employed a 1×1 m digital elevation model
(DEM) grid from lidar campaigns, reproducing the beach topography at two target locations, Badalona and Mataró beaches. Both are located at the central part of the Cata-lan coast (up-drift and down-drift of a harbour barrier) and suffered important damage during the storm event (Fig. 1). For the submerged beach a bathymetric campaign from early 2008 was used, as the best available characterization for the pre-storm beach.
The Badalona beach is a typical Mediterranean urban beach with a seafront promenade in its backshore between +5 and+6 m above MWL. The beach is characterized by coarse sediment, between 350 and 600 µm. It is a reflective beach (Wright and Short, 1984), with a Dean parameter (di-mensionless sediment fall velocity) <1 and a depth of clo-sure of 6.35 m. The pre-storm bathymetry shows essentially parallel isobaths and a submerged slope of about 18H : 1V. The main storm impacts reported were severe shoreline re-treat and flooding due to frequent run-up episodes.
important growth at the southern part due to the impound-ment produced by the harbour breakwater.
The differences between pre- and post-storm LIDAR bathymetries have been calculated as a first assessment. In previous sections it has been shown that the December 2008 storm was a double peak event with a predominant east-ern direction. Waves coming from the east induced cross-shore directed (undertow) fluxes and a longcross-shore current from northwest to southwest due to oblique incidence. Cross-shore currents together with high run-ups (enhanced by the storm surge) were able to erode sub-aerial beach sediment. This material was transported onshorewards through over-topping or offshorewards driven by undertow currents. The longshore currents advected sand from northeast to south-west which was deposited at the southern part of the domain, impounded by the barrier presence. This barrier effect is due to the Badalona port in this case and to a non-permeable groyne in the Mataró case. In the accretive zone, the max-imum shoreline advance was near 36 m at Mataró and 4 m at Badalona, whereas at the erosive zone the maximum shore-line retreat was 1.4 and 3.69 m, respectively.
The Badalona sector (Fig. 5a) may be divided in three tran-sects: from the northern part to the groyne (B-North [B-N]), from the groyne to the sewer outfall (B-Central [B-C]) and from the sewer outfall to the southern barrier (B-South [B-S]). There is a 2 km long, wide and open beach just outside the analysed domain (northern part) constituting a sediment source that is transported towards the Badalona sector by south-directed longshore currents. This material is retained by a groyne (see green line) located at about 100 m from the north border of the coastal stretch. In addition, cross-shore currents drive material towards the offshore part of the pro-file. From+5.0 to+2.5 m erosion dominates, relocating the sediment at the shoreface (i.e. from+2.0 to 0 m). On the con-trary, deposition occurs at the central B-C zone where the sewer outfall acts as a sediment trap. Finally, the southern part acts as a sink zone, receiving sediment from longshore currents and the sewer outfall but remaining sheltered by the Badalona port.
The Mataró domain (Fig. 6a) may be explained with only two transects: from the northern part to the stream [S point in magenta] (M-North [M-N]) and from the stream to the south-ern part (M-South [M-S]). At the north part a revetment (see green line) protects the railway from wave action. High run-up and surges enhance wave-induced eroding fluxes that take material from the sub-aerial beach towards the submerged beach, mainly by undertow currents. Such an offshore flux can be advected by longshore currents, which take it from the narrower northern sector N) to the southern side (M-S), storing the sand next to the groyne. The stream mouth (see magenta line) shows a locally important accretion that should come from the river solid discharge, trapped by the low elevation zone present there.
During the studied storm there was a significant precip-itation volume, reaching daily mean values of 23.1 mm on
26 December and 16.6 mm on 27 December. Storm runoff contained fine material, making it difficult to distinguish be-tween the inland or offshore origin of the sediments.
Nearshore hydro-morphodynamics have been computed with a locally adapted version of the XBEACH model (Roelvink et al., 2009), termed PREMOS. This code solves nearshore waves and currents by means of a wave ac-tion balance equaac-tion (similar to SWAN), coupled to a 2DH Navier Stokes shallow-water system (Stelling and Duinmeijer, 2003). This coupling provides circulation and bed shear stress fields which are used to feed an advec-tion–diffusion equation computing the 2DH sediment con-centration patterns. This allows estimation of sediment fluxes based on the continuity of sediment mass equation with suit-able source/sink terms. From here we can calculate ero-sion/accretion at every grid node, including the possibility to trigger an avalanching mechanism (van Thiel de Vries, 2009) on the wet–dry (shoreline) beach boundary wherever the slope requires it.
The two studied beaches (Badalona and Mataró) have been discretized with an irregular grid. The Badalona domain has a cross-shore distance of 500 m (maximum depth=19.60 m) and an alongshore distance of 370 m. The mesh has a mean grid size of 6.2 m in the cross-shore and 4.56 m in the along-shore directions, with a total of 6724 nodes. The Mataró domain has a cross-shore distance of 1440 m (maximum depth=11.24 m) and an alongshore distance of 1640 m, with 26 569 nodes. The mesh has a mean grid size of 8.9 m in the cross-shore and 10.12 m in the alongshore direc-tions. The sediment has been taken as uniform in size, both for Badalona beach (D50=550 µm) and for Mataró beach
(D50=500 µm). The sediment equilibrium concentration has
been evaluated with the van Rijn (2007b) formulation based on previous results from the Catalan coast (Sánchez-Arcilla et al., 2013).
The model performance has been evaluated through the Brier skill score (BSS) index (van Rijn et al., 2003):
BSS=1−
D
zb,c−zb,m
2E
D
zb,0−zb,m 2E
(3)
wherezb,mis the post-storm topography from LIDAR,zb,c
is the model output grid andzb,0is the pre-storm
topogra-phy from LIDAR. A BSS value of 1 means that the simula-tions and measurements fully agree. As these two data sets diverge, the BSS gets smaller, even reaching negative values. The threshold value that indicates an acceptable reproduction is about 0.4.
Figure 5. Topography of the emerged beach for the Badalona case. Contour lines represent the initial state of the sedimentary deposit.
Colour scale: Blue and red indicate accretion and erosion, respectively. Green (Gr) represents the groyne position. Magenta (SW) represents the sewer outfall position. (a) Differences between the measured morphodynamic states (pre- minus post-storm conditions); (b) differences between the calculated morphodynamic states (pre- minus storm conditions); (c) differences between measured and calculated post-storm conditions. All values are in metres.
Figure 6. Topography of the emerged beach for the Mataró case. Contour lines represent the initial state of the coast. Colour scale: blue
and red indicate accretion and erosion, respectively. Green (Gr) represents the revetment. Magenta (S) represents the stream discharge area.
(a) Differences between the measured morphodynamic states (pre- minus post-storm conditions); (b) differences between the calculated
morphodynamic states (pre- minus post-storm conditions); (c) differences between measured and calculated post-storm conditions. All units are in metres.
coast has resulted in BSS values around 0.44, which can be considered as acceptable (Gràcia et al., 2013b).
The offshore boundary conditions consist of: (a) direc-tional spectra from the SWAN model output (see Sect. 3) every 20 min, and (b) sea level time series. These series are generated from blending Barcelona port sea level measure-ments (provided by Puertos del Estado) with assimilated lo-cal atmospheric pressure gauges, with a time sampling of 300 s. Storm surges did not influence significantly the sea level height, except on 25 December when there was a mean decrease of 8 cm and the second half of 26 December when a mean increase of 12 cm occurred.
As noted in Figs. 5b and 6b, the simulations have re-produced the observed erosion and accretion patterns. From a qualitative point of view, the model has even been able to capture the influence of local constraints such as the Badalona groyne or the existing revetments. However, the sedimentary input from land, although observable, has not been taken into account due to the lack of reliable data.
With these settings a BSS of 0.36 has been obtained for Badalona beach, which can be considered as acceptable. However, the final offshore displacement of the run-up ac-tion point is 0.5 m (i.e. there is no shoreline retreat as the aerial photography suggested) whereas the maximum simu-lated run-up is 2.3 m.
Better results have been achieved at Mataró beach, al-though it is a larger area (BSS=0.38). In this case, the emerged erosion/accretion patterns are well reproduced, showing a general reflective behaviour at the submerged part. Sediment from the depth of closure to the 2 m contour line goes onshorewards to the shoreline, leading to a steep and almost homogeneous submerged beach slope (4H : 1V).
5 Errors and uncertainties
Wave patterns have been reproduced with a relative error level of around 20 %. However, the resulting error in morpho-dynamics is of the order of 1.0 m, leading to a relative error level beyond 50 %. The error is propagated in a non-linear sequential manner: from shelf meteo-oceanographic condi-tions, controlling regional hydrodynamics, to local (near-shore) hydro-morphodynamics and then to morphodynamic evolution. In Sect. 3 the wave dissipation term (character-izing wave energy levels as one of the main drivers) has been tuned considering the generation term as fixed. There-fore, we shall here consider dissipation as fixed and analyse the sequential error propagation, with emphasis on the well-recognized wind field uncertainty (Cavaleri et al., 2010; Alo-mar et al., 2010).
For this purpose a linear correlation between wind veloc-ity measurements and simulations, analogous to the one pre-sented in Sect. 3 (i.e. altimeter wind modulus vs. calculated wind field modulus) has been obtained (not shown here). When the numerical wind fields for this specific storm are in-creased by 10 %, the fitness improves at deep waters (i.e. D-1 domain, see Fig. 1). This is in accordance with previous re-sults (Bertotti and Cavaleri, 2011) and shows that a 15% error in wind forecasting is not unusual, especially when sharp gra-dients occur. To perform an error assessment we can perturb the wind field strength (Alomar et al., 2009, 2014) and quan-tify the consequences at nearshore scales. The following sub-set of cases has been selected, employing the same method-ology described in Sects. 3 and 4: no perturbation (A); 20 % increase (B), 10 % increase (D) and 5 % increase (F); corre-spondingly 20 % (C), 10 % (E) and 5 % (G) decrements.
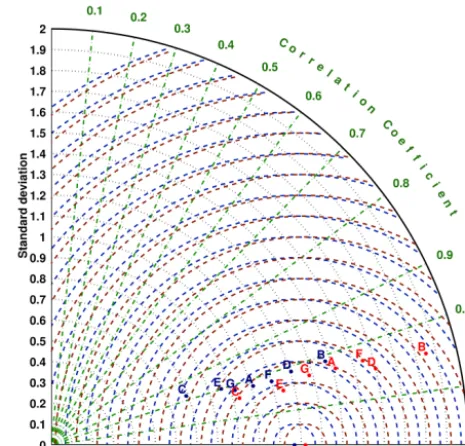
Wave height data from the XIOM buoy network will be compared with the SWAN output from the D-3 domain (i.e. 1×1 km mesh). A sample comparison of the observations from two buoys (Llobregat and Blanes locations) vs. the model output using a Taylor diagram (Taylor, 2001) appears in Fig. 7. This diagram summarizes observations and model agreement, establishing a graphical relationship among stan-dard deviation (scaled by the number of samples), centred root mean square difference (CRMSD, scaled by the number of samples) and correlation coefficient. The model perfor-mance may be assessed from the distance between the ob-servations’ reference point (LLOB for Llobregat and BLAN for Blanes buoy, respectively) and the model points (see red points for Blanes and blue ones for Llobregat). Note that the reference point in thexaxis is related to the standard devia-tion intrinsic to each buoy. In other words, since higher waves were recorded and more variability exists at the Blanes loca-tion, the standard deviation is slightly larger.
Interestingly, each buoy presents distinctive trends but with common traits that support the existence of a link be-tween deep and intermediate water wave conditions (through the propagation physics). If the wind modulus field is de-creased, better performance (smaller deviation) is found at
Figure 7. Hydrodynamic sensitivity analysis schematized in a
Tay-lor diagram. Green lines represent the correlation coefficient. Blue semicircles represent the CRMSD error for the Llobregat buoy. Red semicircles represent the CRMSD error for the Blanes buoy. The radius is proportional to the CRMSD, representing a 0.1 unit each step. Red (Blanes buoy) and blue (Llobregat buoy) dots come from the sensitivity analysis. Point legend: A (Original wind field), B (+20 %), C (−20 %), D (+10 %), E (−10 %), F (+5 %) and G (−5 %). All perturbations refer to the wind driving (for initial or base state, see text).
Blanes, while the opposite occurs at Llobregat. The model’s performance was worse for extreme cases: B and C did not show any improvement. On the same line, E(−10 %) case at Blanes and F(+5 %) case at Llobregat show smaller devi-ations than the base model. These results reinforce the con-cept that a perturbation ranging from 5 to 10 % may represent more accurate wind fields in terms of the resulting waves.
In both cases, model and observations may be consid-ered as well correlated, with mean coefficients near 0.95 at Llobregat and 0.97 at Blanes. Likewise, CRMSD is higher at Blanes (mean value of 0.45) than at Llobregat (0.41). Moreover, distances among the different cases are greater at Blanes than at Llobregat, suggesting that Blanes is more sen-sitive to perturbations. This may be attributed to the fact that the Blanes location is more exposed to eastern wave storms (more energetic, and thus more capable of producing mor-phodynamic impact) than the Llobregat location.
Figure 8. Morphodynamic sensitivity analysis. Badalona BSS
ap-pears in red; Badalona bias in blue. The Mataró BSS is in purple; the Mataró bias in green. Thexaxis indicates the base simulation and the numerical results correspond to increments (or decrements) in the wind field input.
south-central (Tarragona) coastal sector (see Fig. 2), suggest-ing that simulations for moderate waves are better than for more extreme (high or low) ones.
Hydrodynamic drivers play a fundamental role in coastal evolution, (Gràcia et al., 2013b) and a wider range of BSS values was expected when perturbing sea level and wave con-ditions. Directional wave spectra did alter the metrics but, surprisingly, sea level variations did not trigger any signifi-cant change in the response. This is attributed to the reserve beach berm level in some profiles and to the crest level of the promenade or revetment in others, suggesting a transient morphodynamic response.
In Sect. 4 it was noted that PREMOS results were smoother than the observations (see Figs. 5c and 6c), mean-ing that an increase of the drivers’ level would lead to sharper morphodynamic evolution. As an illustration, in Fig. 8 for the Mataró case (see purple line), a moderate increase of drivers (+5%, F case) improves BSS from 0.38 to 0.44. This be-haviour reinforces the critical role played by hydrodynamic forcing, whose best model skill is obtained by increasing the wind strength in a moderate way. However, there are still ex-ceptions such as the G case (−5 %), where a decrease of hy-drodynamic action improves the sub-aerial beach accretion in Mataró south (see Fig. 6b), which goes from+6 to+4 m and results in more balanced metrics.
Therefore, whenever the wind strength is augmented, both correct and incorrect patterns tend to be amplified. A bal-anced fit quality is provided by the bias (see green line) and higher BSS values are, thus, not necessarily correlated with lower global mean error. For very energetic levels, e.g. B sce-nario (+20 %), some simulations may even become morpho-dynamically unbounded and, thus, unstable.
Similar conclusions can be derived from the Badalona beach case (see red line), but in this case morphodynamic patterns are more complex due to local constraints. If the wind modulus is decreased by 5 % (G case), the balance between correct and incorrect patterns leads to higher BSS (from 0.36 to 0.40). Note that this is another case where bias
increases (see blue line) and BSS increases, indicating that the overall pattern reproduction is improved whereas the er-ror level is not. This may be explained in terms of a bal-ance between local variables and overall energetic level. For instance, when the wind input is reduced (−10 or −20 % in E and C cases), the observed morphodynamic patterns (see Sect. 4) are not properly developed, resulting in a BSS around 0.2. However, when the wind strength is decreased unrealistically, the sediment fluxes coming from the northern part of the domain start to bypass the groyne (see red line), reversing the behaviour in the central part [B–C], Fig. 5a and c, from erosion to accretion.
6 Discussion
Uncertainty reduction, as seen in previous sections, depends critically on the accuracy of the forcing fields but is also con-ditioned by all terms appearing in the governing equations. In this balance, the physics, the corresponding parameteriza-tions and the numerical discretizaparameteriza-tions play highly important roles.
As shown in Sect. 3, strong bursts of wind momentum transfer were captured by the wave model, albeit with large errors in areas near the land–ocean border (e.g. southern France, see Fig. 4). The implemented wave growth param-eterizations are based on moderate wave conditions, because extreme event data for semi-enclosed domains are scarce. At intermediate waters, for this specific storm, the wave height gradients are well captured by the wave model, being steeper than the observed ones and leading to overestimation (i.e. at Blanes the growth slope was 0.29 m h−1 in the XIOM
buoy and 0.33 m h−1at the SWAN model) and milder when
underestimating (i.e. at Llobregat was 0.22 m h−1 at XIOM and 0.18 m h−1). But at Blanes, the error at the first storm peak was near 1.5 m (Sect. 3) whereas the discrepancy dur-ing wave growth was about 0.7 m. Despite model and ob-servations having a similar growth slope, their offsets differ by about 1 m (Fig. 2). Note that the wave directional shift goes from 300 to 90◦ in less than 2 hours (from 17:00 to 19:00 on 26 December), with a quicker veering at the north-ern part, more exposed than at the Central or southnorth-ern parts. At Blanes, the wave action balance responds to that sudden shift with an unrealistic sharp increment of the wave height (0.6 m), leading to the abovementioned offset differences.
the storm peak and the second occurs at the growth phase of the second storm peak (30 h later approximately). When the wind modulus is increased, the run-up maxima show a direct proportionality. If the wind is reduced by 20 %, the second run-up peak almost disappears, leading to total erosion vol-umes near zero at the emerged zone. However, if the wind fields are increased by 20 %, the second run-up peak reaches 2 m and the first one 2.75 m, while in the unperturbed sim-ulation the corresponding values are 1.3 and 2.3 m, respec-tively. Higher run-ups are correlated with stronger undertow currents, advecting sediment from the emerged to the sub-merged part of the beach and enhancing erosion.
As noted in Sect. 4, the final submerged beach slope tends to remain similar in all the simulations, being intrinsic to beach characteristics and parameterizations; the correspond-ing shorelines’ positions are, however, different. Considercorrespond-ing the final beach profile of the unperturbed simulations as refer-ence, the−20 and−10 % cases exhibit a mean shoreline re-treat difference (onshore) of 30 and 18 m, respectively. There is no difference in the final beach response between the base and the−5 % simulation. However, same final beach profiles are found with the +5 and+10 % increments, reporting a shoreline increase of 15 m. In these two cases, the mobility area begins further offshore (at about 5 m water depth) due to the increase of wave action, whereas in the milder cases, all areas are displaced inshore. For more dissipative beaches (as in the Badalona case) we may find an opposite response, with shoreline retreat and offshore displacement associated to more energetic waves.
Adding storm surges to incident wave action (see Sect. 4) should have deep and significant morphodynamic conse-quences, although in some runs they may be numerically limited. A perturbation of+0.1 m in sea level due to surges or uncertainty provokes a markedly different beach response and flooding consequences. The amount is a function of berm or structural crest levels (e.g. the promenade at the Badalona case and the revetment at the northern part of the Mataró case).
The simulated bottom and coastline evolution will depend on the overall sediment budget, which means considering the land discharge (in this case the sewer outfall at Badalona and the river stream at Mataró). They have not been included in the analysis, however, due to the lack of quantitative obser-vations, but they are expected to have a significant (even if local) effect on the morphodynamic evolution under storm events, when flash floods in a few hours discharge most of the land-derived sediments expected in an average year (see Sect. 4, Figs. 5a and 6a).
In the presented cases, as usually happens in coastal stud-ies, the emerged beach may be characterized (e.g. using LI-DAR) in a more quantitative manner than the submerged part of the profiles, which had to be at least in part interpolated. This introduces another uncertainty in the computations, al-though in the presented cases the interpolated submerged beach behaved (qualitatively) according to expectations from
previous knowledge (campaigns and simulations). The inter-polation provides, in addition, the smooth bathymetry that is required to avoid instabilities in the numerical runs, which often requires artificial smoothing of surveyed isobaths to ensure numerical stability, particularly when sharp gradi-ents are present. Because of that it cannot be stated, in gen-eral, that high-resolution bathymetry (with abrupt elevation changes) would significantly improve the results with respect to a smoothed geometry.
The connection between the emerged and submerged parts of the beach through the swash zone is another important hindrance to present numerical approaches. It depends on non-linear processes such as wave asymmetry, skewness and non-linear moments of bottom orbital velocity, including the turbulent component. As it has been noted in Sect. 4, van Rijn (2007a) is one of the formulations that takes part of this complexity into account. Some of these processes has been included in PREMOS, but in a simplified form and without considering the new knowledge recently derived from large-scale laboratory data (Alsina and Cáceres, 2011; Sánchez-Arcilla et al., 2011a).
In addition to this land boundary condition, the budget bal-ance will depend on the lateral sediment fluxes, which consti-tute another uncertainty source. These lateral conditions de-termine the real sand volume available in a littoral cell and, therefore, the amount that can be mobilized. The uncertainty can, however, be partially alleviated with nested simulations that move these poorly known sediment boundary fluxes far enough.
In all the above fluxes and boundary conditions there is also the question of multiple sediment sizes, which is the nor-mal situation in real beaches but is seldom considered in sim-ulations. Effects such as heterogeneous mixing and bottom armouring are still not considered in state of the art models.
In summary, present models combine multiple limitations that, in addition to natural variability, result in uncertainties at multiple scales which are still hard to quantify, both indi-vidually and as part of a joint assessment.
7 Conclusions
of error that, together with the under- and over-predictions mentioned in the paper, may lead to important differences when simulating erosion or flooding processes.
The spatial distribution of sediment fluxes introduces fur-ther uncertainties in the simulations, whose errors may go from 20 % for hydrodynamics to more than 50 % for the com-puted morphodynamics. This is due to the integrative nature of the calculated sea bed evolution (responding to wave and surge conditions plus the effects of sediment characteristics, the presence of barriers, etc.). The resulting evolution comes from mutually interacting longshore and cross-shore trans-ports that must appear explicitly in the computations (e.g. the discussed offshore transport during storms that is then cap-tured by the alongshore flux and leads to enhanced bypass around the tip of breakwaters or groynes). The river and out-fall solid discharges should also be considered in the analy-ses since their signature is apparent in some of the data. The lack of quantitative measurements, however, has precluded considering these in the paper, adding another source of un-certainty. The morphodynamic computations also integrate the sediment fluxes at the lateral and shoreline boundaries, all of which are difficult to quantify. This explains the large discrepancies of simulations and observations (up to 1.5 in bed level in the worst cases) and justifies BSS index values of around 0.30. The quality of simulated results decreases in the presence of structures (groynes, revetments, etc.), where the modified sediment fluxes are even more uncertain (more complex hydrodynamics and morphodynamics, partial bar-rier effects, etc.).
The quality of the predictions may be improved by semi-empirical coefficients (e.g. a 10 % increase in the driving wind velocity) or by improved physical formulations (swash zone parameterized fluxes for the shore boundary condition). For storm conditions, however, more energetic conditions may lead to larger errors if the input or boundary condi-tions are perturbed, but they may also converge more quickly towards the true state if these conditions correspond to the sought solution.
This illustrates the complex nature and propagation of er-rors in hydro-morphodynamic modelling suites and the need to combine measurements with high-resolution physics to improve the accuracy and robustness of the calculations. This would be the way to achieve better informed coastal decisions.
Acknowledgements. This research has been partly supported by the RISES-AM project (FP7-ENV-603396), the iCOAST project (ECHO-2013/PREV/09) and the COVARIANCE project (CTM 2010-19709). The second author also acknowledges the PhD schol-arship from the Government of Catalonia (DGR FI-AGAUR-14, Generalitat de Catalunya). The support of the Cartographic Institute of Catalonia in providing the LIDAR data has been essential to evaluate the performance of the models. The support of the Puertos del Estado and XIOM buoy network (providing the driving term observations) is also duly appreciated. We would like to thank two
anonymous reviewers for their valuable comments and suggestions that have improved this paper.
Edited by: G. Boni
Reviewed by: M. Greco and one anonymous referee
References
Alomar, M., Bolaños, R., Sánchez-Arcilla, A., Sairouni, A., and Ocampo-Torres, F.: Uncertainties in wave modeling for fetch-limited growth conditions, in: 33rd IAHR Congress, Hyatt Re-gency Vancouver, 2846–2853, 2009.
Alomar, M., Bolaños, R., Sánchez-Arcilla, A., and Sairouni, A.: Wave growth under variable wind conditions, in: 32rd Interna-tional Conference in Coastal Engineering (2010), 2010. Alomar, M., Sánchez-Arcilla, A., Bolaños, R., and Sairouni, A.:
Wave growth and forecasting in variable, semi-inclosed domains, Continental Shelf Res., 87, 1–6, 2014.
Alsina, J. and Cáceres, I.: Sediment suspension events in the in-ner surf and swash zone. Measurements in large-scale and high-energy wave conditions, Coastal Eng., 58, 657–670, 2011. Battjes, J. and Janssen, J.: Energy loss and set-up due to breaking
of random waves, in: Proc. 16th Int. Conf. Coastal Engineering, ASCE, 569–587, 1978.
Bentamy, A., Ayina, H.-L., Queffeulou, P., Croize-Fillon, D., and Kerbaol, V.: Improved near real time surface wind resolution over the Mediterranean Sea, Ocean Sci., 3, 259–271, doi:10.5194/os-3-259-2007, 2007.
Bertotti, L. and Cavaleri, L.: The predictability of meteo-oceanographic events, Ocean Dynam., 61, 1391–1402, 2011. Bolaños, R., Jorda, G., Cateura, J., Lopez, J., Puigdefabregas, J.,
Gomez, J., and Espino, M.: The XIOM: 20 years of a regional coastal observatory in the Spanish Catalan coast, J. Marine Syst., 77, 237–260, 2009.
Booij, N., Ris, R., and Holthuijsen, L.: A third-generation wave model for coastal regions, Part I, Model description and valida-tion, J. Geophys. Res., 104, 7649–7666, 1999.
Cavaleri, L., Bertotti, L., Buizza, R., Buzzi, A., Masato, V., Umgiesser, G., and Zampieri, M.: Predictability of extreme meteo-oceanographic events in the Adriatic Sea, Q. J. Roy. Me-teorol. Soc., 136, 400–413, 2010.
Conte, D. and Lionello, P.: Characteristics of large positive and neg-ative surges in the Mediterranean Sea and their attenuation in future climate scenarios, Global Planet. Change, 111, 159–173, 2013.
Eldeberky, Y.: Nonlinear transformation of wave spectra in the nearshore zone, Ph.D. thesis, Delft University of Technology, 1996.
Gràcia, V., Alvarado-Aguilar, D., Hernández, M., and Sánchez-Arcilla, A.: Coastal flooding assessment using numerical mod-eling, in: Comprehensive Flood Risk Management, edited by: Klijn, F. and Schweckendiek, T., Taylor and Francis Group, 2013a.
Hasselmann, K., Barnett, T., Bouws, E., Carlson, H., Cartwright, D., Enke, K., Ewing, J., Gienapp, H., Hasselmann, D., Kruseman, P., Meerburg, A., Müller, P., Olbers, D., Richter, K., Seññ, W., and Walden, H.: Measurements Of Wind-wave Growth And Swell Decay During The Joint North Sea Wave Project (JONSWAP), Dtsch. Hydrogr. Z., A8, 12, 95 pp., 1973.
Hasselmann, S., Hasselmann, K., Allender, J., and Barnett, T.: Com-putations and parametrizations of the nonlinear energy transfer in a gravity wave spectrum. Part II: Parametrizations of the nonlin-ear transfer for application in wave models, J. Phys. Oceanogr., 15, 1378–1391, 1985.
Holt, J., Allen, J., Proctor, R., and Gilbert, F.: Error quantification of a high-resolution coupled hydrodynamic-ecosystem coastal-ocean model: Part 1 Model overview and assessment of the hy-drodynamics, J. Marine Syst., 57, 167–188, 2005.
Janssen, P.: Quasi-linear theory of wind-wave generation applied to wave forecasting, J. Phys. Oceanogr., 21, 1631–1642, 1991. Komen, G., Hasselmann, S., and Hasselmann, K.: On the existence
of a fully developed wind-sea spectrum, J. Phys. Oceanogr., 14, 1271–1285, 1984.
Pallarés, E., Sánchez-Arcilla, A., and Espino, M.: Wave energy bal-ance in wave models (SWAN) for semi-inclosed domains. Ap-plication to the Catalan coast, Continental Shelf Res., 87, 41–53, 2014.
Queffeulou, P.: Long term validation of wave height measurements from altimeters, Mar. Geodesy, 27, 495–510, 2004.
Roelvink, J., Reniers, A., Dongeren, A. V., van Thiel de Vries, J., McCall, R., and Lescinski, J.: Modeling storm impacts on beaches, dunes and barrier islands, Coastal Eng., 56, 1133–1152, doi:10.1016/j.coastaleng.2009.08.006, 2009.
Sánchez-Arcilla, A., González-Marco, D., and Bolaños, R.: A re-view of wave climate and prediction along the Spanish Mediter-ranean coast, Nat. Hazards Earth Syst. Sci., 8, 1217–1228, doi:10.5194/nhess-8-1217-2008, 2008.
Sánchez-Arcilla, A., Cáceres, I., van Rijn, L., and Grüne, J.: Revis-iting mobile bed tests for beach profile dynamics, Coastal Eng., 58, 583–593, 2011a.
Sánchez-Arcilla, A., Mosso, C., Sierra, J., Mestres, M., Harzallah, A., Senouci, M., and Raey, M. E.: Climatic drivers of poten-tial hazards in Mediterranean coasts, Reg. Environ. Change, 11, 617–636, 2011b.
Sánchez-Arcilla, A., Gràcia, V., Solé, J., García, M., and Sairouni, A.: Forecasting beach morphodynamics: The shoreline border as a control for flooding risks, in: Comprehensive Flood Risk Man-agement, edited by: Klijn, F. and Schweckendiek, T., Taylor and Francis Group, 2013.
Stelling, G. and Duinmeijer, S.: A staggered conservative scheme for every Froude number in rapidly varied shallow water flows, Int. J. Numerical Methods Fluid., 43, 1329–1354, 2003. Taylor, K.: Summarizing multiple aspects of model performance in
a single diagram, J. Geophys. Res., 106, 7183–7192, 2001. Tonani, M., Pinardi, N., Fratianni, C., Pistoia, J., Dobricic, S.,
Pensieri, S., de Alfonso, M., and Nittis, K.: Mediterranean Forecasting System: forecast and analysis assessment through skill scores, Ocean Sci., 5, 649–660, doi:10.5194/os-5-649-2009, 2009.
van Rijn, L.: Unified view of sediment transport by current and waves, part I, II , J. Hydraul. Eng., 133, 649–689, 2007a. van Rijn, L.: Unified view of sediment transport by current and
waves, part III and IV, J. Hydraul. Eng., 133, 761–793, 2007b. van Rijn, L. C., Walstra, D. J. R., Grasmeijer, B., Sutherland, J.,
Pan, S., and Sierra, J. P.: The predictability of cross-shore bed evolution of sandy beache at the time scale of storms and seasons using process-based Profile models, Coastal Eng., 47, 295–327, 2003.
van Thiel de Vries, J.: Dune Erosion during Storm Surges, Ph.D. thesis, Technische Universiteit Delft, 2009.