Performance Of The South African
Banking Sector Since 1994
Christopher Ifeacho, University of KwaZulu-Natal, Pietermaritzburg Campus, South Africa Harold Ngalawa, University of KwaZulu-Natal, Westville Campus, South Africa
ABSTRACT
This study investigates the impact of bank-specific variables and selected macroeconomic variables on the South African banking sector for the period 1994-2011 using the capital adequacy, asset quality, management, earnings, and liquidity (CAMEL) model of bank performance evaluation. The study employs data in annual frequency from South Africa’s four largest banks, namely, ABSA, First National Bank, Nedbank, and Standard Bank. These banks account for over 70% of South Africa’s banking assets. Using return on assets (ROA) and return on equity (ROE) as measures of bank performance, the study finds that all bank-specific variables are statistically significant determinants of bank performance. Specifically, the study shows that asset quality, management quality, and liquidity have a positive effect on both measures of bank performance, which is consistent with a priori theoretical expectations. Capital adequacy, however, exhibits a surprising significant negative relationship with ROA, while its relationship with ROE is significant and positive as expected. Except for interest rates (in the ROA model), unemployment rate (in the ROA model), and the rate of inflation (in the ROE model), the rest of the macroeconomic variables are statistically insignificant. The study reveals that bank performance is positively related to interest rates and negatively related to unemployment rates and interest rates.
Keywords: Bank Performance; South Africa; CAMEL
1. INTRODUCTION
n nearly all countries, banks are the largest owner of financial assets (Oladejo & Oladipupo, 2011), which in turn are an important element of firms’ operations in the real sector. Accordingly, the performance of banks tends to have a direct impact on the stability of the economy (Greenberg & Simbanegavi, 2009). In South Africa, the banking sector accounts for more than 20 percent of gross domestic product (GDP), and is the third largest employer, accounting for over 10 percent of overall employment.1 Clearly, the country’s efforts to reduce unemployment and increase economic growth will be adversely affected if the banking sector performs poorly. It is evident, therefore, that there is a need to understand how the banking sector performs and the determinants of its performance in order to formulate and implement meaningful policies.
Several studies have attempted to measure banking sector performance in many countries (for example, Sangmi & Nazir, 2010; Said & Tumin, 2011). More recent studies have concentrated on Asia and Europe (for example, Clair, 2004; Heffernan & Fu, 2008; Al-Tamimi, 2010; Athanasoglou, Brissimis, & Delis, 2005). There are, nonetheless, some studies that have investigated bank performance in Africa, many of which have focussed on West Africa (Oladele & Sulaimon, 2012) and North Africa (Naceur, 2003).
The few studies that have been conducted on South Africa have focused on branch performance (for example, Okeahalam, 2006; O'Donnell & Van der Westhuizen, 2002; Ncube, 2009). Most of these studies have used the common quantitative methods for assessing relative efficiency, namely the Stochastic Frontier Analysis (SFA) and Data Envelopment Analysis (DEA), which have been criticised for being imprecise and using subjective
1 2010 figures.
judgement (Yang & Chen, 2004). More recently, Kumbirai and Webb (2010) studied commercial bank performance in South Africa using simple descriptive financial ratio analysis, studying the period 2005-2009. This study contributes to the literature by investigating South Africa’s banking performance using an alternative and more reliable approach - the capital adequacy, asset quality, management, earnings, and liquidity (CAMEL) model. No study that we are aware of has measured the performance of South African banks using this approach.
The rest of the paper is organised as follows. Section 2 is a brief overview of the banking industry in South Africa. A discussion of bank performance is presented in Section 3 followed by an outline of the methodology used for analysis in Section 4 and estimation results in Section 5. A summary and conclusion conclude the paper in Section 6.
2. BANKING IN SOUTH AFRICA: A BRIEF OVERVIEW
The banking sector in South Africa is oligopolistic, highly concentrated and dominated by four major banks (Coppock et al., 2008). These include Amalgamated Banks of South Africa Limited (ABSA), First National Bank (FNB), Standard Bank, and Nedbank. The sector, however, boasts well-developed administrative and credit information systems (Okeahalam, 2001). It is, on the whole, well developed, effectively regulated and backed by a sound legal system (Quiding, 2006). Since 1994, the country has opened up its finance industry, resulting in an increase in the number of banks and consequently a rise in loans and advances. A large number of the new entrants in the industry have been offering a range of new products targeting the formerly unbanked population and lower-income customers, effectively heightening the degree of competition in the sector.
Despite the progress recorded since 1994, there are many challenges confronting the South African banking sector. For instance, the industry’s delivery of services to low-income earners or poor people has been uninspiring. According to the African Development Bank (2012), almost 37 percent of the country’s 33 million adults in 2010 were not accessing bank services and a large part of the country’s informal enterprises had limited access to formal business finance. The entire nature of the banking licence has also been criticised as the main reason for the failure to provide banking services to the poor masses (Maumbe, 2006; Schombree, 2000; Paulson & McAndrews, 2000).
Notwithstanding these and other problems, the South African banking industry has attracted considerable interest from foreign banks, which has resulted in a number of these foreign banks purchasing sizeable stakes in big banks and launching new branches in the country. For example, in 2005 the British Barclays Group acquired and took over ABSA and in October 2007, Standard Bank sold a 20 percent stake to Industrial and Commercial Bank of China (ICBC) in a transaction valued at US$5.5billion. This was China’s largest investment in the banking sector and its biggest single investment in South Africa.
3. BANK PERFORMANCE
Many studies have shown that business cycles significantly affect bank performance (for example Al-Tamimi, 2010; Athanasoglou et al., 2005; Heffernan & Fu, 2008). Since firms’ and households’ ability to service their debt plays an important role in ensuring bank stability, bank performance is expected to follow a pro-cyclical pattern. Supporting this hypothesis, Naceur and Kandil (2009) maintain that factors that adversely affect bank profitability arise from the deterioration of economic activity.
Loans and advances issued by banks also explain the pro-cyclical nature of bank performance. Lending is the core business of banks, and the interest generated from loans is often the largest source of income for commercial banks. Accordingly, interest income from lending is expected to have a positive relationship with banks performance. If, however, these loans, which constitute debt on the part of the borrower, are not paid back when due or if the debts are not adequately serviced, bank performance may be adversely affected.
Different statistical techniques have been used in the analysis of bank performance. The traditional approach for bank performance evaluation is the financial ratios analysis. However, there is no combination of financial ratios for a complete and satisfactory evaluation of bank operations efficiency. In consequence, financial ratio analyses are complemented with different bank quality evaluations such as equity structure and management quality.
The existing literature on the determinants of bank performance has concentrated on examining either single countries or a panel of countries. Several studies have found that bank sector performance is influenced by the cost to income ratio, operating expenses, and ratio of equity to total assets (Oladele & Sulaimon, 2012; Ivey, Gropper, & Rutherford, 2005; Said & Tumin, 2011; Shipho & Olweny, 2011). Among others, these studies have observed that holding the correct quantity of liquid assets, enhancing capital bases, decreasing functional expenses, improving the quality of assets and using diversifying revenue sources increase the profitability of commercial banks.
Bordeleau and Graham (2010) found a nonlinear association between liquidity and profitability in the United States of America (USA) and Canada for the period 1997–2009. They demonstrated that certain liquid assets enhance bank profitability. They further showed that ceteris paribus, there is a certain level beyond which keeping additional liquid assets reduces profitability. The study also found evidence that the correlation between profitability and holding liquid assets hinges on the business model of the bank, economic conditions, and risks related to financing market complexities. These results are corroborated by Shahchera (2012) and Al-Khouri (2011). However, Said and Tumin (2011) found that liquidity and the magnitude of banks do not have any impact on bank performance in a study of Malaysia and China, in agreement with Shen, Kao, Chen, and Yeh (2009).
The impact of inflation on bank performance has also been studied extensively (Boyd, Levine, & Smith, 2000; Awojobi, Amel, & Norouzi, 2011; Ogege, Williams, & Emerah, 2012; Kosmidou, 2008). On the whole, these studies have found a negative relationship between the rate of inflation and bank performance.
4. METHODOLOGY
4.1 The CAMEL Model
Some of the most commonly used methods/models of bank performance measurement or evaluation include the Analytic Hierarchy Process (AHP), Data Envelopment Analysis (DEA), and the capital adequacy, asset quality, management, earnings and liquidity (CAMEL) model. This study uses the CAMEL model of bank performance measurement. The model involves the use of financial ratios in measuring bank performance. Compared to the other models, the CAMEL model is arguably the most popular framework used by regulators for bank performance evaluation (Naceur, 2003; Heffernan & Fu, 2008; Sufian & Habibullah, 2010; Al-Tamimi, 2010; Khrawish, 2011; Kouser & Saba, 2012). Apart from being the most used method for evaluating bank performance, the CAMEL is also a contemporary model of financial analysis and the most recent innovation in the financial performance evaluation of banks (Sangmi & Nazir, 2010). The model assesses bank performance based on capital adequacy, asset quality, management competency and soundness, earnings and liquidity. The likelihood of bank failure is increased if any of these factors show signs of inadequacy. Financial ratios such as return on assets (ROA), return on equity (ROE), and net interest margin (NIM) form part of the financial ratios that the CAMEL model uses.
It is important to mention that the complexity of both the AHP and DEA method of performance evaluation places the CAMEL model at the very pole position as a model of choice for evaluating bank performance. The CAMEL model derives its strength from its simplicity. Different financial ratios are selected as proxies for the five dimensions of the CAMEL.
4.1.1 Capital Adequacy
4.1.2 Asset Quality
An important parameter that can be used to gauge the strength of a bank or its performance is the quality of the bank’s assets. The main reason for measuring asset quality is to find out the component of non-performing assets as a percentage of total assets. Some of the ratios used to measure asset quality include total investments to total assets, asset to capital employed, and net non-performing assets to total assets. This study adopts asset to capital employed as a proxy for asset quality. Capital employed is the value of a company’s assets that contributes to its ability to generate revenue. Thus, asset to capital employed refers to the value of all assets (fixed as well as working capital) employed in a business.
4.1.3 Management Quality or Management Capability
This parameter measures or evaluates the capability of the management of a bank to aggressively deploy its resources and utilize the facilities in the bank productively and in the process reduce costs and maximize income (Purohit & Mazumdar, 2003). Amongst the five CAMEL variables, the measurement of management quality is apparently the most subjective, particularly because it is usually appraised and allocated a score by the bank examination staff (Hays, De Lurgio, & Gilbert, 2009). In other words, management capability is a qualitative measure and can only be understood and quantified by subjective evaluation of management control mechanisms or organizational culture (Sangmi & Nazir, 2010, p. 46). Management capability can also be measured using other ratios such as earning per employee, operating profit per employee, expenditure per employee and average number of active borrowers per credit officer. This study adopts operating profit per employee as a proxy for this parameter.
4.1.4 Earnings
This is perhaps the most conventional approach for measuring financial or bank performance. Cole and Gunther (1998) argue that higher income generally reflects relatively less financial difficulties and may consequently be associated with a relatively lower likelihood of bank failure. This, however, does not hold all the time. High income may also be associated with relatively high-risk behaviour, which exposes the bank to a greater probability of failure. A case in point is the 2007/2008 financial crisis, which has been associated with high-risk behaviour reflecting moral hazard on the part of financial institutions. Earnings of a bank can be evaluated using financial ratios such as return on assets and return on equity (both being profitability ratios), net interest margin, interest income to total income, and spread ratio. This study uses return on assets (ROA) and return on equity (ROE) as measures of earnings and hence bank performance. Accordingly, we use ROA and ROE as endogenous variables regressed on vectors of bank specific factors (the remaining financial ratios of the CAMEL) and selected macroeconomic variables.
4.1.5 Liquidity
The liquidity of a bank reflects the swiftness with which the bank responds to unexpected demand for cash. Therefore, for a bank to easily provide liquidity, it must have a highly liquid and readily transferable stock of financial assets. Liquidity means financial assets must be available to owners within a short space of time (Sangmi & Nazir, 2010). Liquidity ratios include current ratio (current asset/current liabilities), quick ratio (current assets-inventories/current liabilities), liquid assets to deposits, and liquid assets to total assets. The quick ratio is used as a proxy for liquidity in this study.
4.2 Macroeconomic Variables
In addition to the bank-specific variables, this study uses some macroeconomic variables to control for the impact of macroeconomic factors. The macroeconomic variables used in this study include inflation rates, real interest rates, GDP, and unemployment rates.
4.2.1 Inflation Rate
inflation and financial sector performance. Azariadis and Smith (1996) and Boyd and Smith (1998), among others, have shown that it is only when inflation exceeds a certain “critical” rate (threshold) that credit market frictions become binding. Effectively, inflation may have recurrent positive and negative effects. That is, at low levels of inflation, credit market frictions may be “nonbinding” and there will be no impact on financial sector performance. However, once the rate of inflation surpasses this threshold, credit market frictions become binding, which results in intensive credit rationing ultimately leading to a decline in financial sector performance.
4.2.2 Gross Domestic Product
Demirguc-Kunt and Huizinga (1999) have shown that an increase in bank profitability in a large number of countries has been precipitated by rapid economic growth, which is measured by real GDP growth. Accordingly, business cycles are expected to have direct effects on the performance of banks. As argued by Mendes and Abreu (2003), bank performance is expected to be pro-cyclical because adverse macroeconomic conditions hurt banks by increasing the share of non-performing loans in the economy. Supporting the hypothesis, Heffernan and Fu (2008) maintain that greater demand for bank services brought about by an economic upswing is associated with a lower risk of loan defaults. Conversely, declining economic growth is likely to weaken the capacity of borrowers to service their debts, thus increasing credit risk.
4.2.3 Interest Rate
According to Mendes and Abreu (2003), real interest rates capture banks’ general costs of funds. Increasing interest rates, therefore, lead to high non-performing loans and consequently poor bank performance. If the rate of GDP growth is low, high interest rates are usually associated with financial stress and a decline in bank performance. Clair (2004) states that though high real interest rates may lead to banks’ increased income, they may also lead to banks’ fragility and instability. Diamond (1991) explains that mostly, companies’ choices between projects that are considered risky and safe are influenced by the real interest rate thereby affecting their financial performance as well as fragility. With a real interest rate that is rising, adoption of risky investment projects is predictable and this will increase the level of counterparty default, which ultimately undermines the stability of banks. Theoretically, there is a negative relationship between bank performance and interest rates.
4.2.4 Unemployment
On the whole, a positive growth in real GDP is accompanied by an increase in employment. Growing unemployment, in turn, leads to a reduction in aggregate demand, which further results in an increase in the loan default rate of borrowers, ultimately reducing bank profitability (Heffernan & Fu, 2008; Mendes & Abreu, 2003). Consequently, bank performance declines. An empirical result by Abreu and Mendes (2002) shows that the rate of unemployment is negatively related to net interest margin, return on average assets (ROAA), and return on average equity (ROAE), which are all measures of bank performance.
4.3 Data, Data Sources, and Sample
Data for financial ratios were collected from the annual financial ratios report of South Africa’s four biggest banks, as recorded by McGregor BFA covering the period 1994 to 2011 in annual frequency. In South Africa, the four largest banks, ABSA, First National Bank, Nedbank, and Standard Bank, to a large extent represent the banking sector in South Africa. The four banks collectively account for an estimated 72% of South Africa’s banking assets (Schoombee, 2000). Data for the macroeconomic variables or external factors (GDP, inflation rates, real interest rates, and unemployment rates) were obtained from World Development Indicators online, a World Bank database of social and economic indicators.
4.4 Model and Estimation Method/Technique
performance are used in this study, namely, return on assets (ROA) and return on equity (ROE), while the independent variables are divided into two categories: the bank-specific variables and macroeconomic determinants of bank performance. The estimating equation is given by:
(1)
where is a bank performance indicator, namely, ROA and ROE; and are vectors of bank-specific and macroeconomic explanatory variables, respectively, and is a stochastic term. According to Gujarati (2007), if T, which is the number of time series data, is large and the number of cross-sectional units is smaller, the fixed effects model is more appropriate compared to the random effects approach. Since our data are from 1994 to 2011 (18 years) and the number of banks under consideration is only 5, this study adopts the fixed effect model.
After estimation of the fixed effects model, a comparison of the ROA and ROE results is carried out. Thereafter, we attempt to ascertain whether the banks’ individual specific effects have influence on their individual performances. This is carried out using the least-squares dummy variable (LSDV) approach of the fixed effects model. In this case, the intercept is permitted to vary across individual banks whereas slope coefficients remain constant. Hsiao (2003) argues that the LSDV model offers a sound way to comprehend fixed effects and it recognizes the different intercepts. Moreover, this is an additional method of computing the within estimators, particularly if the quantity of observations is not large. In the present study, the LSDV technique enables the calculation of statistically distinctive intercept values for every bank. These differences reveal the unique characteristics of the banks which differentiate each bank from other banks.
Finally, we re-estimate the model using the Generalised Method of Moments (GMM) and System-GMM as a robustness check on our results. According to Arellano and Bond (1991), fixed effects LSDV might be inefficient, which necessitates the exploitation of orthogonality conditions that exist between the lagged values of the dependent variable and the disturbance term through the use of an additional instrument in the model. In panel data analysis, it is generally accepted that the GMM is superior to the other estimation techniques outlined in the foregoing discussion. Recent studies on bank profitability have employed the GMM methods to overcome problems associated with pooled OLS techniques. The GMM approaches have no assumptions regarding data distribution compared to OLS. It has also been argued that the GMM estimator captures the endogeneity of regressors and accounts for heteroscedasticity and serial correlation in residual terms (Wintoki, Linck, & Netter, 2009).
Recent studies reveal that for first-differenced GMM provisions, lagging regressors continually over a number of times leads to weak instruments (Han & Phillips, 2010; Arellano & Honore, 2001; Moral-Benito, 2012). As a result, the GMM estimator will tend to be somewhat biased. The solution is System-GMM estimation. The System-GMM originates from estimating two simultaneous equations, one of them with a lagged first difference variable as an instrument and the other one with a lagged level as an instrument. This method is associated with efficiency gains and valid instruments. It has been argued that the GMM estimator has the ability to choose parameter estimates which will reduce the association between the instrument and the disturbance term to zero (Wooldridge, 2001; Kripfganz & Schwarz, 2012; Bontempi & Mammi, 2012).
5. ESTIMATION RESULTS
an enviable non-interest revenue mix and are operating at favourable efficiency ratios, with the result that they are highly profitable, well capitalised, and have good returns on equity.
With the exception of interest rates (in the ROA equation), unemployment rate (in the ROA equation), and the rate of inflation (in the ROE equation), the rest of the macroeconomic variables are statistically insignificant. The positive relationship between interest rates and bank performance is inconsistent with a priori theoretical expectations. This relationship is probably indicative of the highly concentrated banking sector in South Africa. With high interest rates, lack of competitiveness in the banking sector forces bank clients to pay disproportionately high interest rates and fees to cover for the increase in interest rates as well as any expected decline in lending that may arise due to the increase in the cost of funds. Since there is no corresponding increase in the cost of doing business (an obvious exception being an increase in the cost of mobilising deposits), bank performance tends to improve.
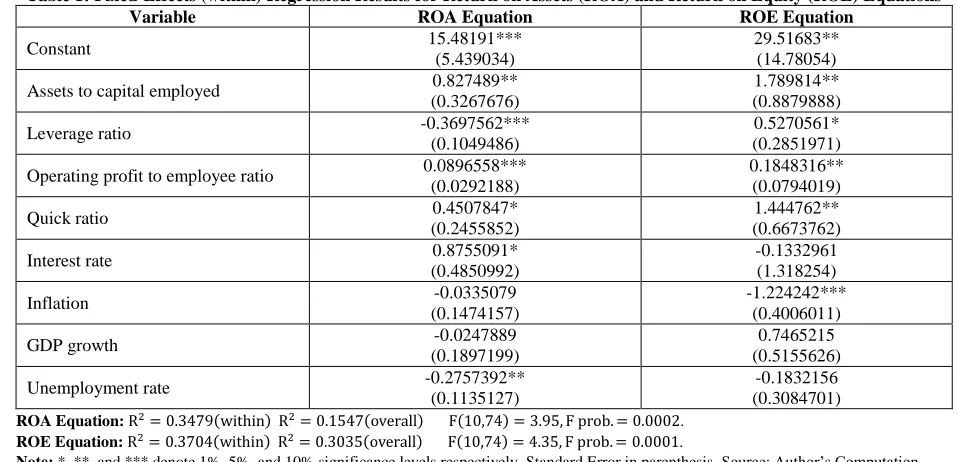
Table 1: Fixed-Effects (within) Regression Results for Return on Assets (ROA) and Return on Equity (ROE) Equations
Variable ROA Equation ROE Equation
Constant 15.48191***
(5.439034)
29.51683** (14.78054)
Assets to capital employed 0.827489** (0.3267676)
1.789814** (0.8879888)
Leverage ratio -0.3697562***
(0.1049486)
0.5270561* (0.2851971)
Operating profit to employee ratio 0.0896558*** (0.0292188)
0.1848316** (0.0794019)
Quick ratio 0.4507847*
(0.2455852)
1.444762** (0.6673762)
Interest rate 0.8755091*
(0.4850992)
-0.1332961 (1.318254)
Inflation -0.0335079
(0.1474157)
-1.224242*** (0.4006011)
GDP growth -0.0247889
(0.1897199)
0.7465215 (0.5155626)
Unemployment rate -0.2757392**
(0.1135127)
-0.1832156 (0.3084701) ROA Equation: .
ROE Equation: .
Note: *, **, and *** denote 1%, 5%, and 10% significance levels respectively. Standard Error in parenthesis. Source: Author’s Computation
The statistically significant negative impact of the unemployment rate on the return on assets is an indication that increasing unemployment rates lead to poor bank performance (measured by ROA in this case). Unemployment is one of the major economic problems in South Africa and around the world, especially because it causes loss of production, loss of income, and loss of human capital (skill decay), which adversely affects economic growth. Since one of the primary roles of banks is financial intermediation (borrowing from surplus units and lending to deficit units), it is expected that high levels of unemployment will result in a reduction in the surplus units following the loss in employment and production, effectively hampering the intermediation role of banks.
The insignificance of inflation rate (ROA equation), interest rates (ROE equation), GDP growth (both ROA and ROE equations), and unemployment rate (ROE equation) is inconsistent with a number of studies carried out in emerging and developed economies, such as, Hong Kong, Malaysia, Singapore, and Australia, where it has been found that macroeconomic variables exert a strong influence on bank performance (Gerlach, Peng, & Shu, 2004; Ghazali, 2008; Clair, 2004; Gizycki, 2001). Our findings, nonetheless, are not uncommon. Alper and Anbar (2011) and Ayadi and Boujelbene (2012) have found similar results in studies of Turkey and Tunisia, respectively.
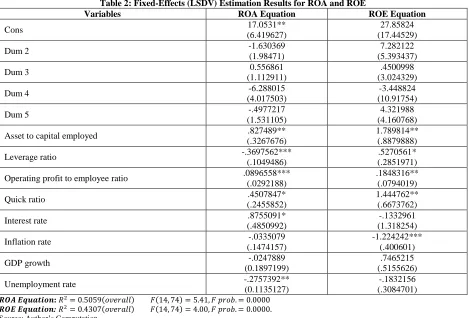
Table 2: Fixed-Effects (LSDV) Estimation Results for ROA and ROE
Variables ROA Equation ROE Equation
Cons 17.0531**
(6.419627)
27.85824 (17.44529)
Dum 2 -1.630369
(1.98471)
7.282122 (5.393437)
Dum 3 0.556861
(1.112911)
.4500998 (3.024329)
Dum 4 -6.288015
(4.017503)
-3.448824 (10.91754)
Dum 5 -.4977217
(1.531105)
4.321988 (4.160768)
Asset to capital employed .827489**
(.3267676)
1.789814** (.8879888)
Leverage ratio -.3697562***
(.1049486)
.5270561* (.2851971)
Operating profit to employee ratio .0896558*** (.0292188)
.1848316** (.0794019)
Quick ratio .4507847*
(.2455852)
1.444762** (.6673762)
Interest rate .8755091*
(.4850992)
-.1332961 (1.318254)
Inflation rate -.0335079
(.1474157)
-1.224242*** (.400601)
GDP growth -.0247889
(0.1897199)
.7465215 (.5155626)
Unemployment rate -.2757392**
(0.1135127)
-.1832156 (.3084701)
:
:
Source: Author’s Computation
Again, the bias of inconsistent estimators reduces when T is greater than N in the LSDV model. The dummies represent the individual intercepts of the four banks. The LSDV estimation results in Table 2 do not show any significant differences with the fixed effects ‘within’ regression results in Table 1. All parameter estimates of the explanatory variables show virtually the same relationship in terms of sign and statistical significance for both ROA and ROE equations. In the group of bank-specific variables, asset quality (assets to capital employed ratio), management quality (operating profits per employee ratio) and liquidity (quick ratio) have a positive relationship with both measures of bank performance while the leverage ratio (a measure of capital adequacy) shows a negative relationship with ROA and a positive relationship with ROE. Among the macroeconomic variables, interest rates have a positive relationship with ROA, the rate of inflation has a negative relationship with ROE, and the rate of unemployment has a negative relationship with ROA. The rest of the macroeconomic variables are statistically insignificant. Most interestingly, Table 2 shows that none of the dummy variables is statistically significant, indicating that the banks do not exhibit any significant specific effects. The implication of this finding is that the same pattern of behaviour between the explanatory variables and the dependent variable can be generalised among the four banks.
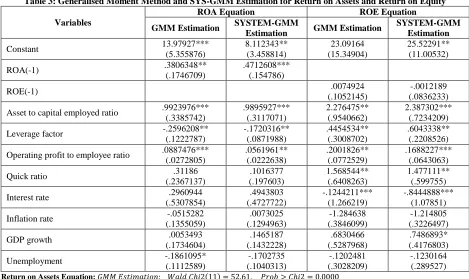
Table 3: Generalised Moment Method and SYS-GMM Estimation for Return on Assets and Return on Equity
Variables
ROA Equation ROE Equation
GMM Estimation SYSTEM-GMM
Estimation GMM Estimation
SYSTEM-GMM Estimation
Constant 13.97927***
(5.355876) 8.112343** (3.458814) 23.09164 (15.34904) 25.52291** (11.00532)
ROA(-1) .3806348**
(.1746709)
.4712608*** (.154786)
ROE(-1) .0074924
(.1052145)
-.0012189 (.0836233)
Asset to capital employed ratio .9923976*** (.3385742) .9895927*** (.3117071) 2.276475** (.9540662) 2.387302*** (.7234209)
Leverage factor -.2596208**
(.1222787) -.1720316** (.0871988) .4454534** (.3008702) .6043338** (.2208526)
Operating profit to employee ratio .0887476*** (.0272805) .0561961** (.0222638) .2001826** (.0772529) .1688227*** (.0643063)
Quick ratio .31186
(.2367137) .1016377 (.197603) 1.568544** (.6408263) 1.477111** (.599755)
Interest rate .2960944
(.5307854) .4943803 (.4727722) -.1244211*** (1.266219) -.8444888*** (1.07851)
Inflation rate -.0515282
(.1355059) .0073025 (.1294963) -1.284638 (.3846099) -1.214805 (.3226497)
GDP growth .0053493
(.1734604) .1465187 (.1432228) .6830466 (.5287968) .7486893* (.4176803)
Unemployment -.1861095*
(.1112589) -.1702735 (.1040313) -.1202481 (.3028209) -.1230164 (.289527) Return on Assets Equation:
Return on Equity Equation:
Source: Author’s Computation
6. SUMMARY AND CONCLUSION
Due to the intangible nature of banking products and services, it is not easy to effectively measure the efficiency of banks and their performance in general. This has, to a large extent, necessitated the use of different methods and models (statistical tools and financial ratios) in the measurement of bank performance. Amongst the most commonly used methods/models of bank performance measurement or evaluation, are the AHP and DEA. This study adopts an alternative measure of bank performance, the CAMEL model, which involves the use of financial ratios in measuring bank performance. The model combines bank-specific variables with macroeconomic (external) variables in the measurement of bank performance in South African. This is consistent with the literature that maintains that factors that influence bank performance and financial stability emanate from bank-specific factors and macro-environmental factors (Al-Tamimi, 2010; Athanasoglou et al., 2005). We carry out our estimations using four different approaches, namely, fixed effects (within) regression, LSDV model, GMM, and SYSTEM-GMM. All these approaches show consistent results.
insignificant in both the GMM and SYSTEM-GMM equations; and the rate of unemployment (which is insignificant in the ROA equation, only in the GMM estimation), interest rates (which is insignificant in the ROE equation for both GMM and SYSTEM-GMM estimations), and growth of gross domestic product (which is insignificant in the ROE equation, only in the SYSTEM-GMM estimations).
AUTHOR INFORMATION
Christopher Ikechukwu Ifeacho holds a Masters degree from the University of Kwa-Zulu Natal, South Africa. He is also a Denis Hurley Scholar at the same University. He is currently an Academic Development Officer for Economics in the School of Accounting, Economics, and Finance, University of KwaZulu-Natal, South Africa. E-mail: [email protected] and [email protected]
Harold Ngalawa is a Lecturer of Economics at the University of KwaZulu-Natal in Durban, South Africa. He has also taught at the University of Malawi. Before joining the academia, Harold worked as a bank economist at Commercial Bank of Malawi Limited (now trading as Standard Bank Malawi) and later as head of research at Continental Discount House Limited in Malawi. He holds a doctoral degree from the University of Cape Town. E-mail: [email protected] and [email protected]
REFERENCES
1. Abreu, M., & Mendes, V. (2002). Commercial bank interest margins and profitability: Evidence from EU countries (Porto Working Paper Series No: 122).
2. African Development Bank (2012). Country outlook. South Africa. Retrieved 26 August 2012 from http://www.afdb.org/en/countries/southern-africa/south-africa/
3. Al-Khouri, R. (2011). Assessing the risk and performance of the GCC banking sector. International Research Journal of Finance and Economics, 65, 72. Retrieved 11 August 2012 from
http://www.eurojournals.com/finance.htm
4. Al-Tamimi, H. (2010). Factors influencing performance of the UAE Islamic and conventional national banks. Global Journal of Business Research, 4(2), 1-9. Retrieved on 24 April 2012 from
http://papers.ssrn.com/sol3/papers.cfm?abstract_id=1633110
5. Alper, D., & Anbar, A. (2011). Bank specific and macroeconomic determinants of commercial bank profitability: Empirical evidence from Turkey. Business and Economics Research Journal, 2(2), 139-152. 6. Arellano, M., & Bond, S. (1991). Some tests of specification for panel data: Monte Carlo evidence and an
application to employment equations. Review of Economic Studies,58(2), 277-297.
7. Arellano, M., & Honore, B. (2001). Panel data models: Some recent developments. In J. J. Heckman & E. Learner (Eds.), Handbook of econometrics (vol. 5, pp. 3231-3296). Elsevier Science. Retrieved on 23 October 2012 from http://www.uio.no/studier/emner/sv/oekonomi/ECON5120/h07/undervisningsmateriale/ HECT53.pdf
8. Athanasoglou, P., Brissimis, S., & Delis, M. (2005). Bank-specific, industry-specific and macroeconomic determinants of bank profitability (Working Paper No. 25).Bank of Greece. Retrieved 14 April 2012 from http://econpapers.repec.org/paper/bogwpaper/25.htm
9. Awojobi, O., Amel, R., & Norouzi, S. (2011). Analysing risk management in banks: Evidence of bank efficiency and macroeconomic impact. Retrieved 12 August 2012 from http://mpra.ub.uni-muenchen.de/ 33590/1/tola_riskmgt.pdfc
10. Ayadi, N., & Boujelbene, Y. (2012). The determinants of the profitability of the Tunisian deposit banks. IBIMA Business Review. Retrieved 16 November 2012 from http://www.ibimapublishing.com/
journals/IBIMABR/ibimabr.html
11. Azariadis, C., & Smith, B. (1996). Private information, money, and growth: Indeterminacy, fluctuations, and the Mundell-Tobin Effect. Journal of Economic Growth,1, 309-332.
12. South African Reserve Bank. (2004). Financial stability review, March 2004. Retrieved 14 August 2012 from http://www.info.gov.za/view/DownloadFileAction?id=70152
14. Boyd, J., Levine, R., & Smith, B. (2001). The impact of inflation on financial sector performance.Journal of Monetary Economics,47(2), 221-248. Retrieved on 17 June 2012 from http://www.sciencedirect.com/ science/article/pii/S0304393201000496
15. Boyd, J., & Smith, B. (1998). Capital market imperfections in a monetary growth model. Economic Theory, 11, 241-273.
16. Claessens, S., Demirguc-Kunt, A., & Huizinga, H. (2001). How does foreign bank entry affect domestic banking markets? Journal of Banking and Finance, 25(5), 891-911.
17. Clair, R. (2004). Macroeconomic determinants of the banking financial performance and resilience in Singapore. (No. 38). Monetary Authority of Singapore (MAS) Staff Paper. Retrieved on 12 August 2012 from http://www.mas.gov.sg/en/Monetary-Policy-and-Economics/Education-and-Research/Research/ Economics-Staff-Papers/2004/Determinants.aspx
18. Clarke, G., Cull, R., Peria, M., & Sanchez, S. (2003). Foreign bank entry: Experience, implications for developing economies, and agenda for further research.The World Bank Research Observer,18(1), 25-29. 19. Cole, R., & Gunther, J. (1998). Predicting bank failures: A comparison of on- and off-site monitoring
systems. Journal of Financial Services Research, 13(2), 103-117.
20. Cooper, W., Seiford, L., & Zhu, J. (2004). Handbook on data envelopment analysis. Boston: Springer. 21. Coppock, M., Forte, D., Ncube, B., Ooka, E., Richards, K., & Vyas, A. (2008). Basic information about
South Africa. Retrieved on 13 June 2012 from http://fic.wharton.upenn.edu/fic/africa/South%20Africa %20Final.pdf
22. Demirguc-Kunt, A., & Huizinga, H. (1999). Determinants of commercial bank interest margins and profitability: Some international evidence. World Economic Review,13(2), 379-408.
23. Diamond, D. (1991). Monitoring and reputation: The choice between bank loans and directly placed debt. Journal of Political Economy, 44(4), 689-271.
24. Fare, R., Grosskopf, G. Kirkley, J., & Squires, D. (2000). Proceedings from IIFET 2000: Data envelopment analysis (DEA): A framework for assessing capacity in fisheries when data are limited.
25. Gerlach, S., Peng, W., & Shu, C. (2004). Macroeconomic conditions and banking performance in Hong Kong SAR: A panel data study. Journal of Banking and Finance,17(4), 481.
26. Ghazali, M. (2008). The bank-specific and macroeconomic determinants of Islamic bank profitability: Some international evidence. (Unpublished Master’s dissertation). Graduate School of Business, Faculty of Business and Accountancy, University of Malaysia.
27. Gizycki, M. (2001). The effect of macroeconomic conditions on banks’ risk and profitability (Research Discussion Paper No. 2001-06). System Stability Department, Reserve Bank of Australia.
28. Greenberg, J., & Simbanegavi, W. (2009). Testing for competition in the South African banking sector. Retrieved on 12 July 2012 from http://www.commerce.uct.ac.za/economics/seminars/2009/20091106%20 Simbanegavi%20Measuring%20competition%20in%20Banking%20sector.pdf
29. Gujarati, D. (2007). Basic econometrics (6th ed.). New York: McGraw-Hill.
30. Han, C., & Phillips, P. (2010). GMM estimation for dynamic panels with fixed effects and strong instruments at unity. Journal of Econometric Theory, 26(1), 119-151.
31. Hays, F., De Lurgio, S., & Gilbert Jr., A. (2009). Efficiency ratios and community bank performance. Journal of Finance and Accountancy,1, 1-15.
32. Heffernan, S., & Fu, M. (2008). The determinants of bank performance in China. Retrieved on 13 March 2012 from http://www.cass.city.ac.uk/__data/assets/pdf_file/0009/77823/China-BkPerformance-Final-4July-08.pdf
33. Ivey, J., Gropper, D., & Rutherford, M. (2005). Bank capital, performance and regulation: Some international evidence. Retrieved on 16 August 2012 from http://businessperspectives.org/ journals_free/imfi/2005/imfi_en_2005_04_ivey.pdf
34. Khrawish, H. (2011). Determinants of commercial banks performance: Evidence from Jordan. International Research Journal of Finance and Economics, 81. Retrieved on 14 June 2012 from http://www.internationalresearchjournaloffinanceandeconomics.com
35. Kosmidou, K. (2008). The determinants of banks’ profits in Greece during the period of EU financial integration. Managerial Finance, 34(3), 146-159.
37. Kouser, R., & Saba, I. (2012). Gauging the financial performance of the banking sector using CAMEL model: Comparison of conventional, mixed and pure Islamic banks in Pakistan. International Research Journal of Finance and Economics, 82. Retrieved on 17 July 2012 from
http://www.internationalresearchjournaloffinanceandeconomics.com
38. Kripfganz, S., & Schwarz, C. (2012). Estimation of linear dynamic panel data models with time-invariant regressors. Retrieved on 6 December 2012 from http://www.eea-esem.com/papers/EEA-ESEM/2012/ 2330/Kripfganz_Schwarz_20121204.pdf
39. Kumbirai, M., & Webb, R. (2010). A financial ratio analysis of commercial bank performance in South Africa. African Review of Economics and Finance, 2(1). Retrieved on 22 August 2012 from http://african-review.com
40. Maumbe, B. (2006). Digital financial service delivery to poor communities in South Africa: A preliminary assessment. International Review of Business Research Papers,2(2), 72-79.
41. Marcus, G. (2013, March). The economic and financial outlook for the South African Economy. Address at the workshop, The Outlook for Financial Markets, for their Governance and for Finance, Cernobbio, Italy. Retrieved on 8 August 2013, from http://www.ids.ac.uk/files/dmfile/SOUTHAFRICADonRoss.pdf 42. Mendes, V., & Abreu, M. (2003). Do macro-financial variables matter for European bank interest margin
and profitability? 2nd CIEF Workshop, European Integration and Bank Efficiency.
43. Naceur, S. (2003). The determinants of the Tunisian banking industry profitability: Panel evidence. Retrieved on 14 July 2012 from http://www.mafhoum.com/press6/174E11.pdf
44. Naceur, S., & Kandil, M. (2009). The impact of capital requirements on banks’ cost of intermediation and performance: The case of Egypt. Journal of Economics and Business, 61, 70-89.
45. Ncube, M. (2009, July). Efficiency of the banking sector in South Africa. Paper presented at the African Economic Conference, Johannesburg. Retrieved on 21 July 2012 from http://www.afdb.org/en/aec/past-aecs/aec-2009/papers/efficiency-of-the-banking-sector-and-economic-growth-in-south-africa/
46. O'Donnell, C., & Van der Westhuizen, G. (2002). Regional comparisons of banking performance in South Africa. South African Journal of Economics, 70(3), 224-240.
47. Ogege, S., Williams, H., & Emerah, A. (2012). An empirical analysis of capital adequacy in the banking sub-sector of the Nigeria economy. International Journal of Economics and Finance, 4(5), 208
48. Okeahalam, C. (2002). Structure and conduct in the commercial banking sector of South Africa. Paper presented at the Trade and Industrial Policy (TIPS) 2001 Annual Forum, Johannesburg.Retrieved on 14 June 2012 from http://www.tips.org.za/files/499.pdf
49. Okeahalam, C. (2006). Production efficiency in the South African banking sector: A stochastic analysis. International Review of Applied Economics, 20(1), 103-123.
50. Oladele, P., & Sulaimon, A. (2012). Determinants of bank performance in Nigeria. InternationalJournal of Business and Management Tomorrow, 2(2).
51. Oladejo, M., & Oladipupo, A. (2011). Capital regulation and the performance of the Nigerian banks: Need for review. Journal of Emerging Trends in Economics and Management Sciences (JETEMS),2(3), 215-224.
52. Paulson, J., & McAndrews, J. (2000).Financial services for the urban poor: South Africa’s E Plan. Retrieved on 3 December 2012 from http://www-wds.worldbank.org
53. Purohit, K., & Mazumdar, B. (2003). Post mortem of financial performance and prediction of future earning capability of a bank: An application of CAMEL rating and balanced scorecard. Indian Journal of Accounting, 34(1), 8-16.
54. Quiding, C. (2006). The cost-benefit of regulation in South African banking. (Unpublished Master’s dissertation). University of Pretoria, Pretoria. Retrieved on 14 August 2012 from http://upetd.up.ac.za/ thesis/available/etd-03312010-145049/unrestricted/dissertation.pdf
55. Said, R., & Tumin, M. (2011). Performance and financial ratios of commercial banks in Malaysia and China. International Review of Business Research Papers, 7(2), 157-169.
56. Saidov, E. (2009). Factors affecting the performance of foreign banks in Malaysia. (Unpublished Master’s dissertation). University of Malaysia. Kuala Lumpur. Retrieved on 12 July 2012 from
http://etd.uum.edu.my/1760/
58. Schoombee, A. (2000, November). Banking for the poor: The successes and failures of South African banks. Paper presented at the DEVNET conference on Poverty, Prosperity and Progress, Victoria University of Wellington, Wellington, New Zealand. Retrieved on 4 September 2012 from http://www.microfinancegateway.org/gm/document-1.9.24856/13969_13969.pdf
59. Senbet, L., & Otchere, I. (2005, January). Financial sector reforms in Africa: Perspectives on issues and policies. Paper presented at the Annual World Bank Conference on Development Economics (ABCDE), Dakar, Senegal. Retrieved on 13 June 2012 from http://siteresources.worldbank.org/
INTABCDEWASHINGTON2005/Resources/LemmaSenbet-final.pdf
60. Shahchera, M. (2012). The impact of liquidity assets on Iranian bank profitability. Paper presented at the International Conference on Management, Behavioural Sciences and Economics Issues. (ICMBSE'2012) Penang, Malaysia. Retrieved on 13 August 2012 from http://psrcentre.org/images/extraimages/212061.pdf 61. Shipho, T., & Olweny, T. (2011). Effects of banking sectoral factors on the profitability of commercial
banks in Kenya. Economics and Finance Review,1(5), 1-30. Retrieved on 13 August 2012 from http://www.businessjournalz.org/efr
62. Shen, C., Kao, L., Chen, Y., & Yeh, C. (2009). Bank liquidity risk and performance: A cross-country analysis. Retrieved on 16 August 2012 from http://www.finance.nsysu.edu.tw/SFM/17thSFM/program/ FullPaper/083-231345511.pdf
63. Sufian, F., & Habibullah, M. (2010). Does economic freedom foster banks’ performance? Panel evidence from Malaysia. Journal of Contemporary Accounting & Economics,6, 77-91. Retrieved on 15 July 2012 from http://www.sciencedirect.com/science/article/pii
64. Sullivan, M., & Unite, A. (2003). The effect of foreign entry and ownership structure on the Philippine domestic banking market. Journal of Banking & Finance, 27, 2323-2345.
65. Wintoki, J., Linck, J., & Netter, J. (2009, July). Endogeneity and dynamics of corporate governance. Paper presented at the European Summer Symposium in Financial Markets, Centre for Economic Policy
Research. Retrieved on 9 August 2013 from http://dev3.cepr.org/meets/wkcn/5/5567/papers/ LinckFinal.pdf
66. Wooldridge, J. M. (2001). Applications of generalized method of moments estimation. Journal of Economic Perspectives, 15(4), 87-100.