Vascular Health and Risk Management
Dovepress
O R i g i n A L R e s e A R c H
open access to scientific and medical research
Open Access Full Text Article
central aortic blood pressure, augmentation
index, and reflected wave transit time:
reproducibility and repeatability of data
obtained by oscillometry
Olga A Ageenkova Marina A Purygina
Department of Therapy, Functional and Ultrasound Diagnostics, Postgraduate Training Faculty of smolensk state Medical Academy, smolensk, Russian Federation
correspondence: Olga A Ageenkova Department of Therapy, Ultrasound and Functional Diagnostics, Postgraduate Training Faculty, 28 Krupskoy str, smolensk, Russian Federation 214019 Tel +7 481 255 4208
Fax +7 831 296 1414 email [email protected]
Background: The evidence suggests that arterial stiffness acts as an independent predictor of general as well as cardiovascular mortality, strokes in patients with arterial hypertension, type 2 diabetes mellitus in the elderly, and in the general population. The oscillometric method measures parameters of arterial stiffness by applying special methods of processing oscillograms. This is a study of the reproducibility and repeatability of central aortic systolic blood pressure (SBP), augmentation index, and reflected wave transit time measured by Vasotens® technology.
Methods: Anthropometric and hemodynamic measurements for 90 volunteers were made by
two observers using the 24-hour blood pressure monitoring system, BPLab®, with Vasotens
technology in “office” mode, over a period of two days and always at the same time in the morning. Initialization of the device was performed prior to each measurement cycle for each participant.
Results: Analysis of short-term repeatability and reproducibility data for central aortic systolic blood pressure, reflected wave transit time, and augmentation index did not reveal any statistically significant differences. For observer A, SBP was 0.11 ± 7.53 mmHg and aortic SBP was 0.26 ± 6.11 mmHg; for observer B, SBP was 0.14 ± 8.42 and aortic SBP was 0.2 ± 7.25 mmHg. Short-term reproducibility for the different observers with averaging of both measurements was 0.36 ± 5.69 mmHg for SBP and 0.37 ± 6.7 mmHg for aortic SBP; the next day, repeatability for observer A was 0.52 ± 10.7 mmHg for SBP and 0.73 ± 8.98 mmHg for aortic SBP.
Conclusion: BPLab with Vasotens technology has good reproducibility and repeatability, and can be recommended for clinical vascular risk estimation.
Keywords: arterial stiffness, central aortic blood pressure, augmentation index, reflected wave transit time, reproducibility, repeatability
Introduction
Cardiovascular disease is among the main determinants of mortality in the general population. Thus, identification of risk factors at an early preclinical stage of disease is an important issue in cardiology. Several leading research papers over the past decade have shown that arterial stiffness is an independent predictor of cardiovascular morbidity and mortality in the general population.1–6
Blood vessels are the target organs affected by a number of diseases. Changes in the vessel wall occur with arterial hypertension, diabetes mellitus, chronic renal insufficiency, atherosclerosis, and aging.7 The process of vessel remodeling includes
several stages of functional and morphological changes, resulting in disruption of
Vascular Health and Risk Management downloaded from https://www.dovepress.com/ by 118.70.13.36 on 27-Aug-2020
For personal use only.
Number of times this article has been viewed
This article was published in the following Dove Press journal: Vascular Health and Risk Management
Dovepress
Ageenkova and Purygina
the two main functions of blood vessels, ie, conduction and shock absorption.
The conducting function ensures delivery of an adequate amount of blood to peripheral tissues according to demand. The shock absorbing function enables delivery of a relatively stable blood pressure to peripheral tissues, is based on elasticity of the arteries, and serves to absorb blood pressure fluctuations caused by the heart.
Disruption of the shock-absorbing function is caused by an increase in artery wall stiffness, which results in increased systolic and pulse pressure, decreased diastolic pressure, and acceleration of the reflected wave. As a result, left ventricular afterload increases, myocardial hypertrophy develops, coronary perfusion worsens, and impaired left ventricular diastolic function develops.8 This makes timely diagnosis of
changes in the vessel wall particularly important.9
Today, although we do have some standard techniques that are used widely for estimation of arterial wall stiffness, there are new methods in the research stage.10–14 In this regard,
the oscillometric method is particularly relevant because it allows measurement of parameters of arterial stiffness by using special oscillographic methods.15 The reliability of
a device can be verified by testing the reproducibility and repeatability of results obtained in everyday clinical use by specialists, eg, cardiologists, general practitioners, and endocrinologists. The aim of this study was to investigate the reproducibility and repeatability of blood pressure and arterial stiffness indicators, ie, aortic (central) systolic blood pressure (BP), augmentation index, and reflected wave transit time, as measured using a 24-hour BP monitoring system, ie, BPLab® and Vasotens® technology (Petr Telegin, Nizhny
Novgorod, Russian Federation).
Materials and methods
Ninety volunteers (45 male and 45 female) of mean age 44.5 ± 18.92 years (range 18–79 years) agreed to participate in this open, single-center, observational study, and gave their informed consent to participate. Eleven (12.2%) participants had symptoms of hypotension (systolic BP # 110 mmHg, diastolic BP # 70 mmHg). Thirteen (14.4%) had symptoms of hypertension (systolic BP $ 160 mmHg, diastolic BP $ 100 mmHg). Exclusion criteria were atrial fibrillation, severe cardiac anomalies, heart failure, arrhythmia, presence of an artificial pacemaker, pregnancy, or body mass index .30.
Measurements were taken independently by two observers, with each volunteer in a comfortable position (ambient temperature 22°C–25°C, no sudden noises or other
exciting stimuli), over a period of 2 days. Measurements were taken at the same time in the morning in the recumbent position after 10 minutes of relaxation. Alcohol consumption was prohibited for 24 hours prior to the measurements, along with smoking and caffeinated drinks for 8 hours beforehand, and any medicines affecting the cardiovascular system. Volunteers were permitted to have had breakfast no more than half an hour before testing.
The two study investigators received adequate training by an expert in BP measurement. The devices were initialized before measurement. The monitor was uploaded according to the measuring protocol as per the BPLab software user’s guide. Measurements were performed by pressing the monitor start button. All measurements were carried out using the left arm. Five measurements were taken for each volunteer on day 1: 0A, observer A, adaptive measurement (excluded from the analysis); 1A, observer A, first measurement; 1B, observer B, first measurement; 2A, observer A, second mea-surement; and 2B, observer B, second measurement.
Each measurement included applying and removing the cuff with the exception of measurement 1A, which was not preceded by removal of the cuff. The interval between measurements was 3 minutes. When BP could not be measured (ie, when the device displayed an error signal), the measurement was repeated 1 minute later without removal of the cuff. Measurements for each volunteer were saved in a BPW file (data format used for BPLab devices) using BPLabWin software. On the second day, three measurements were taken for each volunteer at 3-minute intervals, with the first measurement being adaptive, and the second and the third one included in the analysis: 3A, observer A, first measurement on the second day; 4A, observer A, second measurement on the second day; and 5A, observer A, third measurement on the second day. The cuff was not removed between measurements.
Test parameters
Pulse waves were recorded into the memory of the device using a special pneumatic system sensor analyzed by BPLabWin software using built-in Vasotens algorithm. Systolic BP is the peak value of the excess blood pressure in the artery at the moment of ventricular systole. In devices using the oscillometric method, systolic BP and aortic systolic BP are estimated using algorithms applied to analysis of the oscillometric curve and the shape of the pressure pulsation.
Reflected wave transit time is the reciprocal of pulse wave velocity. The estimation method used for this
Vascular Health and Risk Management downloaded from https://www.dovepress.com/ by 118.70.13.36 on 27-Aug-2020
Dovepress Reproducibility and repeatability of arterial stiffness data
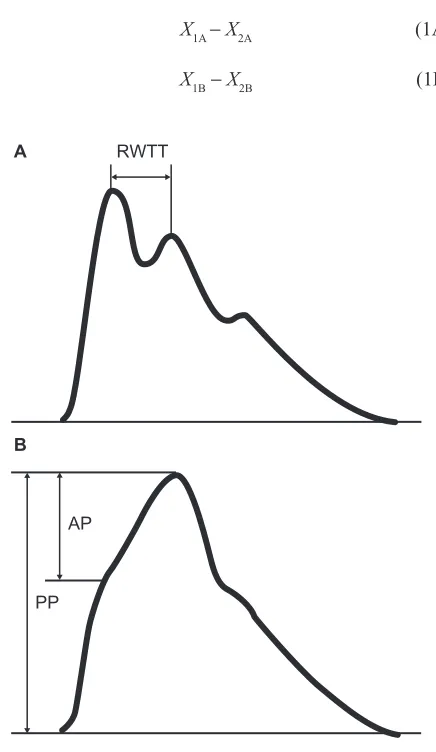
parameter is based on identification of the reflected wave on the pulse curve by the Vasotens algorithm (Figure 1A). This algorithm takes into account the delay of the reflected wave relative to the direct wave (specified in Figure 1A as reflected wave transit time). The transit time of both the direct and the reflected wave is equal to double the length of the aortic trunk.
The aortic augmentation index (aAIx) is defined as the percentage ratio of the pressure increment caused by the reflected wave (AP) to the pulse pressure (PP) in the aorta (Figure 1B):
aAIx = (AP/PP) × 100%
statistical analysis
Analysis of the results was performed using Microsoft Excel. Repeatability of the results obtained by one observer within a short period of time (intraobserver repeatability) was determined by:
X1A − X2A (1A)
X1B−X2B (1B)
Reproducibility of the results obtained by different observers within a short period of time (interobserver repro-ducibility) was determined by:
X1A−X1B, X2A−X2B (2) Reproducibility of the averaged measurements taken by different observers within a short period of time (inter- observer reproducibility) was determined by:
X1A X2A X1B X2B
2 2
+ − + (3)
Averaging of the two measurements taken by each of the observers decreases the impact of physiological variation in the indicators that occurs in each volunteer during the test period. This is done in order to separate the subjective component caused by particular factors of the measurements as taken by a specific observer. The repeatability of the measurements taken on the next day, shows day-to-day variations by the same observer:
X1A−X4A, X2A−X5A (4) Repeatability of the results obtained for different measurements is defined by the statistical features of the variations between the results of the measurements. These were taken on the second day of the study when the subjective component of the margin of error (resulting from the tightness of the cuff) was nullified. Further, in order to estimate the variations between the first (adaptive) measurement and further measurements (known as the “first measurement effect”), the statistical characteristics of the following variations were calculated separately:
X3A−X4A, (5A)
X4A−X5A. (5B)
Statistical characteristics of variations 1–5 for each of the hemodynamic variables were estimated based on the data obtained, ie, average ∆Xdifference values, their standard deviations σ∆X, and variations of differences expressed in
percent values (σ∆X
/
∆X) 100%)⋅ . Bland–Altman plots were constructed for each of the hemodynamic variables. P, 0.05 was considered to be statistically significant.Results
Analyses of short-term repeatability and reproducibility of peripheral and aortic systolic BP, as well as day-to-day
RWTT
AP
PP
A
B
Figure 1 Method of RWTT (A) and aortic augmentation index (B) measurement.
Abbreviations: PP, pulse pressure; AP, reflected wave; RWTT, reflected wave
transit time.
Vascular Health and Risk Management downloaded from https://www.dovepress.com/ by 118.70.13.36 on 27-Aug-2020
Dovepress
Ageenkova and Purygina
data repeatability, did not reveal any statistically significant variations. Peripheral systolic BP variation was found to be 0.11 ± 7.53 mmHg for observer A and −0.14 ± 8.42 mmHg for observer B. Short-term reproducibility by different observers averaged on the basis of two measurements was 0.36 ± 5.69 mmHg. Indicators of short-term repeatability of aortic systolic BP were 0.26 ± 6.11 mmHg for observer A and 0.2 ± 7.25 mmHg for observer B, and the short-term reproducibility for the different observers averaged for the two measurements was 0.37 ± 8.98 mmHg for aortic systolic BP. There were no statistically significant differences in measurements for the study parameters (see Table 1).
Analysis of short-term repeatability and reproduc-ibility as well as reflected wave transit time repeatability and central augmentation index could not be performed on the next day for all volunteers. However, no statistically significant variations were found. Reflected wave transit time repeatability was 2.75 ± 14.98 milliseconds for observer A and 0.75 ± 16.78 milliseconds for observer B; short-term reproducibility for the two different observers averaged on the basis of two measurements was −0.95 ± 8.83 milliseconds. Short-term repeatability indicators for the aortic augmentation index was 2.41% ± 8.12% when measured by observer A and −0.4% ± 7.16% when measured by observer B; short-term reproducibility for the different observers averaged for two measurements was 0.6% ± 4.64%. On the next day, repeatability
was 1.88 ± 18.9 milliseconds for the reflected wave transit time and 1.85% ± 9.1% for aortic augmentation index.
Analysis of Bland–Altman plots based on short-term repeatability of the different observers showed that average variation was negligible in comparison with the dispersion of the variations, most probably caused by physiological variability (Figure 2). Comparison of the plots (and of the parameters outlined in Table 1) showing the results obtained by observers A and B indicates good reproducibility of the results (Figure 3). Dispersion of the variations was similar, indicating no observer effect.
Comparison of the repeatability diagrams for the different observers shows the average of the two measurements and also suggests that physiological variability is the principal reason for the dispersion of results. On averaging of several measurements, dispersion of the variations could be expected to decrease, as shown in the diagrams. For instance, if the dispersion was caused by device error, no decrease would be observed after averaging (Figure 4).
The increase in day-to-day indicators of variation reported in Table 1 and shown in the diagrams also attest to the domination of physiological variability, which shows a clear increase as the interval between the measurements becomes longer (Figure 4).
Studies of the “first (adaptive) measurement effect” show that such an effect is present, albeit not statistically significant.
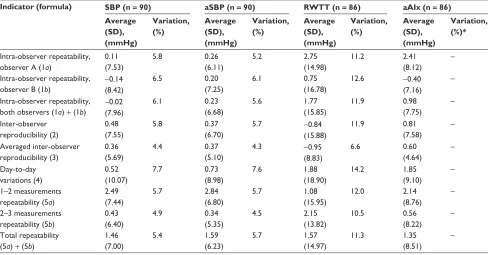
Table 1 Repeatability and reproducibility of the measurements data
Indicator (formula) SBP (n = 90) aSBP (n = 90) RWTT (n = 86) aAIx (n = 86) Average (SD), (mmHg) Variation, (%) Average (SD), (mmHg) Variation, (%) Average (SD), (mmHg) Variation, (%) Average (SD), (mmHg) Variation, (%)* intra-observer repeatability, observer A (1a)
0.11 (7.53) 5.8 0.26 (6.11) 5.2 2.75 (14.98) 11.2 2.41 (8.12) – intra-observer repeatability,
observer B (1b) − 0.14 (8.42) 6.5 0.20 (7.25) 6.1 0.75 (16.78)
12.6 −0.40 (7.16)
– intra-observer repeatability,
both observers (1a) + (1b) − 0.02 (7.96) 6.1 0.23 (6.68) 5.6 1.77 (15.85) 11.9 0.98 (7.75) – inter-observer reproducibility (2) 0.48 (7.55) 5.8 0.37 (6.70)
5.7 −0.84
(15.88) 11.9 0.81 (7.58) – Averaged inter-observer reproducibility (3) 0.36 (5.69) 4.4 0.37 (5.10)
4.3 −0.95
(8.83) 6.6 0.60 (4.64) – Day-to-day variations (4) 0.52 (10.07) 7.7 0.73 (8.98) 7.6 1.88 (18.90) 14.2 1.85 (9.10) – 1–2 measurements
repeatability (5a)
2.49 (7.44) 5.7 2.84 (6.80) 5.7 1.08 (15.95) 12.0 2.14 (8.76) – 2–3 measurements
repeatability (5b)
0.43 (6.40) 4.9 0.34 (5.35) 4.5 2.15 (13.82) 10.5 0.56 (8.22) – Total repeatability
(5a) + (5b)
1.46 (7.00) 5.4 1.59 (6.23) 5.7 1.57 (14.97) 11.3 1.35 (8.51) – Note: *This value has no physical sense for aAix as the averaged value of aAix may reduce to zero.
Abbreviations: SBP, systolic blood pressure; aSBP aortic systolic blood pressure; aAIx, augmentation index; RWTT, reflected wave transit time; SD, standard deviation.
Vascular Health and Risk Management downloaded from https://www.dovepress.com/ by 118.70.13.36 on 27-Aug-2020
Dovepress Reproducibility and repeatability of arterial stiffness data
−50
80 100 120 140
SBP (mmHg)
Intra-observer (A) difference (mmHg) 160 180 200 −40 −30 −20 −10 0 10 20 30 40 50 −50
80 100 120 140
SBP (mmHg)
Intra-observer (A) difference (mmHg)
160 180 200 −40 −30 −20 −10 0 10 20 30 40 50 −50
80 100 120 140
SBP (mmHg)
Intra-observer (A) difference (mmHg)
160 180 200 −40 −30 −20 −10 0 10 20 30 40 50 −50
80 100 120 140
SBP (mmHg)
Intra-observer (A) difference (mmHg)
160 180 200 −40 −30 −20 −10 0 10 20 30 40 50 −50
80 100 120 140
SBP (mmHg)
Intra-observer (A) difference (mmHg)
160 180 200 −40 −30 −20 −10 0 10 20 30 40 50 −50
80 100 120 140
SBP (mmHg)
Intra-observer (A) difference (mmHg)
160 180 200 −40 −30 −20 −10 0 10 20 30 40 50 A B
Figure 2 intraobserver repeatability of sBP (A) and asBP (B) values measured by one and both observers.
Abbreviations: sBP, systolic blood pressure; asBP, aortic systolic blood pressure.
−50
80 100 120 140 SBP (mmHg)
Intra-observer difference (mmHg
)
160 180 200 −40 −30 −20 −10 0 10 20 30 40 50 −50
80 90 100 110 120 130 RWTT (milliseconds)
Intra-observer difference (milliseconds) 140 150 160 170 180 −40 −30 −20 −10 0 10 20 30 40 50 −50
−20 0 20 40
aAIx (%)
Intra-observer difference (%
) 60 80 −40 −30 −20 −10 0 10 20 30 40 50 −50
80 100 120 140 aSBP (mmHg)
Intra-observer difference (mmHg
)
160 180 200 −40 −30 −20 −10 0 10 20 30 40 50
Figure 3 short-term reproducibility of results obtained by two different observers for sBP, asPB, RWTT, and aAix after averaging on the basis of two measurements (averaged interobserver reproducibility).
Abbreviations: RWTT, reflected wave transit time; SBP, systolic blood pressure; aSBP, aortic systolic blood pressure; aAIx, aortic augmentation index.
Vascular Health and Risk Management downloaded from https://www.dovepress.com/ by 118.70.13.36 on 27-Aug-2020
Dovepress
Ageenkova and Purygina
−50
80 90 100 110 120 130 RWTT (milliseconds)
Day-to-day difference (milliseconds)
140 150 160 170 180 −40
−30 −20 −10 0 10 20 30 40 50
−50
−20 0 20 40
aAIx (%)
Day-to-day difference (%
)
60 80 −40
−30 −20 −10 0 10 20 30 40 50 −50
80 100 120 140 aSBP (mmHg)
Day-to-day difference (mmHg
)
160 180 200 −40
−30 −20 −10 0 10 20 30 40 50
−50
80 100 120 140 SBP (mmHg)
Day-to-day difference (mmHg
)
160 180 200 −40
−30 −20 −10 0 10 20 30 40 50
Figure 4 Repeatability of day-to-day sBP, asBP, RWTT, and aAix measurement results (day-to-day variations).
Abbreviations: RWTT, reflected wave transit time; SBP, systolic blood pressure; aSBP, aortic systolic blood pressure; aAIx, aortic augmentation index.
−50
80 100 120 140 SBP (mmHg)
Difference (1st–2nd meas.) (mmHg)
160 180 200 −40
−30 −20 −10 0 10 20 30 40 50
−50
80 100 120 140 aSBP (mmHg)
Difference (1st–2nd meas.) (mmHg
)
160 180 200 −40
−30 −20 −10 0 10 20 30 40 50
−50
80 100 120 140 aSBP (mmHg)
Difference (2nd–3rd meas.) (mmHg)
160 180 200 −40
−30 −20 −10 0 10 20 30 40 50 −50
80 100 120 140 SBP (mmHg)
Difference (2nd–3rd meas.) (mmHg)
160 180 200 −40
−30 −20 −10 0 10 20 30 40 50
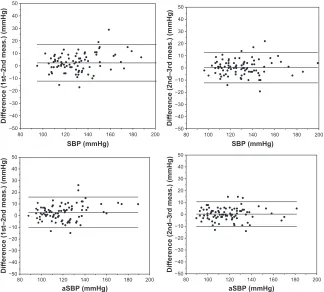
Figure 5 Repeatability of results of different measurements, ie, “first measurement effect”. Abbreviations: sBP, systolic blood pressure; asBP, aortic systolic blood pressure.
Vascular Health and Risk Management downloaded from https://www.dovepress.com/ by 118.70.13.36 on 27-Aug-2020
Dovepress Reproducibility and repeatability of arterial stiffness data
This is evident from comparison of the repeatability diagrams between the first and second measurements and also between the second and third measurements on the second day of the test (Figure 5), as well as from the values shown in Table 1.
Discussion
The results of numerous reproducibility and repeatability studies show that dispersion of statistical variations in results of different measurements obtained by different devices is quite considerable (Table 2).16–19 According to a study by
Crilly et al, considerable dispersion of the values obtained may be explained by differences in patient inclusion criteria, the duration of relaxation preceding the measurements, and the experience of the observers, as well as the impact of daily variations in parameters measured at different times of the day.12 Therefore, no accepted normative values can
be established for these parameters.
So what is the importance of such studies? It is evident that the results for repeatability and reproducibility of the measurements obtained for the different hemodynamic variables are influenced by at least three factors: natural physiological variability of the variables over time, even after intervals of several minutes; subjective components, eg, differences in the tightness of the cuff applied by different observers; and errors caused by the limited accuracy of a device, the measurement method used, or flaws in the measurement algorithm.
It is also evident that when the impact of the second and third factors mentioned above is significantly smaller than the first, it is possible to conclude that measurements taken by a particular device are objective and can be recommended for use in clinical practice. Estimation of the influence of these factors is addressed in reproducibility and repeatability studies.
This study of reproducibility and repeatability of measurements for certain hemodynamic variables obtained by BPLab devices demonstrates a subjective component based
on the measurement techniques used by different observers (reproducibility). The errors connected with the inaccuracy of this device (repeatability) are less significant in relation to the objectively presented variability of the measured parameters, both in the short-term and on an ongoing basis. This conclusion is supported by the results of our study.
Twenty-four-hour monitoring using BPLab for measure-ment of BP and other hemodynamic variables using Vasotens technology has successfully passed reproducibility and repeatability testing, and can be recommended for vascular risk estimation in clinical practice.
Disclosure
This study was funded by a grant from Petr Telegin, Nizhny Novgorod, Russian Federation. Otherwise, the authors report no conflicts of interest in this work.
References
1. Mancia G, De Backer G, Dominiczak A, et al. 2007 Guidelines for the management of arterial hypertension: The Task Force for the Manage-ment of Arterial Hypertension of the European Society of Hypertension (ESH) and of the European Society of Cardiology (ESC). Eur Heart J. 2007;28(12):1462–1536.
2. Benetos A, Safar M, Rudnichi A, et al. Pulse pressure. A predictor of long-term cardiovascular mortality in a French male population.
Hypertension. 1997;30(6):1410–1415.
3. Blacher J, Asmar R, Djane S, London GM, Safar ME. Aortic pulse wave velocity as a marker of cardiovascular risk in hypertensive patients.
Hypertension. 1999;33(5):1111–1117.
4. Willum-Hansen T, Staessen JA, Torp-Pedersen C, et al. Prognostic value of aortic pulse wave velocity as index of arterial stiffness in the general population. Circulation. 2006;113(5):601–603.
5. Laurent S, Boutouyrie P, Asmar R, et al. Aortic stiffness is an indepen-dent predictor of all-cause and cardiovascular mortality in hypertensive patients. Hypertension. 2001;37(5):1236–1241.
6. Dolan E, Thijs L, Li Y, et al. Ambulatory arterial stiffness index as a predictor of cardiovascular mortality in the Dublin Outcome Study.
Hypertension. 2006;47(3):365–370.
7. Cockcroft JR, Wilkinson IB, Webb DJ. The Trevor Howell Lecture. Age, arterial stiffness and the endothelium. Age Ageing. 1997;26 Suppl 4: 53–60.
8. Watabe D, Hashimoto J, Hatanaka R, et al. Electrocardiographic left ventricular hypertrophy and arterial stiffness: the Ohasama study. Am J Hypertens. 2006;19(12):1199–1205.
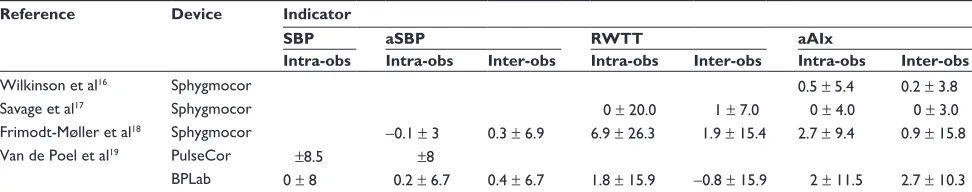
Table 2 comparison of the repeatability and reproducibility of the results obtained by different devices
Reference Device Indicator
SBP aSBP RWTT aAIx
Intra-obs Intra-obs Inter-obs Intra-obs Inter-obs Intra-obs Inter-obs
Wilkinson et al16 sphygmocor 0.5 ± 5.4 0.2 ± 3.8
savage et al17 sphygmocor 0 ± 20.0 1 ± 7.0 0 ± 4.0 0 ± 3.0
Frimodt-Møller et al18 sphygmocor −0.1 ± 3 0.3 ± 6.9 6.9 ± 26.3 1.9 ± 15.4 2.7 ± 9.4 0.9 ± 15.8
Van de Poel et al19 Pulsecor ±8.5 ±8
BPLab 0 ± 8 0.2 ± 6.7 0.4 ± 6.7 1.8 ± 15.9 −0.8 ± 15.9 2 ± 11.5 2.7 ± 10.3 Abbreviations: SBP, systolic blood pressure; aSBP, aortic systolic blood pressure; aAIx, augmentation index; RWTT, reflected wave transit time; intra-obs, intra-observer;
inter-obs, inter-observer.
Vascular Health and Risk Management downloaded from https://www.dovepress.com/ by 118.70.13.36 on 27-Aug-2020
Vascular Health and Risk Management
Publish your work in this journal
Submit your manuscript here: http://www.dovepress.com/vascular-health-and-risk-management-journal
Vascular Health and Risk Management is an international, peer-reviewed journal of therapeutics and risk management, focusing on concise rapid reporting of clinical studies on the processes involved in the maintenance of vascular health; the monitoring, prevention and treatment of vascular disease and its sequelae; and the involvement of
metabolic disorders, particularly diabetes. This journal is indexed on PubMed Central and MedLine. The manuscript management system is completely online and includes a very quick and fair peer-review system, which is all easy to use. Visit http://www.dovepress.com/ testimonials.php to read real quotes from published authors.
Dovepress
Dovepress
Ageenkova and Purygina
9. Garcia-Ortiz L, Ramos-Delgado E, Recio-Rodriguez JI, et al; for Vaso Risk Group. Peripheral and central arterial pressure and its relationship to vascular target organ damage in carotid artery, retina and arterial stiffness. Development and validation of a tool. The Vaso Risk Study.
BMC Public Health. 2011;11:266.
10. Huck CJ, Bronas UG, Williamson EB, Draheim CC, Duprez DA, Dengel DR. Noninvasive measurements of arterial stiffness: repeat-ability and interrelationships with endothelial function and arterial morphology measures. Vasc Health Risk Manag. 2007;3(3):343–349. 11. Matsui Y, Kario K, Ishikawa J, Eguchi K, Hoshide S, Shimada K.
Reproducibility of arterial stiffness indices (pulse wave velocity and augmentation index) simultaneously assessed by automated pulse wave analysis and their associated risk factors in essential hypertensive patients. Hypertens Res. 2004;27(11):851–857.
12. Crilly M, Coch C, Bruce M, Clark H, Williams D. Indices of cardio-vascular function derived from peripheral pulse wave analysis using radial applanation tonometry: a measurement repeatability study. Vasc Med. 2007;12(3):189–197.
13. Sharma GK, Gudapati S, Waller JL, Prisant LM. Assessment of test repeatability of arterial stiffness index. Blood Press Monit. 2005;10(5): 271–274.
14. Milyagin V, Milyagina I, Grekova M, Abramenkova N, Yambe T, Nitta S. New automated method of the pulse wave speed definition.
Funktsional’naya Diagnostika. 2004;1:33–35. Russian.
15. Moiseeva N, Ponomaryov Yu, Sergeeva M, Rogoza A. Estimation of the rigidity indicators in magistral arteries based on the data of bifunc-tional 24-hour monitoring of the BP and the ECG using BPLab® device. Arterial’naya Gipertenziya. 2007;1:13–15. Russian.
16. Wilkinson IB, Fuchs SA, Jansen IM, et al. Reproducibility of pulse wave velocity and augmentation index measured by pulse wave analysis.
J Hypertens. 1998;16(12 Pt 2):2079–2084.
17. Savage MT, Ferro CJ, Pinder SJ, Tomson CR. Reproducibility of derived central arterial waveforms in patients with chronic renal failure. Clin Sci (Lond). 2002;103(1):59–65.
18. Frimodt-Møller M, Nielsen AH, Kamper AL, Strandgaard S. Reproducibility of pulse-wave analysis and pulse-wave velocity determination in chronic kidney disease. Nephrol Dial Transplant. 2008;23(2):594–600.
19. Van de Poel EA, Witjes BCM, Tyrrell RS, Vogel RA, Cockcroft JR, Hall IR. Reproducibility of the arterial stiffness index as determined by the Cardiovision device. Available from: http://www.imdp.com/media/ pdf/selcockcroft1.pdf. Accessed October 13, 2011.
Vascular Health and Risk Management downloaded from https://www.dovepress.com/ by 118.70.13.36 on 27-Aug-2020