www.nat-hazards-earth-syst-sci.net/11/191/2011/ doi:10.5194/nhess-11-191-2011
© Author(s) 2011. CC Attribution 3.0 License.
and Earth
System Sciences
Springtime connections between the large-scale sea-level pressure
field and gust wind speed over Iberia and the Balearics
M. L. Mart´ın1, F. Valero2, A. Pascual2, A. Morata3, and M. Y. Luna3
1Departamento Matem´atica Aplicada, Escuela Universitaria de Inform´atica de Segovia, Universidad de Valladolid, Pza. Sta. Eulalia 9-11, 40005 Segovia, Spain
2Departamento Astrof´ısica y CC. de la Atm´osfera, Facultad de CC F´ısicas, Universidad Complutense de Madrid, Ciudad Universitaria s/n, 28040 Madrid, Spain
3Agencia Estatal de Meteorolog´ıa, Madrid, C/ Leonardo Prieto Castro, 8, 28040, Madrid, Spain
Received: 10 May 2010 – Revised: 28 September 2010 – Accepted: 29 September 2010 – Published: 21 January 2011
Abstract. This paper investigates, by means of Singular Value Decomposition analysis, the springtime relationships between the mean sea-level pressure field over the North Atlantic and the regional wind gusts over the Iberian Penin-sula, identifying the main atmospheric circulation patterns linked to gust wind speed anomaly configurations. The statistical significance of the obtained modes is investigated by means of Monte Carlo approach. The analysis highlighted that the covariability is dominated by two main large-scale features of the atmospheric circulation over the North Atlantic. The first mode relates to Iberian gust wind speeds to the Scandinavian pattern (SCAND), linking the large-scale pattern to above-normal wind gusts. The second covariability mode, associated with the North Atlantic Oscillation (NAO) pattern, correlates with maximum wind speeds over Iberia. An enhanced spring NAO pattern is related to positive (negative) wind gust correlations over northern (southern) Iberia. To find true relationships between large-scale atmospheric field and the gust wind speeds, composite maps were built up to give an average atmospheric circulation associated with coherent wind gust variability over Iberia.
1 Introduction
The use of sustainable and clean renewable energies has increased since the last decades, with the wind energy being a proven useful technology. In this sense, many efforts are leading us to use high potential wind energy resources nowadays. Severe storms and related destructive wind speeds pose a significant threat to modern societies and their assets.
Correspondence to: M. L. Mart´ın
Severe storms are responsible for more than 50% of the total economic loss in central Europe, due to natural hazards (Ulbrich et al., 2001). A single extreme storm event can cause economic losses exceeding 10 billion C. Therefore, the knowledge of atmospheric circulation patterns conducive to risky meteorological situations related to extreme wind events is especially important for wind energy applications (Palutikof et al., 1987; Thuilleier, 1987; Zuranski and Jaspinka, 1996).
on a local scale, a decisive factor in the development of cloud systems or in the enhancement of wind speeds over different areas. on a larger scale, the topography can help to generated or redirected synoptic and mesoscale flows.
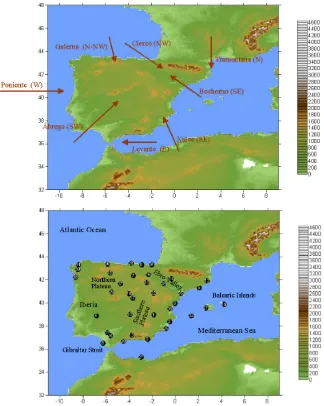
Relating to wind regime, the Iberian monthly mean gusts are characterised by a maximum in spring, minimum strength in summer and a high frequency of calm in winter, exhibiting important climatic contrasts. The northern Peninsula is mainly affected by cold dry or moist wind, depending on the air mass origin, while the south of Iberia is affected by the southwestern warm dry winds coming from North Africa or by warm wet air masses coming from the southeast. As an example, the Mediterranean Peninsula coastline is affected by wet winds which are called Levante or by wet and warm air masses coming from the Sahara, called the Xaloc (Fig. 1a). The northwestern (southeastern) cold (warm) dry (moist) winds blowing down (up)-valley Ebro are known as Cierzo (Bochorno) while west-northwestern moist cold winds, called Galerna blow the Cantabric coasts (Font, 2000; Garc´ıa, 1985). On the other hand, Tramontana are northern or northeastern winds affecting Catalonia and the Balearics. Southern Iberia is influenced by winds such as ´Abrego with different characteristics to those of the northern Peninsula. As a result, advection of west-east air mass with diverse characteristics, influence of orography and land-sea temperature contrasts could lead to significant northern-southern differences. Therefore, advances in understanding the relationships of winds in the Iberian Peninsula with coherent atmospheric patterns constitute an issue of relevance and a fundamental prerequisite for engineering, forestry and risk management purposes.
The main objective of this paper is to identify atmospheric circulation patterns occurring simultaneously with gust wind speeds, with special emphasis on episodes of strong gusts, on the Iberian Peninsula and the Balearics during the spring season. If the large-scale circulation configurations are associated with typical surface wind circulation patterns, mechanisms forcing regional atmospheric variability will be better understood. In order to analyse the relationships between large-scale atmospheric variables, such as sea-level pressure, and gust wind speed field, the methodology based on the singular value decomposition is applied. The statistical multivariate techniques have been successfully used by the authors in other studies giving evidence of the influence of several North Atlantic teleconnection patterns of low-frequency on the variability of the regional variables in the Western Mediterranean area (Martin et al., 2004; Morata et al., 2006, 2008; Sotillo et al., 2006; Valero et al., 2009). In these studies, monthly mean geopotential heights at upper atmospheric levels are used; on the contrary, this paper will be confined to the near-surface atmospheric variables in representing the large-scale atmospheric circulation at a more realistic height level to obtain more accurate circulation patterns with the observational maximum wind speeds over Iberia. In addition, the study of the relationship between
the spring gust variability and the teleconnection patterns has been reinforced by means of wavelet transforms and composite analyses.
The study is set out as follows. A brief description of the datasets and the methodology applied to the original datasets are given in Sect. 2. Section 3 is devoted to analysing the Iberian maximum wind speed variability and its connection with low-level atmospheric circulation taking into account the statistical significance of the coupled modes. Section 4 presents the results from the composite maps obtained from the extreme gust wind speed data, statistically derived in the previous section, conditioned by the large-scale atmospheric data base. The summary and discussion of the main results are drawn in Sect. 5.
2 Data and methodology
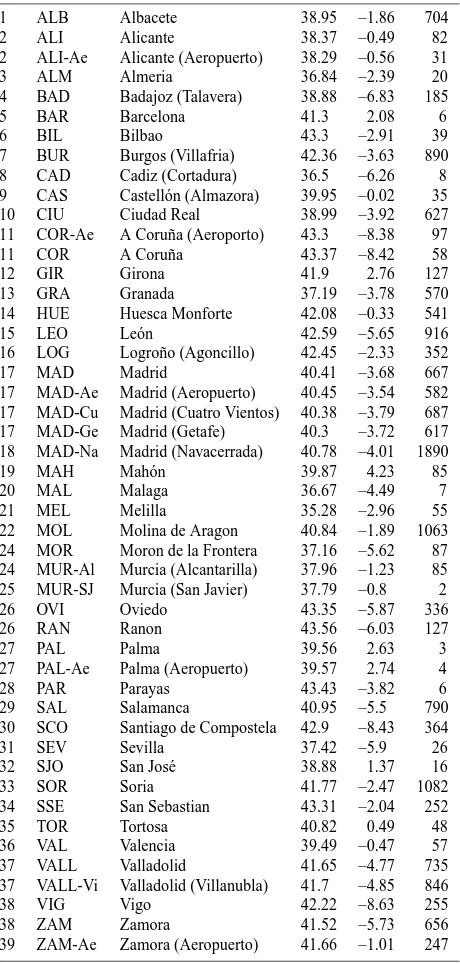
Two datasets have been used in this study: monthly mean sea-level pressure (MSLP) and monthly mean gust wind speed data for 48 stations distributed over Iberia (Fig. 1b), during the spring (M-A-M) season from 1980 to 2001. MSLP data are a product of the ERA40 Reanalysis (Gibson et al., 1997; Simmons and Gibson, 2000). The MSLP data are given on a 1.2◦ ×1.2◦latitude×longitude grid, spanning a domain from 52◦W to 16◦E and 20◦ to 60◦N for 22-spring (1980–2001). Gust wind speed data used in this paper consists of time series of daily maximum wind speeds from 48 sites over the Iberian Peninsula (station locations will be displayed by dots in the Fig. 1b), covering the 1980–2001 period. These data come from in situ measurements of the station network of the Spanish Meteorological Agency (Agencia Estatal de Meteorolog´ıa, AEMET). The data sampling frequency corresponds to 3-s average one. From the daily maximum wind speed data, monthly mean gust wind speed field has been obtained over the 22-year period. The list of stations used and their geographical coordinates are shown in Table 1. Prior to the diagnostic analysis, the MSLP dataset was modified applying a cos(latitude) square root area-weighting to account for the uneven spatial density of the grid.
Fig. 1. (a) The Iberian Peninsula with typical winds and directions superimposed. This figure is available in colour online. (b) Circles indicate
the wind stations for the Iberian Peninsula with its orography detailed. The station codes are shown in Table 1. The x-axis corresponds to longitude, positive (negative) for degree East (West). The y-axis to latitude, positive for degree North.
data fields yields two sets of orthogonal singular vectors describing a squared covariance fraction (SCF) of two time series. The SCF represents the percentage of the squared covariance (SC) explained by a pair of patterns. These singular vectors are also called left and right patterns or modes. Moreover, the modes are ordered with respect to their singular values so that the first pair accounts for the largest SCF and the remaining pairs describe a maximum fraction unexplained by the previous pairs (in analogous manner to the eigenvalues in Principal Component Analysis, PCA). In fact, the interpretation of the left and right singular vectors is a natural extension of the EOF concept (von Storch and Navarra, 1995). Each singular value measures the contribution of each corresponding pair of modes to the total squared covariance. Thus, the SCF accounted for
Table 1. List of stations used indicating the code for Fig. 1b, name,
longitude, latitude and altitude.
1 ALB Albacete 38.95 –1.86 704 2 ALI Alicante 38.37 –0.49 82 2 ALI-Ae Alicante (Aeropuerto) 38.29 –0.56 31
3 ALM Almeria 36.84 –2.39 20
4 BAD Badajoz (Talavera) 38.88 –6.83 185
5 BAR Barcelona 41.3 2.08 6
6 BIL Bilbao 43.3 –2.91 39
7 BUR Burgos (Villafria) 42.36 –3.63 890 8 CAD Cadiz (Cortadura) 36.5 –6.26 8 9 CAS Castell´on (Almazora) 39.95 –0.02 35 10 CIU Ciudad Real 38.99 –3.92 627 11 COR-Ae A Coru˜na (Aeroporto) 43.3 –8.38 97 11 COR A Coru˜na 43.37 –8.42 58
12 GIR Girona 41.9 2.76 127
13 GRA Granada 37.19 –3.78 570 14 HUE Huesca Monforte 42.08 –0.33 541
15 LEO Le´on 42.59 –5.65 916
16 LOG Logro˜no (Agoncillo) 42.45 –2.33 352 17 MAD Madrid 40.41 –3.68 667 17 MAD-Ae Madrid (Aeropuerto) 40.45 –3.54 582 17 MAD-Cu Madrid (Cuatro Vientos) 40.38 –3.79 687 17 MAD-Ge Madrid (Getafe) 40.3 –3.72 617 18 MAD-Na Madrid (Navacerrada) 40.78 –4.01 1890
19 MAH Mah´on 39.87 4.23 85
20 MAL Malaga 36.67 –4.49 7
21 MEL Melilla 35.28 –2.96 55 22 MOL Molina de Aragon 40.84 –1.89 1063 24 MOR Moron de la Frontera 37.16 –5.62 87 24 MUR-Al Murcia (Alcantarilla) 37.96 –1.23 85 25 MUR-SJ Murcia (San Javier) 37.79 –0.8 2 26 OVI Oviedo 43.35 –5.87 336
26 RAN Ranon 43.56 –6.03 127
27 PAL Palma 39.56 2.63 3
27 PAL-Ae Palma (Aeropuerto) 39.57 2.74 4 28 PAR Parayas 43.43 –3.82 6 29 SAL Salamanca 40.95 –5.5 790 30 SCO Santiago de Compostela 42.9 –8.43 364
31 SEV Sevilla 37.42 –5.9 26
32 SJO San Jos´e 38.88 1.37 16 33 SOR Soria 41.77 –2.47 1082 34 SSE San Sebastian 43.31 –2.04 252
35 TOR Tortosa 40.82 0.49 48
36 VAL Valencia 39.49 –0.47 57 37 VALL Valladolid 41.65 –4.77 735 37 VALL-Vi Valladolid (Villanubla) 41.7 –4.85 846
38 VIG Vigo 42.22 –8.63 255
38 ZAM Zamora 41.52 –5.73 656 39 ZAM-Ae Zamora (Aeropuerto) 41.66 –1.01 247
and thei-th right (left) expansion coefficient time series. For display purposes, the time series of expansion coefficients have been normalized by their standard deviation. The SVD was then performed on the detrended data to obtain seasonally-independent detrended modes. The expansion coefficients are obtained by projecting the original data (i.e., non-detrended) onto the previously derived SVD spatial modes. This allows for a representation of the long-term trends in the time series of expansion coefficients while the initial detrending of data avoids inflation of the
cross-covariance coefficients in the determination of the spatial SVD patterns (Heyen et al., 1996; von Storch and Zwiers, 1999).
On the other hand and in order to get information about all timescales of the time series derived through the paper, a wavelet transform analysis has been carried out. The wavelet transform technique was introduced and formulated by Morlet et al. (1982) and Grossmand and Morlet (1984). Wavelet transforms have been successfully applied to different studies of meteorological and climatological time series so as to understand their temporal scales of variability (Gamage and Blumen, 1993; Gao and Li, 1993; Weng and Lau, 1994; Morata et al., 2006; Barbosa et al., 2009). These studies underline the advantages of the technique compared to Fourier transform analysis since the former plays down the difficulty of showing structures on different time or spatial scales at different time or spatial locations. While the Fourier transform does not contain any time dependence on the signal, hence, not providing any local information regarding the time evolution of its spectra, that wavelets enable localization in frequency and in time (Morlet et al., 1982), it turns out to be an appropriate and powerful tool to study time series. The wavelet transformation not only has good local properties in time and frequency domain, but it also works as a microscopic analytical function by decomposing a time series into a set of scale components, allowing discrimination between oscillations occurring at fast scales and others at slow scales (Morlet et al., 1982; Grossmand and Morlet, 1984; Mallat, 1998; Kaiser, 1995; Morata et al., 2006, 2008). Additionally, the continuous wavelet analysis has the advantage of being usually easier to interpret because all the information tends to be more visible. In this paper, the continuous wavelet transform was used as a filter to decompose and isolate characteristics (Mallat, 1998) of the time series at different frequencies.
In order to assess the statistical robustness and significa-tion of the SVD results, a Monte Carlo test is performed. The test determined the statistical significance of the leading SVD modes and to indirectly estimate the relative importance of the large-scale atmospheric circulation over the regional gust wind speed field. From the SVDA results, for the Monte Carlo test, instead of using the SCF or the correlation coefficient, it was taken into account the abovementioned squared covariance (SC). The reason for using the SC is because SC does not measure the percentage of the covariance explained by a pair of patterns, but the direct relationship between the surface atmospheric and gust wind speed fields and between the coupled SVD patterns; on the other hand, the SCF and the correlation, r, are indirect measures of the relationship between the SVDA modes. Thus, a large SCF andr in the leading SVD modes of the two weakly related fields can be found, even though these modes actually account for little SC (Wallace et al., 1992). Therefore, the SCF andrare only meaningful when they are associated with a significant SC. The procedure is similar to one described in Martin et al. (2004). In this paper, several scrambled datasets are built by only scrambling each synoptic MSLP pattern, destroying its chronology relative to the gust wind speed field. Then, a SVD is performed over each scrambled dataset and the gust wind speed field, doing consequently several SVDs. These scrambled results are then compared to those obtained from the original unscrambled data. Thus, if two strongly related datasets are scrambled, their relationship becomes worse, to some extent, being reflected directly in the total SC as well as the SC of each SVD mode. More explanations of the procedure followed in this paper are given in the next section.
3 Results of the coupled atmospheric circulation-wind gust patterns
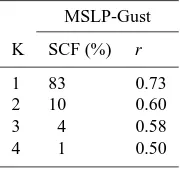
In this section, the robust relationships between the Iberian gust wind speeds and the large-scale atmospheric circulation patterns are investigated by means of a SVD analysis and the results are analysed by testing their statistical significance. The analysis is carried out diagonalizing the covariance matrix between gusts and MSLP. Finally, the true circulation characteristics related to the correlation patterns will be exposed by composite maps. Table 2 shows the percentage of the squared covariance fraction and the temporal correlation between pairs of expansion coefficients for the first modes of the SVD analysis, to give us an idea of the strength of the coupling.
3.1 Robustness of modes
In order to give statistical significance to the SVD results and to indicate the genuine and not artificial result of a statistical methodology, it is necessary to analyse the statistical robustness of the modes. To do this, a procedure
Table 2. Squared covariance fraction, SCF, and temporal correlation coefficient, r, for the first modes of SVD analysis corresponding to the pairs of coupled patterns.
MSLP-Gust
K SCF (%) r
1 83 0.73
2 10 0.60
3 4 0.58
4 1 0.50
based on a Monte Carlo approach is applied. Following the procedure described in Martin et al. (2004), 100 scrambled datasets are built by only scrambling each synoptic MSLP pattern of 22 years, destroying its chronology relative to the gust wind speed field. Then, a SVD is performed over each scrambled dataset and the gust wind speed field, doing consequently 100 SVDs, comparing the 100 SVDs results with those obtained from the original unscrambled data. The observed SC from the observed MSLP field and the gust wind speed dataset is considered statistically significant at the 95% level if such observed SC is not higher than five values of the 100 scrambled datasets. If lesser than five scrambled SC values are found to be greater than the observed SC, then the observed SC is significant. Here, the results of the 100 scrambled SVDs and the corresponding results from the original SVDs based on the observed data have shown that the total SC of the original datasets exceeds the 95% significance level for the synoptic field, thereby suggesting that the detected relationship between gusts in the Iberian Peninsula and surface circulation is significant. Moreover, only the SC values corresponding to the two first coupled modes of MSLP/gust are found to be significant at the 95% level. These results imply that the Iberian maximum wind speed field response to dynamical atmospheric processes, involved in MSLP, is effective. Thus, the coupling obtained from the SVD patterns between the Iberian gust wind speeds and large-scale surface atmospheric circulation is genuine and not an artificial result of a statistical methodology. From the analysis and the Monte Carlo results, only the two first coupled modes, accounting for 93% of accumulated covariance, are considered.
3.2 First mode of covariability
(a)
(b)
(c)
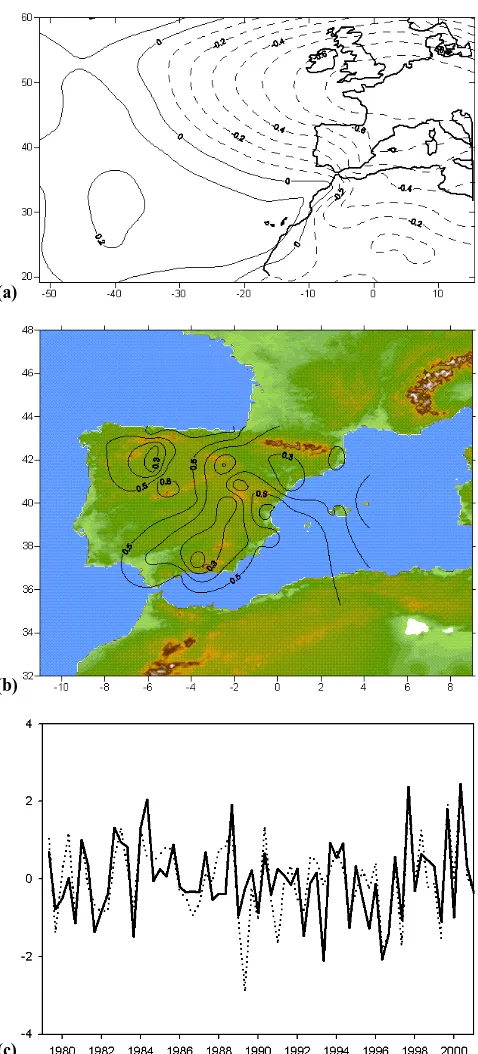
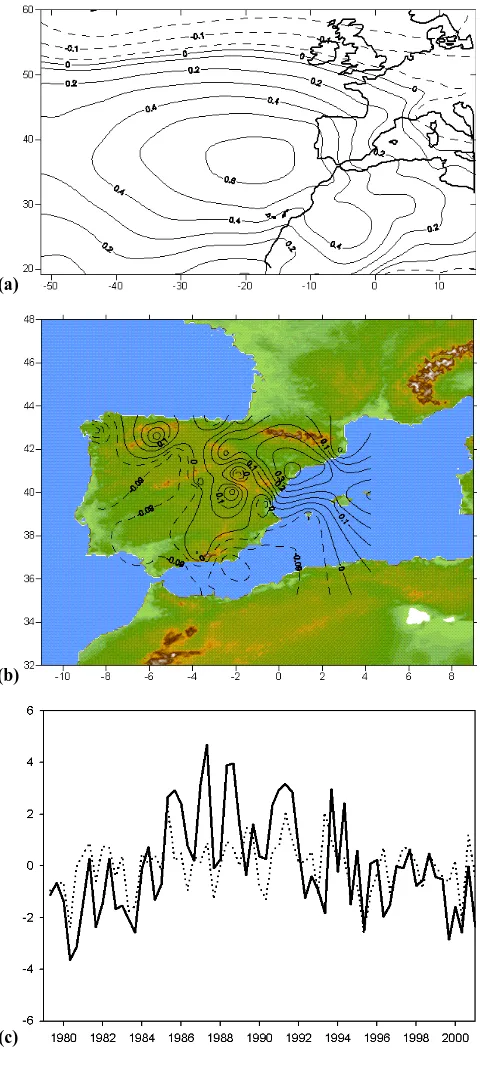
Fig. 2. Heterogeneous correlation patterns of the SVD1: (a) MSLP
and (b) gust wind speed. The positive (negative) correlations are solid (dashed). (c) Expansion coefficient time series of the wind gust (continuous line) and MSLP (dashed line) of the SVD1 mode. Units are in standard deviations in the y-axis and the x-axis corresponds to the time period. This figure is available in colour online.
flows over the Mediterranean Iberian zone. The gust pattern (Fig. 2b) presents similar behaviour over the whole Peninsula, depicting positive (negative, in its opposite phase) gust wind speed correlations in the whole area. This pattern shows air masses blowing in the mouth of the Ebro river with associated northwestern (southeastern, in its opposite phase) moist winds blowing down-valley (up-valley, in its opposite phase) Ebro corresponds to Cierzo (Bochorno, in its opposite phase) (Garcia, 1985). The gust wind speed pattern described by the first SVD mode accounts for more than 20% of the total maximum wind speed variance and matches the first homogeneous mode of this variable (not shown) which accounts for 44% of the gust wind speed variability. The agreement between the gust SVD pattern and its corresponding homogeneous mode is indicative not only of the intensity of the obtained heterogeneous pattern, but also of the strength of the link between the large-scale pattern and the gust wind speeds. The associated MSLP pattern explains 12% of variance and it agrees reasonably well with its corresponding first homogeneous mode, accounting for 25% of the MSLP variability. This geopotential pattern matches reasonably well to the well-known teleconnection pattern called the Scandinavian Pattern (SCAND) (Rogers, 1990). The SCAND pattern is one of the most prominent teleconnection patterns that affects Eurasia throughout year. This pattern has been referred to as the Eurasia-1 pattern by Barnston and Livezey (1987). The SCAND pattern is characterised in its positive (negative) phase by a north-south dipole of anomaly centres with a positive (negative) node centred over Scandinavia and another negative (positive) centre over Western Europe. The correlation value between the MSLP first expansion coefficient time series and the time series of the SCAND pattern is 0.6, indicating that the SVD1 relates the gust wind speeds in the Iberian Peninsula to such teleconnection mode of variability.
(a) (b)
(c) (d)
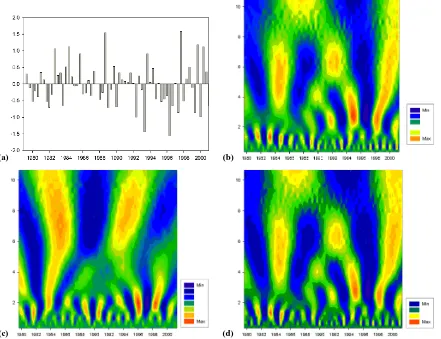
Fig. 3. (a) Standardized wind gust time series spatially and temporally (March-May) averaged over Iberia. Units are in standard deviations
in the y-axis and the x-axis corresponds to the time period. The wavelet power spectrum (dimensionless) of the: (b) standardized wind gust time series displayed in (a); and (c) spring SCAND index and (d) wind gust expansion coefficient time series corresponding to Fig. 2c (continuous line). The y-axis represents the variability scale (years) and the x-axis corresponds to the time period. This figure is available in colour online.
Although neither significant periods are found after applying a spectral analysis to these time series nor significant trends are found after applying the Mann-Kendall test (Goossens and Berger, 1986), the Morlet wavelet continuous analysis of all time series shows some remarkable characteristics (results only shown corresponding to time series of Fig. 2c, continuous line). Figure 3b shows the wavelet power spectrum displayed as a function of period and time, corresponding to the wind gust time series spatially and temporally averaged over Iberia. The magnitude of wavelet coefficients gives a measure of the correlation between the signal and the wavelet basis. The power spectrum is mainly characterised by scales ranging between 3 and 8 years (see y-axis of Fig. 3b), throughout the whole time period (1980–2001). Although power spectrum intensity is mainly concentrated in periods between 4 and 8 years, around 1984 and 1992 there arose some highly energetic amplitude, presenting nuclei with maximum amplitude at 6 years. The minima are located around 1982,
1989, 1993 and 1997 with scales evolving between 2 and 8 years, presenting minimum highly energetic oscillation. It is noteworthy how pronounced peaks on these dates are observed, in general, in the corresponding time series (Fig. 3a). In fact, if the panels (a) and (b) in Fig. 3 are compared, it can be observed that the time location of wavelet maxima and minima match with above-normal and below-normal gust wind speed periods, remarkable during the period 1994–1998. Throughout the record, some episodes of quasi-biennial oscillation (QBO) are found, lasting a short time. QBO signal predominates during the period 1990–2001, exhibiting high intensity around 1995. Additionally, periodograms of the time series were derived (not shown) to reveal that the maximum power of the spectra is concentrated in periods of less than 8 years, showing similarity with the wavelet results shown.
(Fig. 3c) is mainly concentrated in periods between 4 and 9 years, with highly energetic amplitude centred around 1984, noticing a maximum nucleus on 1994 with a period of maximum amplitude at 8 years. The power spectrum minima also present similarities with the corresponding minima of Fig. 3b. As in this figure, throughout the record, some episodes of quasi-biennial oscillation (QBO) are found, lasting a short time and exhibiting high intensity during the last part of the 20th century. Moreover, if the panels (b) and (c) are compared with the panel (d) in Fig. 3 (expansion coefficient time series corresponding to gust wind speed field, Fig. 2c, continuous line) coherent zones in their wavelet power spectra can be observed, highlighting the similarity in sequences of the maximum/minimum in both signals. Such information is also noted in the correlation between the two time series (r >0.9) as it is mentioned above. The maxima/minima are found approximately at the same scale and time values, indicating the analogous time-frequency evolution of gust wind speed expansion coefficient time series (Fig. 2c) and the wind gust spatial average time series (Fig. 3a). This result relates the SVD1 with the SCAND pattern, and it would explain the year-to-year fluctuations of the maximum wind speeds over the whole Iberia.
3.3 Second mode of covariability
The second SVD mode (SVD2) explains 10% of the squared covariance between MSLP and gust wind speed fields (Table 2). Figure 4a shows a strong nucleus of positive correlations located in southwestern Iberia that favour north-northwestern air masses advection over Iberia. The corresponding wind gust heterogeneous pattern (Fig. 4b) presents an area of positive correlations located over northern Iberia and negative ones in the remainder of Iberia. This pattern reflects reinforcement of northwestern gusts blowing down-valley Ebro, knowing this wind as Cierzo (Garcia, 1985). The wind gust SVD2 mode represents about 6% of the total gust wind speed variance and matches its corresponding homogeneous pattern (not shown) which accounts for 12% of the wind gust variability.
On the other hand, the MSLP patterns described by the SVD2 mode explain 10% of variance, and it agrees reasonably well with the corresponding homogeneous pattern (not shown). Both spatial patterns match the well-known NAO teleconnection pattern (Barnston and Livezey, 1987), the main mode of low frequency variability in the North Atlantic. In fact, the correlation value between this heterogeneous pattern and the NAO configuration is 0.60.
Figure 4c displays the SVD2 time series. The correlation between the pairs of time series is 0.60 (Table 2), bringing out a notable association between the MSLP and gust wind speed fields. No significant trends were found when applying the Mann-Kendall test to the time series. However, significant periods (around 11 years, 3 years and more than 1 year) were found after applying a spectral analysis and
(a)
(b)
(c)
Fig. 4. Same as Fig. 2 except for the SVD2.
(a)
(b)
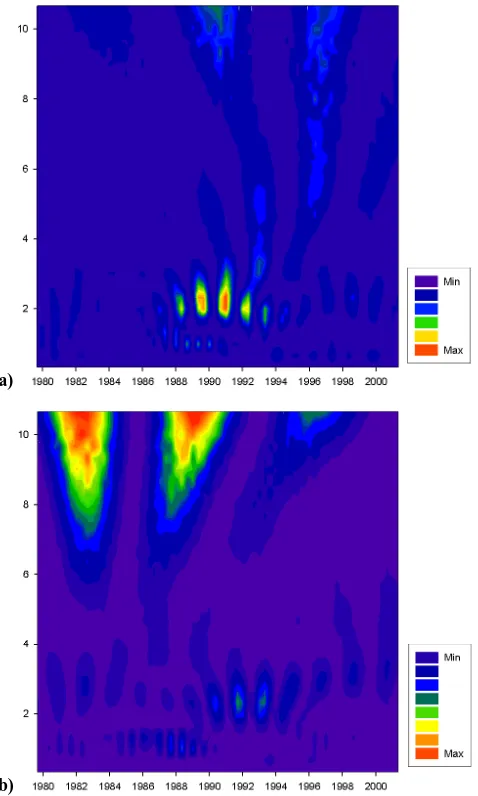
Fig. 5. The wavelet power spectrum (dimensionless) of the (a)
spring NAO index and (b) wind gust expansion coefficient time series corresponding to Fig. 4c (continuous line). The y-axis represents the variability scale (years) and the x-axis corresponds to the time period. This figure is available in colour online.
signal in the same periods than the NAO wavelet but in a different time. It is worthy to note the lack of phase existing between both low-frequency signals: while the NAO maximum highly energetic oscillations, associated with low-frequency periods, are distributed on the 1990 decade, the corresponding maxima of the wind SVD2 mode are located in the first part of the record over the 1980 decade and coincidentally around 1990. On the other hand, episodes of high energetic oscillations are also found in high frequency. In the NAO case, there are zones of maximum intensity during the years 1987–1993 in periods around 2 years, exhibiting the highest intensity around 1991. In the wind gust case (Fig. 5b), the maximum areas are located over 1989– 1994, with the highest intensity centred on 1992. Concerning
periods smaller than 2 years, there are some signals between 1985 and 1991 in the gust power spectrum, not being significant enough in the NAO wavelet. Periodograms of the time series (not shown) are in agreement with the variability associated with low frequency periods, showing significant variance between 6 and 10 years, and considerable variance associated with high frequency (<3 years). The oscillating value influence of the winter NAO index in the Northern Hemisphere was analysed by Hurrell and van Loon (1997), emphasizing this influence on precipitation and temperature fields over the Atlantic area. In their study, time series of the winter NAO index (1864–1995) and the corresponding power spectrum were analysed, revealing decadal changes in the NAO index with significant variance at biennial periods in the first part of the record, whereas the 6–10 variance was enhanced over the latter half of the 20th century (Hurrell and van Loon, 1997). It is well know that the NAO is most pronounced during winter; however, in this paper, the strong seasonal relationship between this teleconnection index and the Iberian maximum wind speeds during the springtime has been revealed. The low frequency variability, shown in the wavelet of the NAO-second SVD wind gust mode, revealed reverse behaviour related to high time scales, being of similar results to those of Hurrell and van Loon (1997).
4 Relationships between gust wind speeds and large-scale atmospheric circulation
To examine the influence of the large-scale atmospheric circulation over the gust wind speed field at Iberia and to obtain relationships between observational patterns and the coupled obtained SVD modes, maps of composites of the two datasets have been obtained. In this paper, positive (negative) composites of the wind gusts are built, conditioned by the 5% highest (lowest) expansion coefficients of MSLP. Thus, the dates associated with the highest and lowest scores of the large-scale atmospheric field are used to derive two average patters: one of the MSLP and another of the wind gusts. These maps give an “average” pattern associated with extreme conditions in the wind gust field over the Iberian Peninsula.
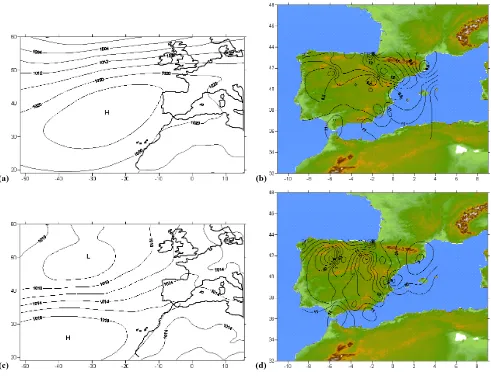
(a) (b)
(c) (d)
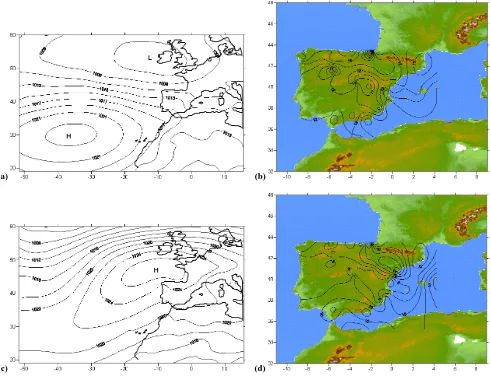
Fig. 6. Composite anomaly maps of the first mode: (a) MSLP (hPa) and (b) wind gust (ms−1) corresponding to the positive composite.
(c) MSLP (hPa) and (d) wind gust (ms−1) corresponding to the negative composite. This figure is available in colour online.
Alternatively, negative composites are shown in Fig. 6c and d. The MSLP pattern shows a strong nucleus of MSLP isolines located in northeastern Iberia, promoting strong wind gusts of Bochorno along the Ebro Valley (wind gusts higher than 11 ms−1), the Gibraltar area, the Mediterranean Iberian zone and the Balearic area (Fig. 6d). It is remarkable the similarity between the MSLP composite patter (Fig. 6c) and the negative phase of MSLP SVD1 mode (Fig. 2a), showing strong nucleus, of SLP and positive correlations, respectively in both configurations.
For the SVD2 composite positive maps (Fig. 7a and b), it is again remarkable how the coupled SVD mode configurations (Fig. 4) are reproducible in the corresponding composite maps. Thus, Fig. 7a shows a strong nucleus in the MSLP pattern located over the Atlantic Ocean, favouring north-northwestern-western winds over Iberia as noted in the corresponding composite map (Fig. 7b) in which the gust
(a) (b)
(c) (d)
Fig. 7. Same as Fig. 6 except for the second mode.
5 Summary and discussion
The relationship between spring gust wind speeds over the Iberian Peninsula and Balearics and surface atmospheric circulation has been examined by means of the SVD analysis. In order to characterise the atmospheric circulation, monthly mean sea-level pressure of 22 springtimes from 1980 to 2001 have been used. For the same period, monthly mean gust wind speed time series of 48 sites covering mainly Iberia and the Balearic Islands have been considered. A Monte Carlo test was performed to assess the statistical robustness of the statistically obtained SVD results. The test has determined the statistical significance of the two leading SVD modes and has indirectly estimated the relative importance of the synoptic atmospheric circulation over the Iberian gust wind speed field. Thus, two modes have been obtained and described in the context of known tropospheric teleconnection patterns. They explain over 83% of the total covariability between the atmospheric variables and the Iberian wind gust field and almost 30% of the wind gust variability itself. The results of this study imply that
the atmospheric conditions in the North Atlantic and the maximum wind speeds over Iberia display two different modes of interaction.
down-valley Ebro. Thus, the gust wind speed pattern displays an area of high positive correlations located over the areas of northern Iberia, showing higher values over the Ebro Valley. The negative correlation values are situated in the central part of Iberia. These results indicate that this SVD2 mode would explain the response of the study area to the NAO pattern, that is, an intensification (weakening) of the spring NAO index is linked with positive (negative) wind gust correlations over the northern (southern) area of study.
Additional information related to the temporal evolution of the obtained SVD modes have been extracted from the analysis of the expansion coefficient time series by means of wavelet analysis. The SVD1 mode could be responsible for the year-to-year gust fluctuations on the study area. For the gust wind speed time series spatially and temporally averaged over Iberia and the wind expansion coefficient time series of the first mode, wavelet transforms have been applied, highlighting the sequence of the maximum/minimum in both signals at the same scale and time values. This information was also noted in the absolute correlation value of 0.9 obtained between the two time series. Therefore, it can be seen that the SVD1 wind gust expansion coefficient time series and the gust wind speed spatial average time series present analogous time-frequency evolution. Thus, the SVD1 would explain the year-to-year wind gust fluctuations of the whole Iberia.
For the second SVD mode, the wavelet transforms, applied to both gust wind speed expansion coefficient time series and the spring NAO index, show a reverse behaviour related to high scales (periods around 11 years), being phased out of the low-frequency signals associated to both time series. The NAO maximum highly energetic oscillations are distributed on the 1990 decade while the corresponding maximum of the wind gust SVD mode can be observed on the 1980 decade. Concerning lower scales, some episodes of high energetic oscillations predominate from 1985 to 1991 in both signals. As in the spectrum winter results of Hurrell and van Loon (1997), the variability associated with low frequency, shown in the wavelet of the NAO-SVD2 wind gust mode, has revealed a reverse behaviour related to high time scales. While the variability associated with a low frequency period was highlighted in the NAO index on the 1990 decade, here the remarkable variability of the gust wind speed SVD2 mode wavelet spectrum appeared on the 1980 decade. Positive values of the NAO index are indicative of stronger than average westerlies over the middle latitude areas which are associated with anomalies of low pressures over the Icelandic and strong anomalies of high pressures over the subtropical Atlantic. This can be noticed on the reverse behaviour of the Iberian wind gusts at low frequency. In this way, alterations in the North Atlantic mean circulation patterns go with marked shifts in the storm tracks and their related large-scale eddy activity (Hurrell, 1995; Rogers and Mosley-Thompson, 1995). If the anticyclonic (cyclonic) behaviour over Iberia is long-time reinforced, the
wind field will present periods of calm (windy) over most of the Iberian Peninsula and subsequently the gust wind speeds will be modified.
The strong influence of the pressure centres over the Atlantic Ocean in the Iberian gust wind speed field has been studied, identifying different atmospheric circulation patterns that have an influence on the springtime wind gust variability in Iberia. The SVD analysis has shown that the atmospheric dynamics in the North Atlantic is responsible for about 30% of the wind gust variance in the Iberian Peninsula. The variation of intensity and/or position of pressure centres, within a climate change scenario, could possibly change the relative frequency of the large-scale atmospheric patterns or form new ones, changing the present wind system and, subsequently, the gust wind speed regime.
Acknowledgements. This work has been partially supported by the research projects CGL2007-61328/CLI, CGL2009-07950, UE SafeWind Grant Agreement No. 213740 and VA025A10-2. Two anonymous reviewers provided helpful comments and suggestions. The authors wish to thank the following institutions which provided us with data: ERA40 from the European Center for Weather Medium Forecast (ECWMF), the Iberian Wind Dataset from the Spanish Meteorological Service (AEMET: Agencia Estatal de Meteorolog´ıa, Spain) and the teleconnection indices by the US Climate Prediction Center from the web site http://www.cpc.noaa.gov/data/teledoc/telecontents.shtml.
Edited by: M.-C. Llasat
Reviewed by: two anonymous referees
References
Barbosa, S. M., Silva, M. E., and Fernandes, M. J.: Multi-scale variability patterns in NCEP/NCAR rean´alisis sea-level pressure, Theor. Appl. Climatol., 96, 319–326, doi:10.1007/s00704-008-0042-4, 2009.
Barnston, A. G. and Livezey, R. E.: Classification, seasonality and persistence of low-frequency atmospheric circulation patterns, Mon. Weather Rev., 115, 1083–1126, 1987.
Bluestein, H. B.: Synoptic Dynamic Meteorology in Midlati-tudes.Vol. II. Observations and Theory of Weather Systems, Oxford University Press, UK, 594 pp., 1993.
Bretherton, C. S., Smith, C., and Wallace, J. M.: An intercomparison of methods for finding coupled patterns in climate data, J. Climate, 5, 541–560, 1992.
Corte-Real, J., Zhang, X., and Wang, X.: Large-scale circulation regimes and surface climatic anomalies over the Mediterranean, Int. J. Climatol., 15, 1135–1150, 1995.
Davis, R.: Predictability of sea surface temperature and sea level pressure anomalies over the Northern Hemisphere, J. Phys. Ocean., 6, 249–266, 1976.
Deser, C. and Blackmon, M. L.: Surface climate variations over the North Atlantic ocean during winter: 1900–1989, J. Climate, 6, 1743–1753, 1993.
Font, I.: Climatolog´ıa de Espa˜na y Portugal, 2nd edn., Ediciones Universidad de Salamanca, Spain, 422 pp., 2000.
Gamage, N. and Blumen, W.: Comparative analysis of low-level cold fronts: Wavelets, Fourier, and empirical orthogonal function decomposition, Mon. Weather Rev., 121, 2867–2878, 1993. Garcia, L.: La predicci´on del Tiempo en el Valle del Ebro, INM,
Madrid, Technical Report Serie A, No 38, 1985.
Gao, W. and Li, B. L.: Wavelet analysis of coherent structures at the atmosphere-forest interface, J. Appl. Meteorol., 32, 1717–1725, 1993.
Gibson, J. K., Kallberg, P., Uppala, S., Hernandez, A., ˜Nomura, A., and Serrano, E.: ERA description, ECMWF, Reading, UK, Technical Report Re-analysis Project Report Series 1, 1997. Glowienka-Hence, R.: The North Atlantic Oscillation in the
Atlantic-European SLP, Tellus, 42, 497–507, 1990.
Goossens, C. and Berger, A.: Annual and seasonal climatic variations over the Northern Hemisphere and Europe during the last century, Ann. Geophys., 4B, 385-400, 1986.
Grossmand, A. and Morlet, J.: Decomposition of Hardy functions into square integrable wavelets of constant shape, SIAM J. Math. Anal., 15, 732–736, 1984.
Heyen, H., Zorita, E., and von Storch, H.: Statistical downscaling of monthly mean North Atlantic air-pressure to sea level anomalies in the Baltic Sea, Tellus A, 48, 312–323, 1996.
Holton, J. R.: An introduction to dynamic meteorology, 3rd edn., Adademic Press, Int. Geophys. Ser, 48, 511 pp., 1992.
Hu, Q.: On the uniqueness of the singular value decomposition in meteorological applications, J. Climate, 10, 1762–1766, 1997. Hurrell, J. W.: Transient eddy forcing of the rotational flow during
northern winter, J. Atmos. Sci., 52, 2286–2301, 1995.
Hurrell, J. W. and van Loon, H.: Decadal variations in climate associated with the north Atlantic Oscillation, Climatic Change, 36, 301–326, 1997.
Kaiser, G.: A Friendly Guide to Wavelets, Birkhauser, 300 pp., 1995.
Lorenz, E.: Empirical orthogonal functions and statistical weather prediction, Dept. of Meteor., MIT, Cambridge, Mass, Statistical forecasting Project, Sci. Rept. no. 1, 49 pp., 1956.
Luna, M. Y., Mart´ın, M. L., Valero, F., and Gonz´alez-Rouco, F.: Wintertime Iberian Peninsula precipitation variability and its relation to North Atlantic Atmospheric circulation, in: Detecting and modelling regional climate change and associated impacts edited by: Brunet, M. and L´opez, D., Springer-Verlag, Berlin, 369–376, 2001.
Maheras, P., Flocas, H. A., Patrikas, I., and Anagnostopoulou, C.: A 40 year objective climatology of surface cyclones in the Mediterranean region: spatial and temporal distribution, Int. J. Climatol., 21, 109–130, 2001.
Mallat, S.: A wavelet tour of signal processing, Academic Press, 637 pp., 1998.
Mart´ın, M. L., Luna, M. Y., Morata, A., and Valero, F.: North Atlantic teleconnection patterns of low-frequency variability and their links with springtime precipitation in the western Mediter-ranean, Int. J. Climatol., 24, 213–230, doi:10.1002/joc.993, 2004.
Morata, A., Mart´ın, M. L., Luna, M. Y., and Valero, F.: Self-similarity patterns of precipitation in the Iberian Peninsula, Theor. Appl. Climatol., 85, 41–59, doi:10.1007/s00704-005-0175-7, 2006.
Morata, A., Luna, M. Y., Mart´ın, M. L., Sotillo, M. G., and Valero, F.: Iberian autumnal precipitation characterization through observed, simulated and reanalysed data, Adv. Geosci., 16, 49– 54, doi:10.5194/adgeo-16-49-2008, 2008.
Morlet, G. A., Fourgeau, I., and Giard, D.: Wave propagation and sampling theory, Geophysics, 47, 203–236, 1982.
Palutikof, J. P., Kelly, P. M., Davies, T. D., and Halliday, J. A.: Impacts of spatial and temporal windspeed variability on wind energy output, J. Appl. Meteorol., 26, 1124–1133, 1987. Rodriguez-Puebla, C., Encinas, A. H., Nieto, S., and Garmendia, J.:
Spatial and temporal patterns of annual precipitation variability over the Iberian Peninsula, Int. J. Climatol., 18, 299–316, 1998. Rogers, J. C.: Patterns of low-frequency monthly sea level
pressure variability (1899–1986) and associated wave cyclone frequencies, J. Climate, 3, 1364–1379, 1990.
Rogers, J. C. and Mosley-Thomson, E.: Atlantic Artic cyclones and the mild Siberian winters of the 1980s, Geophys. Res. Lett., 22, 799–802, 1995.
Simmons, A. J. and Gibson, J. K.: The ERA-40 Project Plan, ECMWF, Reading, UK, ERA-40 Project Report Series No. 1, 2000.
Sotillo, M. G., Mart´ın, M. L., Valero, F., and Luna, M. Y.: Validation of an homogeneous 41-year (1961–2001) winter precipitation hindcasted dataset over the Iberian Peninsula: assessment of the regional improvement of global reanalysis, Clim. Dynam., 27, 627–645, doi:10.1997/s00382-006-0155-3, 2006.
Thuilleier, R. H.: Real-time of local wind patterns for application to nuclear-emergency response, B. Am. Meteorol. Soc., 68, 1111– 1115, 1987.
Ulbrich, U., Fink, A. H., Klawa, M., and Pinto, J. G.: Three extreme storms over Europe in December 1999, Weather, 56, 70–80, 2001.
Valero, F., Luna, M. Y., Mart´ın, M. L., Morata, A., and Gonz´alez-Rouco, F.: Coupled modes of large-scale climatic variables and regional precipitation in the Western Mediterranean in autumn, Clim. Dynam., 22, 307–323, doi:10.1007/s00382-003-0382-9, 2004.
Valero, F., Mart´ın, M. L., Sotillo, M. G., Morata, A., and Luna, M. Y.: Characterization of the autumn Iberian precipitation from long-term data sets: comparison between observed and hind-casted data, Int. J. Climatol., 29, 527–541, doi:10.1002/joc.1526, 2009.
von Storch, H. and Zwiers, F. W.: Statistical analysis in climate research, Cambridge Univesity Press, UK, 1999.
von Storch, H. and Navarra, A.: Analysis of climate variability, in: Applications of statistical techniques, Springer-Verlag, Berlin, 334 pp., 1995.
Wallace, J. M., Smith, C., and Bretherton, C. S.: Singular value decomposition of wintertime sea surface temperature and 500-mb height anomalies, J. Climate, 5, 561–576, 1992.
Weng, H. and Lau, K. M.: Wavelets, period doubling and time-frequency localization with application to organization of convection over the tropical western Pacific, J. Atmos. Sci., 51, 2523–2541, 1994.