1
N. Rjaibi
1,*and L.B.A Rabai
21
2
Institut Supérieur de Gestion de Tunis, Université de Tunis, Bardo 2000 Tunisia Institut Supérieur de Gestion de Tunis, Université de Tunis, Bardo 2000 Tunisia
Abstract
The Mean failure Cost (MFC) is a cascade of linear models that quantify security threats by taking into consideration the system’s stakeholders, security requirements, architectural components and threats. This quantitative cyber security model monetizes system’s security in terms of cost which may be lost due to security failure. The lack of quantitative security models in security decision making is a way to discover strengths and uniqueness of the MFC cyber security model. This paper intends to extend this measure into a security risk management model for ultra large systems and to exploit the previously presented MFC model’s characteristics in security decision making relying on a rigorous and quantifiable analysis of financial returns.
In fact, we intend to provide a possible solution to security problems using the MFC model in order to set the highest security priorities and choose the suitable countermeasures as well as computing the profitability of the proposed security countermeasures through the Return on Investment (ROI) based on the MFC’s values for each stakeholder. This will lead to monitoring the effectiveness of the proposed security countermeasures, ensuring the best solution choice by saving both time and money and providing a security decision maker with adequate justification to perform his security choice. The practical investigation is to be conducted thought the context of e-learning platforms.
Keywords: Management, Measurement, Security, Economics, Security Countermeasures, The Return On Investment, Decision
Making, e-Business Management.
Received on 8 May 2016, accepted on 12 June 2017, published on 29 November 2017
Copyright © 2017 Rjaibi et al., licensed to EAI. This is an open access article distributed under the terms of the Creative Commons Attribution licence (http://creativecommons.org/licenses/by/3.0/), which permits unlimited use, distribution and reproduction in any medium so long as the original work is properly cited.
doi: 10.4108/eai.29-11-2017.153389
*Corresponding author. Email: [email protected]
1. Introduction
Security is a serious necessity with a complex property; it needs to implement new strategies of management and assessment in every organization [4]. A variety of qualitative and quantitative risk management models, approaches and measures have been proposed in order to analyse security of both existing and potential future threats. As risk management models, we mention, the Single Loss Expectancy (SLE) [6], the Mean Failure Cost (MFC) [1, 7] The Bayesian Defense Graphs and Architectural Models [14], the Availability, Integrity, Confidentiality and
Authentication (AICA), the improving web application security model (IWAS) and AURUM [5] Ideally, information security will be enhanced by quantitative risk analyses [12, 13] in different cases, it is difficult to exclude the risk but it can be reduced, then the assessment result is useful for future business decisions [18]. However, quantifying security is a hard task and it is harder when the related system is complex [21]. In economic terms, the MFC is a risk management modelfor measuring the system’s security through risk assessment and quantification [11, 12]. If we consider the monetary value per unit of operational time any security breakdown involving the system’s stakeholders, security requirements, architectural
Research Article
2
components and threats will result in a considerable loss for each stakeholder.
For instance, it is essential for complex or ultra large systems to guarantee safety, quality and good image which could be made possible with the MFC model as a relevant and suitable device for quantitative decision-making. The MFC is a measure of cyber security suitable for e-services, complex and ultra large systems such a se-Learning, e-Goverenment, it considers variations by stakeholders, security requirements, architectural components, and threats [9, 10] to derive 3 matrices and a vector. The result will be a vector of the Mean failure cost per stakeholder. The loss of operation ($/H) for each stakeholder is computed. This quantitative model is a cascade of linear models to quantify security threats in term of loss that results from system vulnerabilities as [9]:
MFC = ST ◦ DP ◦ IM ◦ PT (1)
The MFC cyber security metric is the product of several factors (the stakes matrix ST, the dependency matrix DP, the impact matrix IM, and the threat vector PT) [11]
Where:
The stakes matrix (ST)
This matrix is composed of the list related to stakeholders and the list of security requirements. Relevant stakeholders who have internal or external usage of the system should fill each row, each cell expressed in dollar and which represents the loss incurred placed on requirement.
The dependency matrix (DP)
System Architects fill each row for this matrix; each cell represents the probability of failure with respect to the security requirement if a component has failed.
DP (Rj, Ck): The probability that the system fails to meet requirement Rj if component Ck is compromise.
The impact matrix (IM)
V&V Team fills each row for this matrix; each cell represents the probability of compromising a component given that a threat has materialized, it depends on the target of each threat, likelihood of success of the threat.
IM (Ck, Th): The probability that Component Ck is compromised if Threat Th has materialized.
The threat vector (PT)
Security Team fills each row for this vector; each cell represents probability of realization of each threat, it depends on perpetrator models, empirical data, known vulnerabilities, known counter-measures, etc.
PT (Ti): The probability that threat Ti materialized for a unit of operation time (one hour of operation).
Using this data, we compute the vector of mean failure costs using the formula: MFC = ST ◦ DP ◦ IM ◦ PT
Table 1. The Mean failure cost $ /hour (MFC)
Stakeholders Mean Failure Cost $ /hour ST 1 MFC1 $ /hour
ST i MFCi $ /hour
To understand the risk analysis provided by the MFC model, we need first to understand its conceptual logic; it reflects:
Independence with respect to stakeholders : varies from a stakeholder to another,
Independence with respect to security requirements clauses,
Independence with likelihood of failing distinct components,
Independence with likelihood of materializing a threat.
Our focus is to control the MFC matrices in order to minimize loss for a stakeholder which is due to security failure. Similarly, we intend to provide a security decision maker with the adequate measures and a clear justification to perform his choice. Therefore, we need to answer these questions: what is the critical security MFC’s matrix, and what security measures should be adopted? Then, how can we ensure our good choice to attenuate security failure?
This paper intends to exploit the previously presented MFC model’s characteristics in security decision making to provide a technical idea in monitoring the effectiveness of security countermeasures and ensuring a better choice. From a practical side, the aim is to experiment on a theoretical solution by detailing an example of an ultra large system, which is the e-learning environment [15]. Hence the focus is on:
1. Diagnosing and Setting the critical security priorities in the MFC matrices
2. Choosing the suitable security solutions 3. Ensuring a better security solution.
This paper is organised as follows: In section 2, we will try to present a brief description of our earlier works about quantifying security threats within e-learning platforms. In section 3, the focus is on the security problems diagnostic in the MFC matrices for the sake of identifying the main problems. Section 4presents the approach of computing the return on investment (ROI) of the proposed solution based on the MFC model. In section 5 we will finish with presenting the computational steps to make an appropriate security choice, which is, the calculation of the profitability through the return on investment; we will try to answer the questions: is the duplication of the web server or the DB server profitable?, what are the benefits of the system’s stakeholders? Finally we conclude by summarizing our results, and sketching directions for further research.
2. The Quantification of Security Threats:
An E-Learning Case Study
3 In previous works, we have defined and computed a value based cyber security metric that is the Mean Failure Cost (MFC) model. This quantitative cyber security metric was applied in a practical case study to the quantification of the security of e-learning standard platforms and applications [11].
To reach to a rigorous analysis of the system’s risk with a financial measure through MFC Model we need to answer these questions:
What is the list of stakeholders of such system?
Which security requirement does it need?
What is its architecture (components)?
What are the threats?
For standard e-learning systems, we have considered [16, 17, 20]
1. Four stakeholders [19, 22, 23]:
The system administrator
The teacher
The student
The technician
2. A list of security requirements including [24]:
Privacy
o Traces o Cardinality
o Consent and notification o Attribution
o Aggregation o Encryption o Confidentiality
o Anonymity
Integrity
o Software Integrity o Personal Integrity o Hardware Integrity o Data Integrity
Non-repudiation
Availability
o Resource allocation o Expiration
o Response time
Manageability
o Accountability o Security Auditing
Access control
o Authorization o Identification o Authentication
Physical Protection
Attack/Harm Detection
Usability
o Reduce risks
o Consistent APIs (Application Programming Interfaces) o Available security o Manageable security
Fair Exchange
Freshness
Secure Information Flow
Conformance
3. Six basic and common architectural components [25]:
The browser
The Web server
The Application server
The Database server
The Firewall server
The Mail server
4. A list of security threats including [18]:
Authentication attacks
o Broken authentication and session management.
o Insecure communication.
Availability attacks: Denial of service
Confidentiality attacks
o Insecure cryptographic storage. o Insecure direct object reference.
o Information leakage and improper error handling.
Integrity attacks o Buffer overflow.
o Cross Site Request Forgery. o Cross Site Scripting.
o Failure to restrict URL access. o Injection flaws.
o Malicious file execution.
The Mean failure Cost computes for each stakeholder of the given system his loss of operation ($/H). This quantitative model is a cascade of linear models to quantify security threats in term of loss that results from system’s vulnerabilities by taking into consideration the system’s stakeholders, security requirements, architectural components and threats as: MFC = ST ◦ DP ◦ IM ◦ PT
The MFC cyber security metric is the product of several factors: the stakes matrix (ST), the dependency matrix (DP), the impact matrix (IM) and the threat vector (PT). Where ST, DP and IM are three matrixes, PT is a vector.
To compute the MFC we can use four steps:
Step 1: Elaborate the stake matrix (ST): it is composed with the list of stakeholders and the list of security requirements. It
4
is filled by stakeholders according to the stakes they have in satisfying individual requirements; each cell expressed in dollars monetary terms and it represents loss incurred and/or premium placed on requirement.
ST (Hi, Rj): is the stake that stakeholders Hi has in meeting requirement Rj.
Step 2: Elaborate the dependency matrix (DP): each cell represents probability of failure with respect to a requirement given that a component has failed. It is filled by the system architect (i.e., cyber security operations and system administrators) according to how each component contributes to meet each requirement;
DP (Rj, Ck): The probability that the system fails to meet requirement Rj if component Ck is compromise.
Step 3: Elaborate the impact matrix (IM): each cell represents probability of compromising a component given that a threat has materialized, it is filled by analysts according to how each component is affected by each threat, it depends on the target of each threat, likelihood of success of the threat.
IM (Ck, Th): The probability that Component Ck is compromised if Threat Th has materialized.
Step 4: Elaborate the vector of threat emergences probabilities (PT) that represents the probability of emergence of the various threats, it is done empirically by simulating and/or operating the system for some length of time and estimating the number of threats that have emerged during that time. Each cell represents the probability of realization of each threat; it depends on perpetrator models, empirical data, known vulnerabilities, known counter-measures, etc.
PT (Ti): The probability that threat Ti materialized for a unit of operation time (one hour of operation).
Using these e-learning features and their empirical values, we have computed the mean failure cost using the MFC formula: MFC = ST ◦ DP ◦ IM ◦ PT
Table 2: The initial MFC application for e-learning systems
We can show now:
1. Who is the big loser (stakeholder)? 2. How many he/she can lose (Cost $)?
The big loser in this case study is the system administrator who lost 643,357 $/hour as shown in Table 2.
Because of our ever-increasing dependency on distance learning and its lack of a scientific and quantitative basis measure for cyber security. Table 2 addresses the first
security quantification of e-learning systems in the open literature.
The MFC measure can underline security risk assessment of large scale systems and consider all its security sub specifications such as stakeholders, requirements, threats, and components. Quantifying security risk with a financial measure is very interesting in computing and interpretation. When we measure in a structured way the risk regarding the dimensions of the considered system, we need to consider a variety of empirical works in the quantification process.
It highlights the definition of current e-learning security attributes. It analyzes its respective stakeholders, security requirements, decomposition of the architectural component and common potential threats. Then, it presents the quantification of the e-learning system’s using the computing of the mean failure cost metric and through an empirical study. Our contribution can be generalized to other practical e-systems because according to [18] an E-learning e-systems share similar characteristics with other e-services. These are the accessibility of service via the internet, the consumption of services by a person via the internet and the payment of a service by the consumer. Therefore, management security approaches to quantify security in e-learning are common with other e-services.
Next sections study practical ways to manage and reduce risk. It is possible to control the MFC through its factors in order to minimize and reduce its values. We need to choose the right measures for security priority and decide whether the considered solution is profitable or not.
3. Problems Diagnostic in the MFC
matrices: e-learning application case study
After computing the Mean Failure Cost, our aim is to reduce the cost that each stakeholder may lose because of security failure. It forms the control of the MFC matrices in order to minimize its quantitative values using the security measures classification [2]:
Controlling the stakes matrix: Using the measure of mitigation, which enables to reduce the impact of failures on costs incurred by users.
Controlling the dependency matrix: Using the measure of immunity, which enables to reduce probability of non-satisfaction of safety requirements even if a component fails.
Controlling the impact matrix: Using the measure of reinforcement, which enables to reduce the probability of failure of one or more components if threats occur. This can be done by duplicating architectural components.
Controlling the threat vector: Using the preventive measure, which enables to reduce the likelihood when a threat materializes. This type of measurement is provided by a set of actions as (the daily update antivirus, access control by a firewall, authentication words, changing the password periodically).
Stakeholders MFC’ $ /hour System administrator 643.457 Teacher 455.374 Student 81.768 Technician 208.878
5 To maximize the security management performance and decisions of the considered system in the appropriate time and without wasting the budget, we focus on diagnosing and setting the main security priorities of the MFC’s matrices, in particular its probabilities matrices namely the dependency matrix (DP) and the impact matrix (IM).
Therefore, we intend to select the critical matrix between IM and DP that contains the highest probabilities and thereby focusing on causes increasing the MFC values adopting the following computing steps:
Compute the MFC assuming that the DP matrix is perfect, that is to say no component fails for each security requirement.
Compute the MFC assuming that the IM matrix is perfect, that is to say no threat has materialized for each component.
Focus on the critical matrix, which has the highest MFC values, then search the suitable security solutions using the security measures classification. This is to reduce its probabilities values, and then reduce the MFC vector.
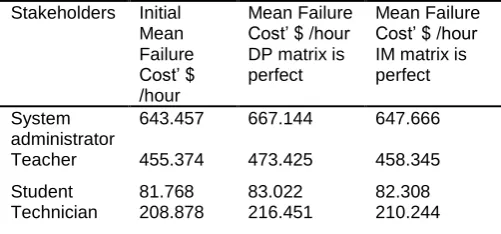
Table 3 illustrates the preceding steps.
Table 3: Security problems diagnostic of the MFC for e-learning systems case study
We note that the highest values of the MFC are observed when the DP matrix is perfect; we conclude that in this practical case study, the critical level’s problem resides on the impact matrix (IM) and this forms the most critical matrix.
According to the security measures classification [2], we choose as a solution: the duplication of the architectural hardware components to reduce the MFC values to the half. This technique is known as the redundancy technique, it is the duplication of critical components or functions of a system, in order to increase the system’s reliability. In general, it takes the forms of backup. The redundant elements work in parallel. This is recommended for complex computer systems and for ultra large systems with a great number of stakeholders.
At this stage, we set the critical security priorities in the MFC matrices and consequently choose the suitable security
solutions. Our next step is to focus on the relevance and pertinence of the e-learning architectural components redundancy as a security solution before wasting the budget; we must strengthen the right decision and justify it. We should ensure the best choice of the proposed security solution and indicate the gain for all the system’s stakeholders.
However, the problem confronting such a solution is how we can ensure a proper choice. The only remedy to the judgment of the good choice is the calculation of profitability through the return on investment (ROI) of the proposed security solution.
4. Computing the return on investment (ROI)
of the proposed solution based on the MFC
model: the Approach
The return on investment (ROI) is the measure to evaluate the efficiency of an investment [3]. The ROI is the benefit (return) of an investment divided by the cost of the investment; the result is expressed as a percentage or a ratio. The return on investment formula (ROI) is:
–
(2)
To explore in depth equation 2, we need to calculate the gain / period in order to define, for a given period, the sum of discounted profits (gain) of the project [3], as shown in equation (3).
The return on investment formula (ROI):
–
(3)
If we consider the factor money value in the time, the equation of the ROI is (4):
(4)
With:
W: The total number of discount periods.
w: The number of the period
B (w): (Revenue - Cost) during the period w.
d: The amortization period (discount rate)
C(0): Amount originally invested
The main problem in decision making is how to calculate periodically (period w) the gain: which is the gain of the proposed solution for a given stakeholder: B (w)?
The Mean failure cost is a solution to the problem; the MFC is the monetary value of a failure during a period generally 1 hour. If we implement a solution for a period w, the income generated by this solution is:
(5)
With:
Stakeholders Initial Mean Failure Cost’ $ /hour
Mean Failure Cost’ $ /hour DP matrix is perfect
Mean Failure Cost’ $ /hour IM matrix is perfect
System administrator
643.457 667.144 647.666
Teacher 455.374 473.425 458.345
Student 81.768 83.022 82.308 Technician 208.878 216.451 210.244
6 Bi (w): the benefit of the stakeholder i in period w.
Nbh: the number of hours when the system is functional.
W j: this is the period number j.
W j+1: this is the period number j+1.
MFCi(wj): is the mean failure cost of the stakeholder i occurring during period wj.
We adopt equation (4) and equation (5) to compute the ROI.
5. Computing the return on
investment (ROI) of the proposed solution
based on the MFC model: An E-learning
context case study
In this section, we calculate the profitability of the proposed security solution namely the duplication of the architectural hardware components to reduce the MFC values to half. This is done through the computing of the return on investment (ROI) based on the MFC’s values for all the system’s stakeholders. We can then answer and justify the question for an e-learning systems case study: how can we ensure the proper choice of the security solution?
5.1Defining the Security Solution
The purpose of defining the security solution is to duplicate one of the considered e-learning system components in order to strengthen the security of such a system. According to thee-learning system architecture, we need to choose between the DB server and the Web server as the main components, for further architectural components duplication.
We consider 3hypotheses in order to compute the gain of the security solution:
DB server and Web server have the same price ( = 3338 euro/ 4606,139 $)
The amortization rate of a component is 3 years
The gain per component is computed by semester.
S1 S2 S3 S4 S5 S6
First year Second years Third years
We compute, then the ROI / component, and decide which component among DB server or the Web server is subject to for duplication according to the defined budget.
In this case, the proposed security solution is facing a comparison between the DB server and the Web server duplication; one must assume that we can invest the same purchasing budget, since in the ROI calculation is taken into account that C (0) is the amount originally invested. Then we compare their profitability.
In case we have different prices, each case is verified separately. Then the decision maker chooses very sure the most profitable solution if he can meet the budget.
5.2 The Architectural Components Prices And
The Amortization Period
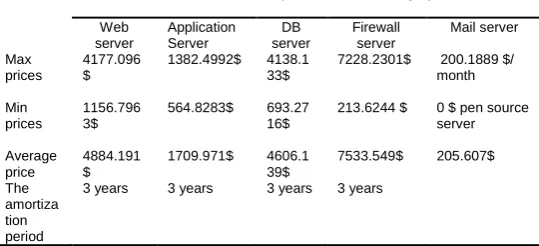
The standard architecture of an e-learning system includes six linked components namely: the browser, the web server, the application server, the Db server, the firewall server and the mail server. Table 4 shows details about the architectural components prices and the amortization period of current and standard e-learning systems. We adopt the Ldlc study [7] in order to fill the concrete data of table 4.
Table 4: The architectural components prices and the amortization period for an e-learning system
case study
Given the variety of the architectural components prices in the conducted study, we tried to take into consideration an average price ($) by assuming that the DB server and Web server have the same price to measure the profitability of the security solution properly.
5.3 Defining the Evolution of the Impact Matrix
for 3 Years
Only the impact matrix varies according to the MFC security problems diagnostic. The impact matrix IM of the MFC model can be filled by analyzing which threats affect which components, and assessing the likelihood of success of each threat. The initial empirical data shown in table 5forms the Probability that Component Ck fails once threat Tq has materialized [11].
When we duplicate the architectural components of our system, the probability that each one of these threats may materialize within a unitary operation time decreases to half for every period of time (S1 = one semester).Tables 6, 7, 8, 9, 10 and 11 show the probabilities evolution of the impact matrix for the web server and the DB server long six periods of time (Si: Semester i).
The Architectural Components of E-learning Systems
Web server
Application Server
DB server
Firewall server
Mail server
Max prices
4177.096 $
1382.4992$ 4138.1 33$
7228.2301$ 200.1889 $/ month
Min prices
1156.796 3$
564.8283$ 693.27 16$
213.6244 $ 0 $ pen source server
Average price
4884.191 $
1709.971$ 4606.1 39$
7533.549$ 205.607$
The amortiza tion period
3 years 3 years 3 years 3 years
7 Table 5: The initial Impact Matrix (IM)
Table 6: The Impact Matrix S1 (IM S1)
Threats Components
BroA InsC DoS CryptS DOR InfL Buff CSRF CSS FURL InjecF MFile No
Threats
Web server S1 0,1365 0,0685 0,0005 0,0000 0,0000 0,0000 0,1710 0,0035 0,0070 0,1135 0,0000 0,0000 0,0000
DB server S1 0,0935 0,0470 0,0025 0,0775 0,0775 0,0775 0,1170 0,0025 0,0000 0,0000 0,0045 0,0010 0,0000
Table 7: The Impact Matrix S2 (IM S2)
Threats Components
BroA InsC DoS CryptS DOR InfL Buff CSRF CSS FURL InjecF MFile No
Threats
Web server S2 0,0683 0,0343 0,0003 0,0000 0,0000 0,0000 0,0855 0,0018 0,0035 0,0568 0,0000 0,0000 0,0000
DB server S2 0,0468 0,0235 0,0013 0,0388 0,0388 0,0388 0,0585 0,0013 0,0000 0,0000 0,0023 0,0005 0,0000
Table 8: The Impact Matrix S3 (IM S3)
Threats Components
BroA InsC DoS CryptS DOR InfL Buff CSRF CSS FURL InjecF MFile No
Threats
Web server S3 0,0341 0,0171 0,0001 0,0000 0,0000 0,0000 0,0428 0,0009 0,0018 0,0284 0,0000 0,0000 0,0000
DB server S3 0,0234 0,0118 0,0006 0,0194 0,0194 0,0194 0,0293 0,0006 0,0000 0,0000 0,0011 0,0003 0,0000
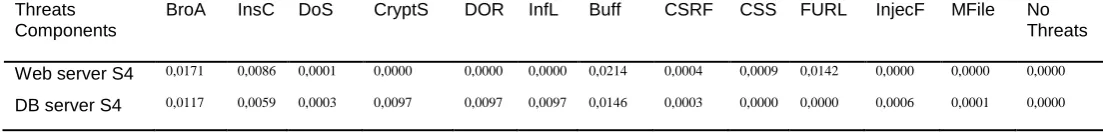
Table 9: The Impact Matrix S4 (IM S4)
Threats Components
BroA InsC DoS CryptS DOR InfL Buff CSRF CSS FURL InjecF MFile No Threats
Web server S4 0,0171 0,0086 0,0001 0,0000 0,0000 0,0000 0,0214 0,0004 0,0009 0,0142 0,0000 0,0000 0,0000
DB server S4 0,0117 0,0059 0,0003 0,0097 0,0097 0,0097 0,0146 0,0003 0,0000 0,0000 0,0006 0,0001 0,0000
Threats Components
BroA InsC DoS CryptS DOR InfL Buff CSRF CSS FURL InjecF MFile No
Threats
Browser 0,477 0,119 0,006 0,000 0,000 0,000 0,000 0,000 0,000 0,397 0,000 0,000 0,000
Web server 0,273 0,137 0,001 0,000 0,000 0,000 0,342 0,007 0,014 0,227 0,000 0,000 0,000
Application server 0,271 0,135 0,007 0,000 0,000 0,000 0,338 0,007 0,000 0,225 0,014 0,003 0,000
DB server 0,187 0,094 0,005 0,155 0,155 0,155 0,234 0,005 0,000 0,000 0,009 0,002 0,000
Firewall server 0,143 0,143 0,714 0,000 0,000 0,000 0,000 0,000 0,000 0,000 0,000 0,000 0,000
Mail server 0,375 0,187 0,009 0,028 0,028 0,028 0,000 0,009 0,000 0,312 0,019 0,005 0,000
No Failure 0,523 0,813 0,286 0,845 0,845 0,845 0,658 0,991 0,986 0,603 0,981 0,995 1,000
8
Table 10 The Impact Matrix S5 (IM S5)
Threats Components
BroA InsC DoS CryptS DOR InfL Buff CSRF CSS FURL InjecF MFile No
Threats
Web server S5 0,0085 0,0043 0,0000 0,0000 0,0000 0,0000 0,0107 0,0002 0,0004 0,0071 0,0000 0,0000 0,0000
DB server S5 0,0058 0,0029 0,0002 0,0048 0,0048 0,0048 0,0073 0,0002 0,0000 0,0000 0,0003 0,0001 0,0000
Table 11: The Impact Matrix S6 (IM S6)
Threats Components
BroA InsC DoS CryptS DOR InfL Buff CSRF CSS FURL InjecF MFile No
Threats
Web server S6 0,0043 0,0021 0,0000 0,0000 0,0000 0,0000 0,0053 0,0001 0,0002 0,0035 0,0000 0,0000 0,0000
DB server S6 0,0029 0,0015 0,0001 0,0024 0,0024 0,0024 0,0037 0,0001 0,0000 0,0000 0,0001 0,0000 0,0000
Table 12: MFC’Si application for e-learning systems for the web server
Stakeholders MFC0 $ /hour MFC’ S1 $
/hour
MFC’ S2 $ /hour
MFC’ S3 $ /hour
MFC’ S4 $ /hour
MFC’ S5 $ /hour
MFC’ S6 $ /hour
System administrator 643,457 643.449 643.445 643.443 643.442 643.442 643.442
Teacher 455,374 455.368 455.365 455.363 455.362 455.362 455.361
Student 81,768 81.768 81.767 81.767 81.767 81.767 81.767
Technician 208,878 208.875 208.874 208.873 208.873 208.873 208.872
Table 13: Gain for the web server
Stakeholders MFC 0 $ /hour Gain S1 Gain S2 Gain S3 Gain S4 Gain S5 Gain S6
System administrator
643,457 0,192 0,288 0,336 0,36 0,36 0,36
Teacher 455,374 0,144 0,216 0,264 0,288 0,288 0,312
Student 81,768 0 0,024 0,024 0,024 0,024 0,024
Technician 208,878 0,072 0,096 0,12 0,12 0,12 0,144
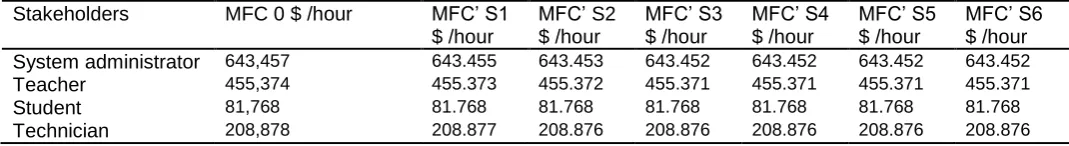
Table 15: MFC‘Si application for e-learning systems for the DB server
Stakeholders MFC 0 $ /hour MFC’ S1
$ /hour
MFC’ S2 $ /hour
MFC’ S3 $ /hour
MFC’ S4 $ /hour
MFC’ S5 $ /hour
MFC’ S6 $ /hour
System administrator 643,457 643.455 643.453 643.452 643.452 643.452 643.452
Teacher 455,374 455.373 455.372 455.371 455.371 455.371 455.371
Student 81,768 81.768 81.768 81.768 81.768 81.768 81.768
Technician 208,878 208.877 208.876 208.876 208.876 208.876 208.876
9
The initial impact matrix (IM) of the MFC measure appearing in table 5 is filled using an empirical study from [2]. Each cell represents probability of compromising a component given that a threat has materialized. Each row for this matrix is filled by analysts according to how each component is affected by each threat. It depends on the target of each threat and likelihood of success of the threat.
IM(Ck, Th): The probability that Component Ck is compromised if Threat Th has materialized.
Only the impact matrix (table 5) varies according to the MFC security problems diagnostic. It forms the critical level’s problem. Using the security measures classification [2], we choose as a solution to duplicate the architectural hardware components to reduce the MFC values to the half.
Therefore the probability of the IM matrix decreases in half every period of time (6 periods) as shown in six tables: Tables (6-11). They show the probabilities evolution of the impact matrix for the web server and the DB server during six periods of time.
5.4 Monitoring the Effectiveness of the Web
Server Duplication
Computing The MfcSi For The Web Server
/ Period
Using the new impact matrix for the web server, we can now compute the resulting vector of Mean Failure Costs using the formula: MFC’ = ST ◦ DP ◦ IM’ ◦ PT
Given the initial MFC values (MFC 0 $ /hour) calculated in the quantitative risk management process initially. We intend to compute the MFC’Si for the web server for six semesters taking into consideration the modified impact matrix from tables (6, 7, 8, 9, 10 and 11) for every semester.
We apply the above formula: MFC’Si (Web server) = ST * DP*IMSi* PT
The results are shown in Table 12.
Table 12, shows that the MFC’Si decreases in time, this implies that the amount of loss (cost $/hour) that results from security breakdown caused by threats and vulnerabilities decreases for each stakeholder. A strong justification will be added when we evaluate the profitability or the financial efficiency for each stakeholder using the ROI formula.
Computing The Gain For The Web Server / Period
To compute the gain for the web server / semester we refer to the idea of using the difference between two MFC values:
Gain Si = the initial MFC - MFC’Si (Web server) * Nbh
Table 13, shows the gain for the web server duplication in six semesters, Nbh forms the number of hours when the
system is functional, in our case of e-learning systems, the platforms should be available throughout the 24 hours. We note also that the gain increases in time and it is significant especially for the system administrator and the teacher.
The Return On Investment Of The Web Server
We compute now the return on investment of the Web server architectural component using the equation (4)
(4)
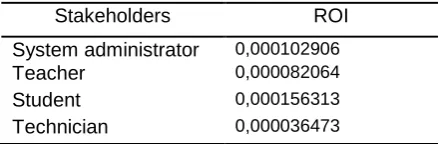
Table 14: The return on investment of the Web server
According to the ROI analysis presented in table 14which forms a positive financial term for all stakeholders, we can affirm that is a good solution to adopt the duplication of the Web server. All stakeholders are winners: the student and the system administrator are big winners. It is a meaningful justification for security business decisions for e-learning systems.
5.5 Monitoring the Effectiveness Of The DB
Server Duplication
Computing the MFCSi for the DB server
Using the new impact matrix for the DB server from tables (6, 7, 8, 9, 10 and 11) for every semester, we can now compute the resulting vector of Mean Failure Cost using the formula: MFC’ = ST ◦ DP ◦ IM’ ◦ PT
The Mean Failure Cost for e-learning Systems/ semester: MFC’Si (DB server) = ST * DP* IMSi* PT
The results are shown in Table 15:
Table 15, shows that the MFC’Si decreases in time, it reflects the decrease of the loss for each stakeholder as a monetary value per unit of operational time (cost $/hour/semester). Now we need to compute the ROI for all the system’s stakeholders and then deduce if we can adopt the proposed solution or not.
Computing the gain for the DB server
Using the new values of the MFC vector of table 15, we can now compute the gain for the DB server for each
Stakeholders ROI
System administrator 0,000102906
Teacher 0,000082064
Student 0,000156313
Technician 0,000036473
10
stakeholder as presented in table 16.The gain for the DB server / semester is:
Gain Si=The initial MFC (MFC 0 $/h) - MFC’Si (DB server)* Nbh
Table 16: Gain for the web server
The overall gains of all stakeholders of the web server presented in table 16 are positive by considering the number of usage hours of the e-learning system which is 24hours. By comparing the four stakeholders we note that the system administrator is still winner in terms of time, also the teacher and technician are winners, nevertheless a student is indifferent (Gain =0), the proposed solution of the DB server duplication is not profitable to him/her. This affirmation can be strongly justified by computing the ROI.
The return on investment of the DB server
Using previous data and equation (4), we derive the ROI of DB server for the four stakeholders; the results are presented in table 17 and are non-significant. Nevertheless, they are sufficient for the stakeholders to justify the investment.
Table 17: The return on investment of the DB server
Stakeholders ROI
System administrator 0,000033868 Teacher 0,000019539 Student 0,000000000 Technician 0,000014329
We note that the ROI values presented in table 17 are positive for all stakeholders. Therefore, it is a good solution to adopt the duplication of the DB server. All stakeholders are winner: the system administrator is the big winner but the student is not. Making decision on the hardware acquisition depends now on the financial return of the Web server and the budget to be invested.
Discussion and decision
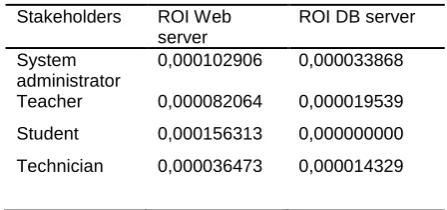
A summary of the ROI’s values for all the system’s stakeholders of the proposed security solution which is the choice between the duplication of the web server or the DB server are given in Table 18.
Table 18: The return on investment of the DB server and the Web server
Stakeholders ROI Web server
ROI DB server
System administrator
0,000102906 0,000033868
Teacher 0,000082064 0,000019539
Student 0,000156313 0,000000000
Technician 0,000036473 0,000014329
Given that all the presented ROIs of table 18 are positive, the duplication of the web server and/or the DB server is worthwhile for the four stakeholders.
The ROI values are all significant except for the student; he is not winner when we adopt the DB server acquisition. The student is the core stakeholder for e-learning systems and must gain considerably from the duplication solution.
We can affirm that the duplication of the web server component is a good solution rather than the duplication of the DB server. We can duplicate both according to the invested budget. In case of choosing between them, we choose the web server because its ROI’s values seem more significant for all stakeholders.
6 Conclusions
This paper focuses on the management of security measures priorities and the diagnostic of the suitable ways to control the MFC matrices in order to implement the most appropriate countermeasures for a practical case study of e-learning systems.
The MFC cyber security metric is the product of several factors (the stakes matrix ST, the dependency matrix DP, the impact matrix IM, and the threat vector PT). It is possible to control the MFC through its factors in order to minimize and reduce its values. We need to choose the right measures for security priority and decide whether the considered solution is profitable or not. This would lead to maximize the security management performance and decisions of the considered system in the appropriate time and without wasting the budget.
To implement the proposed countermeasures we must invest through software and / or hardware solutions but we need to ensure the proper choice of the considered solution through the computing of the return on investment (ROI) based on the MFC’s values. We recall
Stakeho lders
MF
C
0
$
/h
o
u
r
Ga
in
S
1
Ga
in
S
2
Ga
in
S
3
Ga
in
S
4
Ga
in
S
5
Ga
in
S
6
System administ rator
643,457 0,048 0,096 0,12 0,12 0,12 0,12
Teacher 455,374 0,024 0,048 0,072 0,072 0,072 0,072
Student 81,768 0 0 0 0 0 0
Technici an
208,878 0,024 0,048 0,048 0,048 0,048 0,048
11 that the MFC’s values represent for each stakeholder the amount of loss that results from security breakdown caused by threats and vulnerabilities. That’s why it is useful to deduce the gain /period, which is the difference between two successive values of the MFC. Finally we compute the ROI for all the system’s stakeholders and we deduce if we can adopt the proposed solution or not.
The calculation of the return on investment based on the MFC values is a good solution for decision making for the system’s stakeholders. It is an optimal solution for simple and complex systems in which users/ stakeholders have different benefit. In these cases, security management decisions can be easily, quickly managed and justified.
7 Future Works
Since our approach provided encouraging results, this work can be extended and completed to study and monitor the effectiveness of security countermeasures of the other remaining architectural components like the firewall components. This is a good way to ensure quantitatively the proper choice of the security solution without wasting the budget.
Next future plans are to explore such opportunities to control the other factors of the MFC model in order to minimize its values, therefore, leading to more secure and safe e-systems. This helps us in monitoring the effectiveness of security countermeasures, maximizing management performance and supporting the most suitable decisions in business analysis.
References
[1] Aissa, A.B., Abercrombie, R.K., Sheldon, F.T., and Mili, A. (2011).Defining and Computing a Value Based Cyber-Security Measure. Information Systems and e-Business Management
Volume 10, Issue 4, pp 433-453 , 2012-12-01, DOI: 10.1007/s10257-011-0177-1, Springer-Verlag, 2011.
[2] Aissa, A.B. (2012). Vers une mesure économétrique de la sécurité des systèmes informatiques. Doctoral dissertation Faculty of Sciences of Tunis submitted Spring 2012.
[3] Botchkarev, A. and Andru, P. (2011).A Return on
Investment as a Metric for Evaluating
InformationSystems:Taxonomy and Application.
Interdisciplinary Journal of Information, Knowledge, and Management Volume 6, 2011.
[4] Cummings, M.C., McGarvey, D.C. andVinch, P.M.
(2006). Homeland Security Risk Assessment Volume II.Methods, Techniques, and Tools, 2006.
[5] Ekelhart, A., Fenz, S., and Neubauer, T. (2009). AURUM: A Framework for Information Security Risk Management. In Proceedings of the 42nd Hawaii International Conference on System Science, 2009.
[6] Karabacak, B., Sogukpinar, I. (2005). ISRAM: information security risk analysis method. Computers & Security, Elsevier.Vol 24, pp. 147-159, 2005.
[7] Ldlc(2014).http://www.ldlc.com/informatique/ordinateur-de-bureau/serveur/c4254/, Accessed June 2014
[8] Mili, A. and Sheldon, F.T.: Measuring Reliability as a Mean Failure Cost. in Proc. HASE, pp.403-404, 2007.
[9] Rabai, L.B.A., Rjaibi, N. and Aissa, A.B. (2012). Quantifying Security Threats for E-learning Systems. IEEE Proceedings of International Conference on Education & E-Learning Innovations- Infrastructural Development in
Education (ICEELI' 2012-
http://www.iceeli.org/index.htm), July 1-3, 2012,
Sousse,Tunisia, Print ISBN: 978-1-4673-2226-3,
doi: 10.1109/ICEELI.2012.6360592.
[10] Rjaibi, N. and Rabai, L.B.A. (2011).Toward A New Model For Assessing Quality Teaching Processes In E-learning, Proceedings of 3rd International Conference on Computer
Supported Education, CSEDU'2011, Vol.2,
(www.csedu.org), Noordwijkerhout, The Netherlands; 6-9 May 2011, page 468-472. SciTePress, 2011, ISBN: 978-989-8425-50-8.
[11] Rjaibi, N., Rabai, L.B.A., Aissa, B.A. and Mili, A. (2013). Mean failure Cost as a Measurable Value and Evidence of Cybersecurity: E-learning Case Study. International Journal of Secure Software Engineering (IJSSE). 4(3), 64-81, July-September 2013, Website: http://www.igi-global.com/ijsse. doi:10.4018/jsse.2013070104.
[12] Rjaibi, N. and Rabai, L.B.A. (2015), Developing a Novel Holistic Taxonomy of Security Requirements, Proceedings of the 2015 International Conference on Soft Computing and Software Engineering (SCSE'15), March 5-6 2015, Elsevier Procedia Computer Science Journal (ISSN: 1877-0509).Science Direct.
[13] Scheier, B.: Beyond Fear: Thinking Sensibly about Security in an Uncertain World. Springer-Verlag, New York, Inc, 2003.
[14] Sommestad, T., Ekstedt, M., and Johnson, P. (2009).Cyber security risks assessment with bayesian defense graphs and architectural models,In Proceedings 42nd Hawaii International Conference on System Sciences, Waikoloa, Big Island, Hawaii, 2009, pp. 1-10.
[15] Weippl, E. (2005). Security In E-Learning, eLearn Magazine, Association for Computing Machinery (ACM), article from, vol. 16, p. 03-05, 2005.
[16] Kumar S. and Dutta K. (2011).Investigation on Security InLms Moodle. International Journal of Information Technology and Knowledge Management, 4(1), 233-238.
[17] Machado M., Tao E. (2007). Blackboard vs. Moodle: Comparing User Experience of Learning Management Systems. 37th ASEE/IEEE Frontiers in Education Conference, October 10 – 13, 2007, Milwaukee, WI
12
[18] MohdAlwi N.H. and Fan I.S. (2010). E-Learning and Information Security Management.International Journal of Digit Society (IJDS), 1(2).
[19] Naaji A., herman C. (2011). Implementation of an e-learning system: Optimization and security Aspects. Proceedings of the 15th WSEAS International Conference on Computers, Part of the 15th WSEAS CSCC Multiconference.
[20] Ngai E.W.T., Poon J.K.L., Chan Y.H.C. (2007). Empirical examination of the adoption of WebCT using TAM, Computers & Education, Elsevier, 48, 250–267.
[21] Nickolova M., Nickolov E. (2007). Threat model for user security in e-learning systems.International Journal "Information Technologies and Knowledge, 1.
[22] Wagner N., Hassanein K. and Head M. (2008). Who is responsible for E-Learning Success in Higher Education? A Stakeholders' Analysis. Educational Technology & Society, 11(3), 26-36.
[23] Caron P., Couture M., Grant A. (2005). Architecture pour le Développement et l’Implantation d’un Environnement de Formation Continue en Ligne (LOLE). Journées Francophones d’Informatique Médicale, Lille 12-13.
[24] Defta C. L. (2011). Information security in E-learning Platforms, Procedia Social and Behavioral Sciences, Elsevier, 15, 2689–2693.
[25] Selvi T. R., Balasubramanian Dr. N. V., Manohar G. T. (2008). Framework and Architectural Style Metrics for Component Based Software Engineering. Proceedings of the International Multi Conference of Engineers and Computer Scientists, Vol I, IMECS 2008, 19-21 March, 2008, Hong Kong.