Asian Journal of Pharmaceutical Research and Development
(An International Peer-Reviewed Journal of Pharmaceutical Research and Development)www.ajprd.com
ISSN 2320-4850
Research Article
FORMULATION AND
IN-VITRO
EVALUATION OF
FLOATING TABLETS OF RANITIDINE HYDROCHLORIDE USING
HPMC AND CHITOSAN
Sanjay K. Sharma*, Sourabh Mandowara, Vaibhav Saxena, Manish Jaimini, Bhupendra Singh Chauhan
Department of Pharmaceutics, Jaipur College of Pharmacy, ISI-15, RIICO, Sitapura Institutional Area, Sitapura, Jaipur (Raj.), India.
Received: June 2014 Revised and Accepted: June 2014
ABSTRACT
Floating drug delivery system is one of the promising routes for drugs delivery with an absorption window in the stomach or in the upper small intestine. Prolonged gastric retention improves bioavailability, reduces drug dose in comparison to conventional dosage form and beneficial for drugs which have solubility problem at high pHand unstable at high pH environment. In present investigation, an attempt was made to deliver Ranitidine hydrochloride via floating drug delivery system to the vicinity of absorption site by prolonging the gastric residence time of the dosage form. Floating tablet was prepared by direct compression method using different grades of HPMC and Chitosan and varying concentration of sodium bicarbonate alone and in combination with citric acid (gas generating) agents along with MCC or lactose alone as filler. Tablets were subjected to various evaluation parameters such as hardness, friability, thickness, tablet density, weight variation, assay, floating property study, swelling study, in vitro drug release study. It was revealed that tablets of all batches had acceptable physical parameters. From in vitro dissolution study tablets of batch F5 and F10 were selected as an optimum batches and evaluated for further parameter like effect of hardness on floating lag time, effect of position of paddle on drug release, treatment of dissolution data with different kinetic equations.
Keywords: Floating Drug Delivery systems, Gastric Retention, Ranitidine HCl, Chitosan, HPMC.
INTRODUCTION
loating drug delivery system is one of the promising routes for drugs delivery with an absorption window in the stomach or in the upper small intestine. FDDS is gastro-retentive dosage forms that prolong gastric residence time to achieve sufficient drug bioavailability. FDDS have a lower density than gastric fluids and thus remain buoyant in the stomach without affecting the gastric emptying rate for a prolonged period of time and release the drug in sustained manner from swollen polymer matrix.
*For corrospondance: Sanjay K. Sharma
Department of Pharmaceutics,
Jaipur College of Pharmacy, Jaipur (Raj.), India.
Email ID: [email protected]
such as variable gastric emptying and there is significant chance of dose dumping for drugs which have low therapeutic index and sticking of tablets on GI tract is also one of the problems associated with single unit system [2].
Ranitidine hydrochloride is used as a histamine H2-receptor antagonist in the
treatment of peptic ulcer, duodenal ulceration and Zollinger-Ellision syndrome. Ranitidine hydrochloride is a widely used anti-ulcer drug with low molecular weight and biological half life 1.6-2.4 hours. Conventional dose of 150 mg (Ranitidine) has demonstrated inhibition of gastric acid secretion after 5 hour but not after 10 hour. The bioavailability of Ranitidine following oral administration is about 50% [3]. It has been reported that Ranitidine hydrochloride has better absorption in upper part of GI tract and peptic ulcers and disease is mainly in stomach and upper part of GIT origin. Hence in the present work, an attempt has been made to design an alternative dosage form for Ranitidine in the form of floating tablets to overcome the above said disadvantages of conventional Ranitidine tablets and to achieve the prolonged drug therapy.
MATERIALS AND METHOD:
Ranitidine HCl was obtained from Glaxo Smithkline, Nashik. Methylcellulose A4M, HPMC K4M, HPMC K1M, HPMC K 100M were obtained from Colorcon Asia Pvt. Ltd, Verna. Gaur gum was purchased from Loba Chemie, Mumbai. Microcrystalline Cellulose was purchased from Singnet Chemical, Company Mumbai. All the ingredients were of analytical grades.
Identification of Drug [4]:
UV absorption:
The solution containing 10µg/ml of drug in distilled water was prepared and absorption was taken at 313 nm and ratio of absorptivity was calculated which should be less than 3%.
Solubility analysis:
Preformulation solubility analysis was done, which include the selection of suitable solvent system to dissolve the respective drug.
Melting Point determination:
Melting point determination of the obtained sample was done because it is a good first indication of purity of the sample since the presence of relatively small amount of impurity can be detected by a lowering as well as widening in the melting point range.
Drug excipient compatibility study:
The drug excipient compatibility study was performed by using FT-IR spectrometer. The sampling technique was mixing the active pharmaceutical ingredient and excipient mixture with potassium bromide and forming pellets and the FTIR spectra over the wavelength range 4000–400 cm−1 were recorded using a FTIR spectrometer.
Preparation of Floating Tablets:
Floating matrix tablets containing Ranitidine HCl were prepared by direct compression technique using varying concentrations of different grades of different polymers with different concentration of sodium bicarbonate alone and in combination with citric acid and varying concentration of MCC and lactose alone.
All the ingredients except magnesium stearate were blended in glass mortar pastle uniformly. After the sufficient mixing of drug as well as other components, magnesium stearate was added and further mixed for additional 2-3 minutes. The tablets were compressed with 14 mm punch using Hydraulic press. The average tablet weight of tablets was kept constant for formulations F1 to F10, which was 600 mg. The composition of all formulation was given in Table1.
Table1: Composition of formulation.
Ingredients F1 F2 F3 F4 F5 F6 F7 F8 F9 F10
Ranitidine HCl Methylcellulose A 4M
HPMC K4M HPMC K15M HPMC K100 M Gaur gum Chitosan NaHCO3 Citric acid Lactose MCC Mg stearate 219 -- 198 -- -- -- -- 60 -- -- 117 6 219 -- 99 99 -- -- -- 60 -- -- 117 6 219 198 -- -- -- -- -- 60 -- -- 117 6 219 -- -- 198 -- -- -- 60 -- -- 117 6 219 -- -- -- 180 -- -- 60 -- -- 135 6 219 -- -- -- -- -- 198 30 -- 147 -- 6 219 -- -- -- -- -- 198 30 -- -- 147 6 219 -- -- -- -- -- 210 60 -- -- 105 6 219 -- -- -- -- 30 210 60 -- -- 75 6 219 -- -- -- -- 42 210 34 26 -- 63 6
Total(mg) 600 600 600 600 600 600 600 600 600 600
Evaluation of Floating Tablets:
Tablets of all prepared batches were evaluated for following official and unofficial parameters.
Appearance:
Tablets of all batches were evaluated for their appearance. Any cracks on the tablet were examined by using magnifying lens.
Hardness:
The resistance of tablets to shipping or breakage under conditions of storage, transportation and handling before usage depends on its hardness. The hardness of tablet of each formulation was checked by using Monsanto hardness tester. For each batch three tablets were tested. The hardness was measured in terms of Kg/cm2 [5].
Friability:
Friability is the measure of strength of tablet and is related to tablets ability to withstand shock and abrasion during the handling of manufacturer, packaging shipment and consumer use.
Method: Twenty tablets were weighed and placed in the Roche friabilator and apparatus
was rotated at 25 rpm for 4 minutes. After revolutions the tablets were dedusted and weighed again. The percentage friability was measured using the formula, [6]
% F = {1-(Wo/W)} ×100
Where, % F = friability in percentage. Wo = Initial weight of tablet.
W = weight of tablets after revolution.
Thickness:
Crown thickness of tablet is important for uniformity of tablet size. It was measured using Dial caliper in mm. The crown thickness of tablets were measured to determine the density of tablet. For each batch three tablets were tested [7].
Tablet density:
Tablet density is an important parameter for floating tablets. It is said that tablet will only float when its density is less than that of gastric fluid (1.004). The density was determined using following relationship: V = π.r2.h
d = m/V
Where, V= volume of tablet (cc). r = radius of tablet (cm).
Weight Variation:
A tablet is designed to contain a specific amount of drug in a specific amount of tablet formula. To check the proper amount of drug in tablet the weight of tablet is routinely measured by weight variation test.
Method: Twenty tablets were randomly selected from each batch and individually weighed. The average weight and standard deviation of 20 tablets was calculated. The batch passes the test for weight variation test if NMT two of the individual tablet weights deviate from the average weight by more than 5% and none deviate by more than twice of that percentage [7].
Floating Property Study:
The time taken for dosage form to emerge on surface of medium called floating lag time (FLT) or buoyancy lag time (BLT) and duration of time by which the dosage form constantly emerge on surface of medium called Total floating time (TFT).
Method: One tablet from each formulation batch was placed in 1000 ml beaker containing 900 ml of 0.1 N HCl (pH 1.2). BLT and TFT was noted. Average of three reading was reported as result for BLT only [8].
Swelling Study:
Swelling of tablet excipients particles involves the absorption of a liquid resulting in an increase in weight and volume. Liquid uptake by the particle may be due to saturation of capillary spaces within the particles or hydration of macromolecule. The liquid enters the particles through pores and bind to large molecule; breaking the hydrogen bond and resulting in the swelling of particle. The extent of swelling can be measured in terms of % weight gain by the tablet. For swelling study F1 and F4 (F1 to F5) and F7 and F8 (F6 to F10) were selected.
Method: One tablet was weighed and placed in a beaker containing 200 ml of distilled water. After each hour the tablet was removed
from beaker and weighed again upto 5 hours. The % weight gain by the tablet was calculated by the formula,
Swelling Index (S.I.) = {(Wt-Wo)/Wo} ×100 Where, S.I. = swelling index.
Wt = weight of tablet at time t. Wo = we
In-Vitro Dissolution Study:
Dissolution of the tablet of each batch (F1 to F10) was carried out using USP type II apparatus using paddle.
Method: Nine hundred ml of 0.1 N HCl (pH 1.2) was filled in a dissolution vessel and the temperature of the medium were set at 370 + 0.50 C. One tablet was placed in each dissolution vessel and the rotational speed of paddle was set at 100 rpm. The 1 ml of sample was withdrawn at predetermined time interval for 10 hours and same volume of fresh medium was replaced. The samples were analyzed for drug content against 0.1 N HCl as a blank at λ Max of 313.0 nm using UV
spectrophotometer. The content of drug was calculated from standard curve. The % cumulative drug release was calculated.
RESULTS AND DISCUSSION
Floating tablets of Ranitidine HCl were prepared and evaluated with a view to obtained controlled release of Ranitidine HCl in order to increase its bioavailability.
In the present work, preformulation studies on the obtained samples of drug along with various excipients were carried out prior to the actual formulation of floating tablets. The best formulation were selected and considered for further studies. These formulations were subjected to various evaluation parameters.
IDENTIFICATION TESTS:
U.V. Absorption: The ratio of absorptivities was found 2.6, which is less than 3%.
soluble in water, methanol and ethanol (95%). Sparingly soluble in dehydrated alcohol while very slightly soluble in chloroform and dichloromethane.
Melting point determination:
Melting point of the obtained sample was found at about 131º C which is in the reported range that is 130 to 134º C, which indicating absolute purity of drug sample.
Compatibility Study:
Compatibility studies were performed using infra-red spectrum. The I.R. spectrum of pure drug and physical mixture of both and polymer were taken for study. The characteristics peaks of pure drug such as 1193.6, 1219.94, 1219.68,
1573.52, 2560, 2638.85 (Ranitidine HCl, KBr disk) were also obtained in the I.R. spectrum of physical mixture of both drug and polymer without any abnormal peaks as shown in Preformulation I.R. study. This study reveals that there was no interaction between drug and polymer, which were used in formulation of floating tablets. Out of all the formulations, the best formulations were selected; tablets from these formulations were powdered and again taken for I.R. study. They showed presence of above characteristic peaks of pure drug and absence of any abnormal peaks in I.R. spectrum, as shown in after formulation I.R. study. This study again reveals that the drug and formulation excipients were compatible
with each other.
Figure1: FT-IR Spectra of Ranitidine HCL
Figure3: IF-IR Spectra of RAN+HPMC K15M
Figure4: FT-IR Spectra of RAN+Chitosan
Figure5: FT-IR Spectra of RAN + Gaur GUM
Preparation of Standard Calibration Curve of Ranitidine HCl:
Scanning of Ranitidine HCl in 0.1 N HCl: From the scanning of 10µg/ml of Ranitidine
HCl in 0.1 N HCl (pH 1.2) the λmax was found
Figure6: Scan of Ranitidine HCl in 0.1 N HCl. (pH 1.2)
Evaluation of Floating Tablets:
Appearance: No cracks have been found. It was observed that formulated tablets in all batches were elegant and circular in shape.
Hardness: The measured hardness of tablets of each batch was ranged from 4 to 5 kg/cm2. This ensures good handling characteristics of all tablets.
Friability: Friability study was performed on each formulation and % friability were measured. The values ranged from 0.60-0.75. This indicates that the tablets were found to be friable.
Thickness: The values ranged from 4.01-4.16 mm for F1 to F10 indicating that the crown thickness was uniform.
Tablet Density: Tablet density was measured. The average value of three tablets is reported as tablet density in Table2. All batches showed density in range of 1.01-1.05 and which is slightly greater than that of gastric fluid (1.004).
Weight Variation: Weight variation test was performed on each batches. The values ranges from 597 – 601 mg for F1 to F10 . All values are found to be within 5% deviation. This indicates good uniformity in weight and results were reported in Table2.
Floating Property Study:
From the results of BLT (n=3) and TFT it was shown that all batches of tablets except tablets of batch F11 and F12 had good floating properties which might be due to absence of
sodium bicarbonate in later formulations. The finding were also supported by study of Baumgartner et al. who reported that incorporation of sodium bicarbonate helps to improve floating properties by reacting with gastric fluid when dosage form comes in contact and produce carbon dioxide gas which entrapped inside the matrices leads to increase in volume of dosage form resulting in lowering of density and dosage form starts to float. From the results of BLT (n=3) from F1 to F5 it was concluded that the BLT increases with increase in viscosity of polymers (only HPMC grades), F3 which contain methyl cellulose A 4M is exception. BLT for F3 was found to be 226 sec. F1 showed lowest BLT because of HPMC K4M while F5 showed highest BLT because of HPMC K100M F4 took high BLT than F2 because of lower amount of HPMC K15 in later formulation. While from F6 to F10 it was concluded that F6 and F7 took BLT near about same that might be due to same amount of chitosan in both formulation. F6 and F7 took high BLT than F8, F9 and F10 that might be due to incorporation of high amount of effervescent agents in later formulations. F10 took low BLT than F9 and F8 that might be due to incorporation of sodium bicarbonate along with citric acid.
methylcellulose, which has viscosity of 4000 cps i.e. same as with HPMC K4M but there is difference in molecular weight and matrix
forming properties, may be due to this tablets of F3 dissolved in 5.5 hours.
Table2: Physical Properties of Tablets
Batches % Friability Thickness (Mm) N=3
Tablet Density (G/Cc) N=3
Average Weight
(Mg) + S.D.
BLT
(Sec) N=3 TFT
(Hr)
Drug Content (%)
F1 0.69 4.08 1.01 599 ± 0.0010 37 >12 99.1
F2 0.72 4.10 1.02 597 ± 0.0018 41 >12 98.5
F3 0.65 4.13 1.03 600 ± 0.0002 226 5.5 101.5
F4 0.70 4.06 1.02 598 ± 0.0016 60 >12 99.1
F5 0.69 4.11 1.04 600 ± 0.0003 180 >12 99.5
F6 0.62 4.05 1.05 599 ± 0.0005 708 >12 98.9
F7 0.75 4.03 1.04 599 ± 0.0008 711 >12 100.0
F8 0.60 4.16 1.04 600 ± 0.0002 390 >12 99.0
F9 0.72 4.05 1.05 598 ± 0.0012 410 >12 97.0
F10 0.70 4.01 1.05 601 ± 0.0009 336 >12 97.5
Swelling Study:
Swelling study was performed on F1, F4, F7 and F8 for 5 hour. Plot of swelling index against time (hr) depicted as Figure7.
From the results of swelling study it was concluded that swelling increase as the time passes because the polymer gradually absorbed water due to hydrophilic in nature and swell. In F1 and F4, the higher swelling index was found for tablets of batch F4 which
contain HPMC K 15M having nominal viscosity of 15,000 cps while former contain same amount of HPMC K 4M having nominal viscosity of 4,000 cps. Thus, the viscosity of polymer had major influence on swelling process, matrix integrity as well as floating capability, hence from above result it can be concluded that the linear relationship may be there in between swelling process and viscosity of polymer.
0 50 100 150 200 250
0 1 2 3 4 5
S
w
e
ll
in
g
In
d
e
x
(
%
)
Time (hours)
F 1 F 4
In-vitro Drug Release Profile:
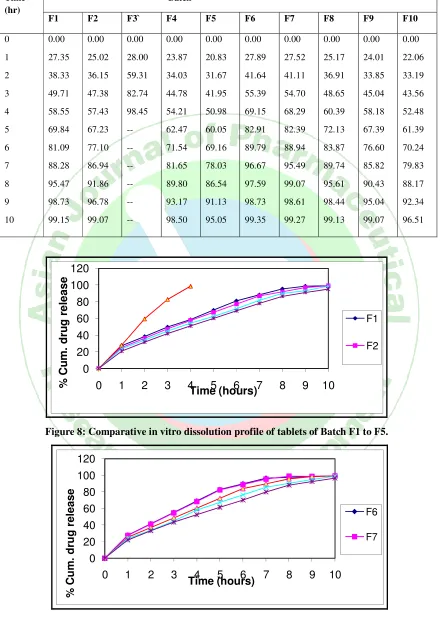
The in vitro drug release profile of tablet of each batches (F1-F10) were shown in Table 3. The plot of % cumulative drug release v/s Time (hr) was plotted for tablet of each batches (F1-F10) and depicted as Fig. No.8 (F1 to F5) and Fig. No.9 (F6 to F10).
From the in vitro dissolution data of batch F1 to F5, F1 released 99.15% of drug at the end of 8th hour, indicating that the polymer amount is insufficient to control the drug release 10 hour and hence discarded for the further study. F2 contain equal amount in combination of HPMC K4M with K15M and which showed better control of drug release than F1 but again unable to control the drug release up to 10 hour. The tablet of batch F2 showed 96.78% of drug release at the end of 9th hour and hence discarded from the study. Tablet of batch F3 contain methylcellulose A 4M which disappeared at the end of 4th hour by releasing drug 98.45% and showed that unable to control the drug release upto 10 hour and hence F3 discarded from the study. Tablet of batch F4 prepared with same amount of polymer as like F1, F2, F3 but contain HPMC K 15M, who showed the release of drug 98.50% at the end of 10th hour and satisfactorily controlled the drug release over the period of 10 hour. But tablets of batch F5 prepared with HPMC K 100M showed better control of drug release in less concentration (i.e. 30%w/w) than that of F4 (which contain HPMC K 15M 33% w/w). The drug release at the end of 10th hour for F5 was found to be 95.05% which was more satisfactory than F4 and hence F4 was discarded. If we consider F1 and F4, which contain same amount of different grades of HPMC, higher grades of HPMC showed better control of drug release than lower grades. Thus here among all F1 to F5, F5 was selected as the best formulation from dissolution data and forwarded for further study. Among F6 and F10, F6 and F7 contain same amount of chitosan and showed some what similar drug release profile. F6 released 96.67% of drug while F7 released 95.49% of drug at the end of 7th hour. This fraction of difference in drug release profile may be due to different filler used in each formulation. F6 showed some what faster drug
anti-ulcer activity thus both polymer or F5 and F10 were continued for further study.
Table No. 3: In Vitro Dissolution data of tablets of batch F1 to batch F10
Time (hr)
Batch
F1 F2 F3` F4 F5 F6 F7 F8 F9 F10
0 1 2 3 4 5 6 7 8 9 10 0.00 27.35 38.33 49.71 58.55 69.84 81.09 88.28 95.47 98.73 99.15 0.00 25.02 36.15 47.38 57.43 67.23 77.10 86.94 91.86 96.78 99.07 0.00 28.00 59.31 82.74 98.45 -- -- -- -- -- -- 0.00 23.87 34.03 44.78 54.21 62.47 71.54 81.65 89.80 93.17 98.50 0.00 20.83 31.67 41.95 50.98 60.05 69.16 78.03 86.54 91.13 95.05 0.00 27.89 41.64 55.39 69.15 82.91 89.79 96.67 97.59 98.73 99.35 0.00 27.52 41.11 54.70 68.29 82.39 88.94 95.49 99.07 98.61 99.27 0.00 25.17 36.91 48.65 60.39 72.13 83.87 89.74 95.61 98.44 99.13 0.00 24.01 33.85 45.04 58.18 67.39 76.60 85.82 90.43 95.04 99.07 0.00 22.06 33.19 43.56 52.48 61.39 70.24 79.83 88.17 92.34 96.51 0 20 40 60 80 100 120
0 1 2 3 4 5 6 7 8 9 10
% C u m . d ru g r e le a s e Time (hours) F1 F2
Figure 8: Comparative in vitro dissolution profile of tablets of Batch F1 to F5.
0 20 40 60 80 100 120
0 1 2 3 4 5 6 7 8 9 10
% C u m . d ru g r e le a s e Time (hours) F6 F7
0 20 40 60 80 100 120
0 0.25 0.5 0.75 1 2 3 4 5 6 7
%
C
u
m
.
d
ru
g
r
e
le
a
se
Time (Hours)
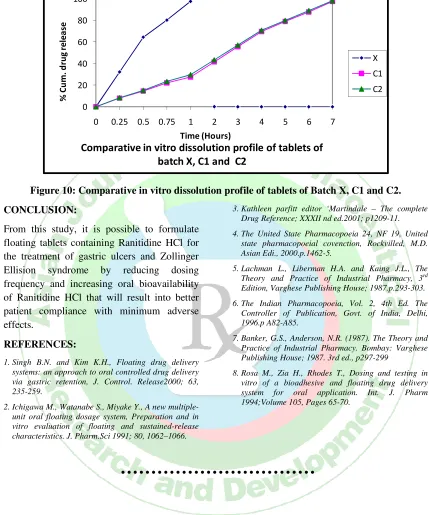
Comparative in vitro dissolution profile of tablets of batch X, C1 and C2
X C1 C2
Figure 10: Comparative in vitro dissolution profile of tablets of Batch X, C1 and C2.
CONCLUSION:
From this study, it is possible to formulate floating tablets containing Ranitidine HCl for the treatment of gastric ulcers and Zollinger Ellision syndrome by reducing dosing frequency and increasing oral bioavailability of Ranitidine HCl that will result into better patient compliance with minimum adverse effects.
REFERENCES:
1.Singh B.N. and Kim K.H., Floating drug delivery systems: an approach to oral controlled drug delivery via gastric retention, J. Control. Release2000; 63, 235-259.
2.Ichigawa M., Watanabe S., Miyake Y., A new multiple-unit oral floating dosage system, Preparation and in vitro evaluation of floating and sustained-release characteristics. J. Pharm.Sci 1991; 80, 1062–1066.
3.Kathleen parfitt editor ‘Martindale – The complete Drug Reference; XXXII nd ed.2001; p1209-11. 4.The United State Pharmacopoeia 24, NF 19, United
state pharmacopoeial covenction, Rockvilled, M.D. Asian Edi., 2000.p.1462-5.
5.Lachman L., Liberman H.A. and Kaing J.L., The Theory and Practice of Industrial Pharmacy, 3rd Edition, Varghese Publishing House; 1987.p.293-303. 6.The Indian Pharmacopoeia, Vol. 2, 4th Ed. The
Controller of Publication, Govt. of India, Delhi, 1996.p A82-A85.
7.Banker, G.S., Anderson, N.R. (1987). The Theory and Practice of Industrial Pharmacy. Bombay: Varghese Publishing House; 1987. 3rd ed., p297-299