Lincoln
University
Digital
Thesis
Copyright
Statement
The
digital
copy
of
this
thesis
is
protected
by
the
Copyright
Act
1994
(New
Zealand).
This
thesis
may
be
consulted
by
you,
provided
you
comply
with
the
provisions
of
the
Act
and
the
following
conditions
of
use:
you
will
use
the
copy
only
for
the
purposes
of
research
or
private
study
you
will
recognise
the
author's
right
to
be
identified
as
the
author
of
the
thesis
and
due
acknowledgement
will
be
made
to
the
author
where
appropriate
you
will
obtain
the
author's
permission
before
publishing
any
material
from
the
thesis.
Cross-Communication Between
Trichoderma
and
Plants During Root Colonisation
A thesis submission in partial fulfilment for the requirements of the Degree of
Doctor of Philosophy (Biochemistry) at Lincoln University.
at
The Bio-Protection Research Centre, Lincoln University.
by
Robert Lawry
Abstract and Keywords
I
Abstract of a Thesis Submitted in Partial Fulfilment of the Requirements for
the Degree of Ph.D. in Biochemistry
Cross-Communication Between
Trichoderma
and Plants During Root
Colonisation
By Robert Lawry
Fungi of the genus Trichoderma are found in soils worldwide and have a range of lifestyles that bring them into interaction with agriculturally relevant plants. Trichoderma virens is a potential endophyte, and may be suitable for application as a bio-control agent due to its mycoparasitic ability. However, little is understood about the nature of T. virens’ interactions with plant hosts. In this study, using Zea mays as an agriculturally relevant plant model, the nature of the interaction between Trichoderma and its plant hosts was examined. A novel interaction system, in sterile soil was established and maize hybrid line was determined to significantly affect T. virens colonisation. Microscopic analysis was used to visualise the ability of T. virens to penetrate, colonise and persist in the host plant. Appressoria-like structures were observed, and intra- and inter-cellular growth patterns were identified. Genomic and transcriptomic analyses were used to screen for potential effector proteins and other bioactive molecules involved in plant-fungal communication. T. virens
communication with its host plant appears to be more reliant on lytic enzymes, polysaccharides and secondary metabolites than previously suspected, potentially reflecting its genetic origins as a saprobe. The expression of a large number of lytic enzymes by T. virens suggests that damage associated molecular pattern pathways would act as the primary elicitors of a plant response in maize during T. virens colonisation. Attempts to verify the role of lytic enzymes using an XlnR1 deletion mutant proved difficult due to ectopic recombination of deletion constructs; however the process yielded an enhanced protoplasting method for T. virens that was subsequently adopted by the wider research group. In summary, this work identified novel information on the mechanisms used by T. virens to successfully colonise host plants during an endophytic interaction.
Acknowledgements
II
Acknowledgements
The completion of this thesis has been a long journey, and the support of many people has ensured that I made it through all of the challenges I faced to reach the end. There are those whose input made a huge difference to both my quality of life and quality as a scientist during this study. I would like to particularly thank my PhD supervisors, Dr. Artemio Mendoza-Mendoza and Dr. Andrew (Andy) Pitman. Artemio has been a fantastic teacher of fungal molecular biology, and his enthusiasm for the work helped me persevere with the project through a lot of challenges. Andy’s honest and insightful criticism has been absolutely invaluable in improving my skills as a scientific writer and as a critical thinker. I would also like to thank Professor Leo Condron for coming on-board with the project late and providing excellent advice, and Dr. Chris Brown, for taking the time to teach me RNA sequencing and transcriptome analysis. I would also like to thank Dr. David Greenwood for his advice on protein science and some exciting experimental techniques. I am also very grateful for the many small things done by the support staff at Lincoln and the Bio-Protection Research Centre, their hard work behind the scenes makes the life of a Ph.D. student much easier. I would like to thank the Marsden Fund and the Bio-Protection Research Centre for their support of the project.
Many people contributed immensely to my time at Lincoln University. I would like to thank the residents of the ‘man cave’, a base of operations like no other, defended by walls of stored insects, and protected by desks covered so thickly in paraphernalia , none could possibly encroach upon our realm. Without the sense of humour and numerous discussions had with my fellow cave dwellers, I would be considerably less sane. The names of the mighty heroes of the cave are too powerful to be written here, but you all know who you are. I would also like to thank the inhabitants of lab 612, for the good times both in and out of science, as well as some particularly great pranks.
Abbreviations and Terms
III
Abbreviations and Terms
Abbreviation Meaning ∆ Deletion Avr Avirulence
BIC Biotrophic Interfacial Complex
CAP Cysteine-rich secretory proteins, Antigen 5, and Pathogenesis-related 1 protein CWDE Cell Wall Degrading Enzyme
d Day
DAMP Damage Associated Molecular Pattern DNA Deoxyribonucleic Acid
DPI Days Post Inoculation EIX Ethylene-Inducing Xylanase ETI Effector Triggered Immunity Gb Gigabase
GlcNac N-acetyl-D-glucosamine Gy Grays (radiation)
h Hour
HPI H Post Inoculation
ISR Induced Systemic Resistance JA Jasmonic Acid
JGI Joint Genome Institute kb Kilobases
LRR Leucine Rich Repeat LysM Lysin Motif
M Molar
MAMP Microbe Associated Molecular Pattern MAPK Mitogen Activated Protein Kinase min Minute
mM Millimolar
MSB2 Multicopy Suppressor of Budding defect 2 MTI Molecular pattern Triggered Immunity MYB72 myb domain protein 72
NBS-LRR Nucleotide Binding Site - Leucine Rich Repeat NGS Next Generation Sequencing
nm Nanometer
NPR1 Natriuretic Peptide Receptor 1
PAMP Pathogen Associated Molecular Pattern PC2 Physical Containment 2
PDA Potato Dextrose Agar PR Pathogenesis Related
Table of Contents
IV
Table of Contents
1 INTRODUCTION ... 1
1.1 PLANT IMMUNITY,ENDOPHYTES AND KEY DEFINITIONS ... 1
1.2 THE RHIZOSPHERE AND PLANT OUTER CELL WALL ... 2
1.3 PHYSICAL BARRIERS TO MICROBE COLONISATION ... 3
1.4 MAMP AND PAMPTRIGGERED INTERACTIONS ... 4
1.5 EFFECTOR MOLECULES AND EFFECTOR TRIGGERED IMMUNITY ... 5
1.6 RPROTEINS ... 8
1.7 ENDOPHYTES,TRICHODERMA AND PLANT COLONISATION ... 9
1.8 KEY QUESTIONS ... 11
2 GENERAL MATERIALS AND METHODS ... 13
2.1 MATERIALS,KITS AND SOURCES ... 13
2.2 ORGANISMS AND STRAINS ... 13
2.3 MEDIA ... 14
2.3.1 Bacterial Growth Media ... 14
2.3.2 Fungal Growth Media ... 16
2.3.3 Plant Growth Media ... 16
2.3.1 Protoplasting Media ... 16
2.3.1 Fungal Transformation Media ... 16
2.4 PRIMERS ... 18
2.5 VECTORS ... 19
2.5.1 Cloning Vectors for E. coli ... 19
2.5.2 Vectors Created for T. virens Transformation ... 19
2.6 GENERAL METHODS ... 20
2.6.1 DNA Isolation... 20
2.6.2 RNA Isolation from T. virens in Interaction with Maize ... 21
2.6.3 Agarose Gel Electrophoresis ... 21
2.6.4 Polymerase Chain Reaction (PCR) ... 21
2.6.5 TA Cloning of Inserts ... 22
2.6.6 Bacterial Transformation via Heat Shock ... 22
2.6.7 Plant Growth Methods ... 23
2.6.7.1 Seed Sterilisation ... 23
2.6.7.2 Sterile Soil Growth ... 23
Table of Contents
V
2.6.7.4 Hydroponic Growth ... 24
2.6.8 Microscopy ... 24
2.6.8.1 Staining ... 24
2.6.8.2 Fluorescence Microscopy ... 25
2.6.8.3 Confocal Microscopy ... 25
3 TRICHODERMA VIRENS IS AN ENDOPHYTE IN CORTICAL CELLS OF MAIZE AND INBRED LINE AFFECTED ROOT COLONISATION ... 26
3.1 ABSTRACT ... 26
3.2 INTRODUCTION ... 26
3.3 MATERIALS AND METHODS ... 27
3.3.1 Maize Lines – Morphology and Germination ... 27
3.3.1 Development of a Maize-Trichoderma Growth System ... 28
3.3.1.1 Original Growth Procedure and Sterility Tests ... 28
3.3.1.2 Modifications to Growth Method... 28
3.3.2 Assay for the Presence and Extent of T. virens Colonisation of Maize ... 29
3.3.3 Microscopic Analysis of T. virens in Maize host ... 31
3.3.3.1 Fluorescence Microscopy ... 31
3.3.3.2 Microscopy Using Fluorescently Labelled Mutants ... 31
3.3.3.3 Confocal Microscopy ... 31
3.3.3.4 Transmission Electron Microscopy ... 31
3.4 RESULTS ... 32
3.4.1 Germination Test ... 32
3.4.2 Development of the Maize-Trichoderma Interaction Systems ... 32
3.4.3 T. virens Colonisation of Maize Lines ... 32
3.4.1 Microscopic Analysis of T. virens Root Colonisation ... 33
3.5 DISCUSSION ... 37
3.6 CONCLUSION ... 39
4 BIOINFORMATIC ANALYSIS OF THREE TRICHODERMA GENOMES IDENTIFIED PUTATIVE EFFECTORS AND FUNCTIONAL GROUPS RELEVANT TO ROOT COLONISATION ... 40
4.1 ABSTRACT ... 40
4.2 INTRODUCTION ... 40
4.3 METHODS ... 44
4.4 RESULTS AND DISCUSSION. ... 45
4.4.1 The Secretome of Trichoderma spp. ... 45
4.4.2 Small Cysteine-rich Secreted Proteins ... 47
Table of Contents
VI
4.4.4 Cellular Localisation of Effectors ... 49
4.4.5 Tandem Repeat Proteins ... 49
4.4.6 Functions of Putative Effectors in Trichoderma... 50
4.4.6.1 Protease Inhibitors ... 50
4.4.6.2 Necrosis and Ethylene Inducing Peptides ... 53
4.4.6.3 Pathogenesis-related (PR) Proteins: Thaumatin-like Proteins (TLP) ... 54
4.4.6.4 Trichoderma LysM-like Effectors ... 55
4.5 OTHER SECRETED MOLECULES ... 56
4.6 CONCLUSION ... 57
5 TRANSCRIPTOME PROFILES OF INTERACTING T. VIRENS AND ZEA MAYS ROOTS INDICATE POLYSACCHARIDE CATABOLISM AND SECONDARY METABOLISM AS THE PRIMARY RESPONSE INDUCED ... 58
5.1 ABSTRACT ... 58
5.2 INTRODUCTION ... 59
5.3 METHODS ... 65
5.3.1 Seed sterilisation and Plant Growth ... 65
5.3.2 Inoculation... 65
5.3.3 Total RNA Isolation ... 65
5.3.4 Illumina Sequencing ... 66
5.3.5 Analysis of Read Data ... 66
5.3.6 Functional Analysis ... 67
5.4 RESULTS AND DISCUSSION:MAIZE-T. VIRENS INTERACTION AT THREE,FIVE AND SEVEN DAYS POST INOCULATION .... 68
5.4.1 Quality Control – T. virens DPI Dataset ... 69
5.4.2 T. virens Three Days Post Inoculation ... 72
5.4.2.1 Proteins of Unknown Function ... 72
5.4.2.2 Cation Binding Proteins ... 74
5.4.2.3 Lytic Enzymes and Carbohydrate Binding ... 76
5.4.2.4 Polysaccharide Transport Proteins ... 80
5.4.2.5 Secondary Metabolites ... 81
5.4.2.6 Transcription Factors ... 84
5.4.2.1 Down-regulated Trichoderma Genes ... 85
5.4.3 T. virens Five Days Post Inoculation ... 87
5.4.4 T. virens Seven Days Post Inoculation ... 91
5.4.5 Overall Trends: Trichoderma Dataset ... 96
5.4.6 Transient Expression Analysis ... 98
5.4.7 Quality Control: Maize DPI dataset ... 101
Table of Contents
VII
5.4.9 Maize Five Days Post Inoculation ... 112
5.4.10 Maize Seven Days Post Inoculation ... 116
5.5 INTEGRATED ANALYSIS OF MAIZE AND T. VIRENSRESULTS ... 117
5.6 CONCLUSION AND FUTURE WORK ... 121
6 MOLECULAR CHARACTERISATION OF XLNR1-LIKE PROTEINS...122
6.1 ABSTRACT ... 122
6.2 INTRODUCTION ... 122
6.3 METHODS ... 124
6.3.1 Identification and Comparison of Candidate Genes ... 124
6.3.2 Gene Characterisation Strategy ... 124
6.3.3 Construction of Inserts for Transformation ... 124
6.3.4 Protoplast Isolation ... 126
6.3.4.1 Initial Protoplast Isolation Method (Method One) ... 126
6.3.4.2 Final Protoplast Isolation Method (Method Two) ... 126
6.3.5 Optimisation of Protoplasting Methodology ... 126
6.3.5.1 Effects of Growth Media and Digestion Period on Protoplast Formation ... 127
6.3.5.2 Comparison of Buffer Effects on Protoplasts... 127
6.3.5.3 Comparison of Successful Protoplast Formation for Six Trichoderma Strains from Four Species ... 127
6.3.6 Transformation of T. virens ... 127
6.3.7 Selection and Confirmation of Transformants ... 128
6.4 RESULTS ... 129
6.4.1 Identification of Candidate Genes ... 129
6.4.2 Protoplast Improvement ... 130
6.4.3 Fungal Transformation ... 133
6.5 DISCUSSION ... 135
6.6 CONCLUSION ... 136
7 FINAL DISCUSSION ...137
7.1 TRICHODERMA VIRENS IS AN ENDOPHYTE OF MAIZE FOR UP TO 7DPI AND COLONISATION IS AFFECTED BY HOST SPECIFIC FACTORS ... 137
7.2 PROPOSED MODEL OF T. VIRENSHOST ENTRY ... 138
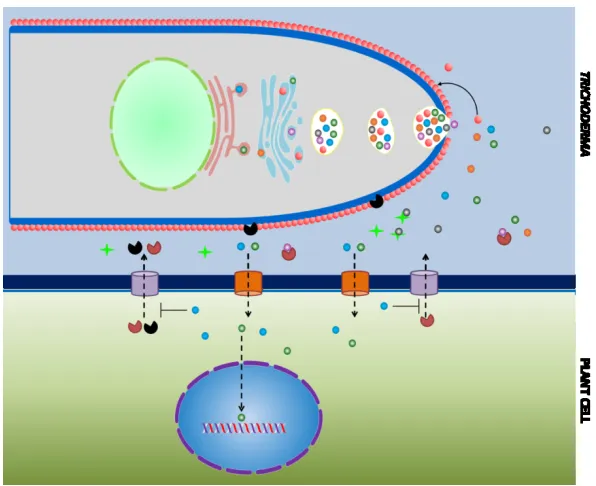
7.3 PROPOSED MECHANISM OF MOLECULAR COMMUNICATION BETWEEN TRICHODERMA VIRENS AND ZEA MAYS ... 140
7.4 CONCLUSION ... 145
8 APPENDIX ONE: TRANSCRIPTOMICS OF 12, 24 AND 48 H POST INOCULATION INTERACTION BETWEEN T. VIRENS AND Z. MAYS AND SUPPRESSIVE HYBRIDISATION. ...146
Table of Figures
VIII
Table of Figures
FIGURE 1:THE ZIG-ZAG MODEL OF PLANT-PATHOGEN INTERACTIONS. ... 8
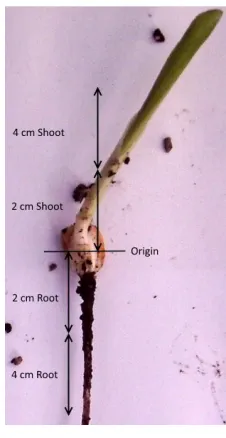
FIGURE 2:DIAGRAM OF ROOT AND SHOOT SECTIONS USED FOR T. VIRENS ENDOPHYTISM STUDY. ... 29
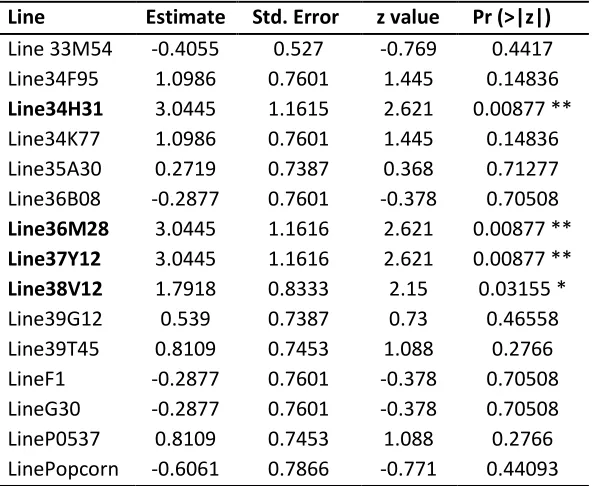
FIGURE 3:THE INCIDENCE AND EXTENT OF MAIZE INBRED LINE 34H31 ROOT AND SHOOT COLONISATION BY T. VIRENS GV 29.8. .. 34
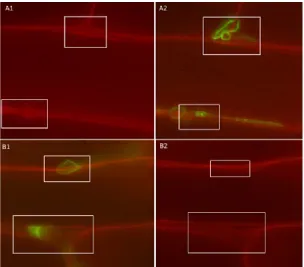
FIGURE 4:SURFACE COLONISATION OF MAIZE ROOTS BY T. VIRENS. ... 35
FIGURE 5:FORMATION OF APPRESSORIUM AND HAUSTORIUM-LIKE STRUCTURES ON MAIZE TISSUE BY T. VIRENS. ... 35
FIGURE 6:EXTRA-CELLULAR ENDOPHYTIC GROWTH OF T. VIRENS FORCES MAIZE CELLS APART... 36
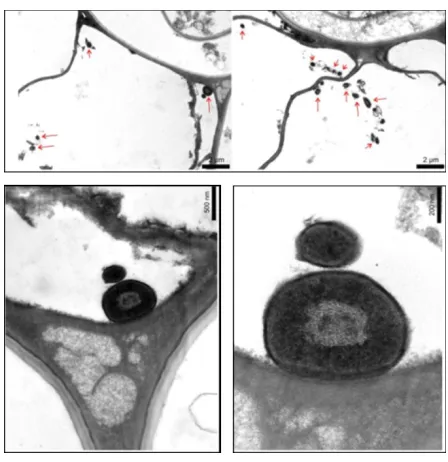
FIGURE 7:TRANSMISSION ELECTRON MICROGRAPH OF T. VIRENS INOCULATED MAIZE PLANTS SHOWING SMALL MELANISED STRUCTURES. ... 37
FIGURE 8:A DIAGRAM OF THE MODEL APPRESSORIA AND INVASIVE STRUCTURE IN FUNGI ... 39
FIGURE 9:SECRETION OF EFFECTOR-LIKE PROTEINS DURING THE PLANT-TRICHODERMA INTERACTION. ... 42
FIGURE 10:METHODOLOGY FOR SECRETOME IDENTIFICATION BY BIOINFORMATICS ... 45
FIGURE 11:LENGTH DISTRIBUTION OF SECRETED PROTEINS. ... 47
FIGURE 12:PERCENTAGE CYSTEINE CONTENT OF SMALL SECRETED PROTEINS. ... 48
FIGURE 13:FUNCTIONAL CATEGORIES FOR GENES COMPRISING THE ENTIRE PROTEOME OF T. VIRENS. ... 63
FIGURE 14:A DIAGRAMMATIC OUTLINE OF THE WORKFLOW USED IN TRANSCRIPTOME ANALYSIS. ... 68
FIGURE 15:FASTQC QUALITY SCORES FOR 3DPI1(A),5DPI1(B) AND 7DPI1(C). ... 70
FIGURE 16:VOLCANO AND MA PLOTS FOR THE T. VIRENS DPI DATASETS. ... 71
FIGURE 17:MOTIFS DETECTED BY MEME SEARCHES AND CLUSTALW SEQUENCE ALIGNMENTS. ... 72
FIGURE 18:FUNCTIONAL CATEGORIES OF DIFFERENTIALLY EXPRESSED GENES AT 3DPI ... 73
FIGURE 19:DISTRIBUTION OF CATION BINDING PROTEIN TYPES THAT WERE UP-REGULATED AT 3DPI. ... 75
FIGURE 20:FUNCTIONS OF THE TOP 50 MOST HIGHLY UP-REGULATED GENES AT 3DPI ... 77
FIGURE 21:A CLUSTERED HEAT PLOT SHOWING DIFFERENTIAL EXPRESSION IN T. VIRENS AT 3DPI. ... 86
FIGURE 22:FUNCTIONAL BREAKDOWN OF THE TOP 50 DIFFERENTIALLY EXPRESSED GENES AT 5DPI. ... 87
FIGURE 23:FUNCTIONAL CATEGORIES OF ALL DIFFERENTIALLY EXPRESSED GENES AT 5DPI. ... 90
FIGURE 24:FUNCTIONALITIES OF THE TOP 50 DIFFERENTIALLY EXPRESSED GENES AT 7DPI. ... 91
FIGURE 25:FUNCTIONAL CATEGORIES OF ALL DIFFERENTIALLY EXPRESSED GENES AT 7DPI. ... 95
FIGURE 26:VOLCANO AND MA PLOTS FOR THE COMPARISON OF ALL T. VIRENS DPI DATASETS ... 96
FIGURE 27:UP-REGULATED GENES IN THE SHIKIMATE AND RELATED PATHWAYS ACROSS THE ENTIRE INTERACTION. ... 97
FIGURE 28:FUNCTIONAL CATEGORIES OF DIFFERENTIALLY EXPRESSED GENES AT ACROSS ALL DPI DATASETS. ... 98
FIGURE 29:VOLCANO AND MA PLOTS FOR THE COMPARISON OF 3DPI TO 5DPI(A) AND 5DPI TO 7DPI(B) ... 99
FIGURE 30:A CLUSTERED HEAT PLOT SHOWING DIFFERENTIAL EXPRESSION BETWEEN T. VIRENS AT 3 VS 5DPI AND 5 VS 7DPI. . 100
FIGURE 31:VOLCANO AND MA PLOTS ZEA MAYS AT 3DPI(A),5DPI(B), AND 7DPI(C) ... 102
FIGURE 32:MAPMAN FUNCTIONAL CLASS MAP OF DIFFERENTIAL EXPRESSION IN MAIZE CELLULAR PROCESSES AT 3DPI. ... 103
Table of Figures
IX
FIGURE 34:A PATHWAY MAPPING OF DIFFERENTIAL EXPRESSION PATTERNS FOR RECEPTOR AND SIGNALLING PROTEINS IN MAIZE AT 3
DPI. ... 109
FIGURE 35:A PATHWAY MAPPING OF METABOLIC REGULATION IN ZEA MAYS AT 3DPI. ... 110
FIGURE 36:AMAPMAN PATHWAY MAPPING OF SECONDARY METABOLITE REGULATION IN ZEA MAYS AT 3DPI. ... 111
FIGURE 37:MAPMAN PATHWAY MAPPINGS OF MAIZE DIFFERENTIAL EXPRESSION AT 5DPI ... 115
FIGURE 38:A DIAGRAM OF A GENERIC PLANT CELL WALL STRUCTURE (SMITH,2001)... 119
FIGURE 39:A DIAGRAMMATIC EXPLANATION OF GIBBERELLIN SIGNALLING PATHWAYS, MEDIATED VIA THE DELLA PROTEIN. ... 120
FIGURE 40:EFFECTOR TRANSLOCATION AND TARGETING FROM FUNGAL CELL TO PLANT HOST. ... 121
FIGURE 41:WORKFLOW FOR CREATION OF CONSTRUCTS FOR DISRUPTION OF THE XYR REGULATORS. ... 125
FIGURE 42:DIAGRAM SHOWING PRIMER LOCATIONS FOR GENE VERIFICATION. ... 129
FIGURE 43:A SEQUENCE ALIGNMENT REPRESENTATION OF XYR-LIKE GENES IN T. VIRENS COMPARED TO T. REESEI ... 130
FIGURE 44:MICROSCOPIC VISUALISATION OF THE EFFECTS OF GROWTH MEDIA ON PROTOPLAST FORMATION FOR T. VIRENS. ... 131
FIGURE 45:A COMPARISON OF OSMOTIC MEDIA FOR USE IN PROTOPLAST FORMATION. ... 131
FIGURE 46:MICROSCOPE VISUALISATION OF PROTOPLAST FORMATION IN VARIOUS TRICHODERMA STRAINS USING THE NEW PROTOPLAST METHOD ... 132
FIGURE 47:GEL OF SFII DIGESTED HYGROMYCIN RESISTANT MUTANT COLONIES. ... 133
FIGURE 48:GEL OF SFII DIGESTED SUCCESSFUL TRANSFORMANTS. ... 134
FIGURE 49:METHODS OF PLANT PENETRATION USED BY T. VIRENS ... 139
FIGURE 50:A MECHANISM FOR MOLECULAR COMMUNICATION BETWEEN T. VIRENS AND Z. MAYS ... 141
Table of Tables
X
Table of Tables
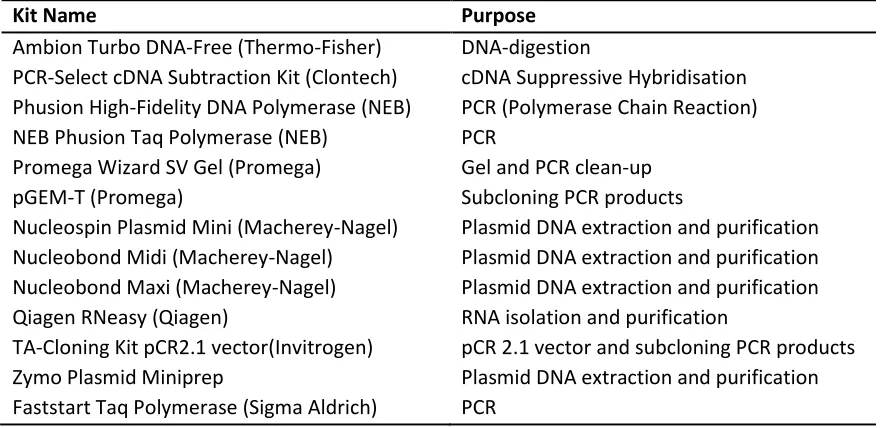
TABLE 1:KITS USED IN THIS STUDY AND THEIR PURPOSE ... 13
TABLE 2:ORGANISMS AND STRAINS USED FOR THE EXPERIMENTS PRESENTED IN THIS THESIS. ... 13
TABLE 3:GROWTH MEDIA FOR MICROORGANISMS AND REQUIRED SUPPLEMENTS ... 14
TABLE 4:GROWTH MEDIA FOR PLANTS ... 17
TABLE 5:PROTOPLASTING MEDIA ... 17
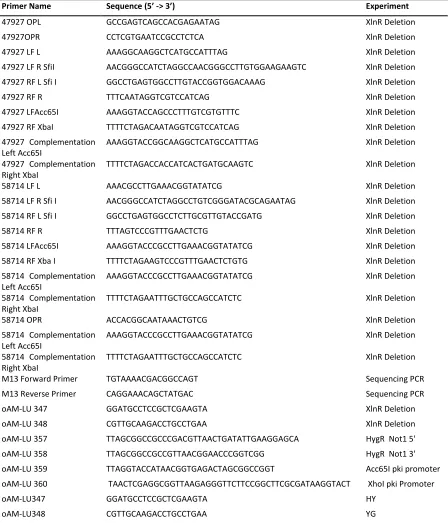
TABLE 6:PRIMERS USED DURING THIS STUDY. ... 18
TABLE 7:STANDARD PCR PROTOCOLS FOR FASTSTART AND PHUSION TAQ POLYMERASES ... 22
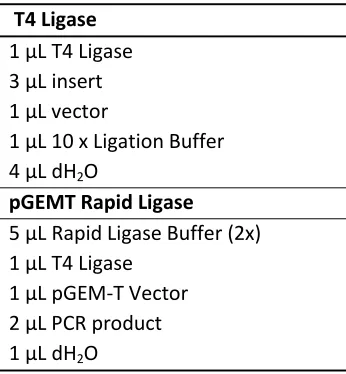
TABLE 8:LIGATION PROTOCOL FOR T4 AND RAPID LIGASE ... 22
TABLE 9:PROPIDIUM IODIDE AND ALEXA FLUOR 488 STAINING SOLUTION ... 25
TABLE 10:DISEASE RESISTANCE TRAITS FOR MAIZE LINES USED IN THIS STUDY. ... 30
TABLE 11:STERILITY OF MAIZE CONTROL PLANTS IN VARIOUS-TRICHODERMA-MAIZE INTERACTION SYSTEMS ... 32
TABLE 12:STATISTICAL ANALYSIS OF MAIZE ROOT AND SHOOT COLONISATION ... 33
TABLE 13:NUMBER OF POTENTIAL EFFECTORS COMPARED TO THE PROTEOME SIZES OF THE THREE STRAINS OF TRICHODERMA ... 46
TABLE 14:PROTEASE INHIBITORS IN THE THREE ANALYSED TRICHODERMA STRAINS ... 52
TABLE 15:NECROSIS AND ETHYLENE INDUCING PEPTIDES IN THE THREE ANALYSED TRICHODERMA STRAINS ... 53
TABLE 16:THAUMATIN PATHOGENESIS PROTEINS IN THE THREE ANALYSED TRICHODERMA SPECIES ... 55
TABLE 17:LYSM DOMAIN PROTEINS IDENTIFIED IN THE THREE ANALYSED TRICHODERMA STRAINS... 56
TABLE 18:DPI SAMPLES RUN ON ILLUMINA HISEQ... 66
TABLE 19:READS MAPPING TO T. VIRENS -DPIEXPERIMENTS... 69
TABLE 20:THE 50MOST HIGHLY UP-REGULATED GENES AT 3DPI IN T. VIRENS ... 79
TABLE 21:UP-REGULATED GENES CODING FOR SUGARS AT 3DPI ... 81
TABLE 22:UP-REGULATED GENES CODING FOR HORMONES, SECONDARY METABOLITES AND TOXINS AT 3DPI ... 83
TABLE 23:UP-REGULATED GENES CODING FOR TRANSCRIPTION FACTORS AT 3DPI ... 85
TABLE 24:THE 50 MOST HIGHLY UP-REGULATED GENES AT 5DPI IN T. VIRENS ... 88
TABLE 25:THE 50 MOST HIGHLY UP-REGULATED GENES AT 7DPI IN T. VIRENS ... 92
TABLE 26:DISPERSION AND BCV FOR THE MAIZE DATASETS. ... 101
TABLE 27:THE 50 MOST UP-REGULATED GENES IN ZEA MAYS AT 3DPI ... 104
TABLE 28:THE 50 MOST DOWN-REGULATED GENES IN ZEA MAYS AT 3DPI ... 107
TABLE 29:THE 50 MOST UP-REGULATED GENES IN ZEA MAYS AT 5DPI ... 112
TABLE 30:ALL DIFFERENTIALLY EXPRESSED GENES IN ZEA MAYS AT 7DPI ... 116
TABLE 31:GLYCOSIDE HYDROLASE FAMILIES EXPRESSED BY T. VIRENS DURING MAIZE INTERACTION ... 118
TABLE 32:PROTOPLAST COUNTS IN 6TRICHODERMA STRAINS FOLLOWING ENZYMATIC DIGESTION ... 133
1. Introduction
1
1
Introduction
1.1
Plant Immunity, Endophytes and Key Definitions
The plant defence system is composed of a robust, three-layer mechanism consisting of one physical layer and two layers based on molecular pattern recognition that have significant crossover with each other. This system is capable of suppressing the majority of microbial invaders with only extremely well-adapted pathogens capable of causing sustained infections. The first layer of plant defence consists of a physical barrier that microbes must penetrate. The second layer consists of enzymes and receptors which trigger active immune responses. The third layer is composed of effector-detecting receptors, and is responsible for effector triggered immunity (ETI) (Jones & Dangl, 2006). Both the second and the third layer are capable of greatly escalating a plant’s response to microbes, eventually triggering systemic immunity.
The first layer of plant immunity consists of barriers made from strong molecular bonds and crosslinking of complex polysaccharide and lipid molecules (Malinovsky, Fangel, & Willats, 2014). This layer is readily observable, consisting of wax, cuticle layers, cell walls and stomata, all of which must be overcome to gain physical entry into the plant (Bellincampi, Cervone, & Lionetti, 2014). This layer is discussed in greater detail in Section 1.3.
The second layer, that of microbe associated molecular pattern (MAMP) recognition, is more complicated. All microbes, whether beneficial or pathogenic, contain MAMPs. Pathogen associated molecular patterns (PAMP) consist of features common to only pathogens, but not microbes in general, such as endotoxins1 (Thonart, Ongena, & Henry, 2012). A possible third component of the second immune layer is damage associated molecular pattern (DAMP) recognition. DAMP recognition allows the plant to recognise damage caused to itself by microbial invaders or colonisers (generally via lytic enzyme release products such as polysaccharide molecules) (Benedetti
1
1. Introduction
2 et al., 2015). MAMP, PAMP and DAMP recognition form the innate (or basal) plant immune system, now known as MTI (Molecular pattern triggered immunity) (Muthamilarasan & Prasad, 2013).
The third layer (ETI) is similarly complex. This layer is capable of causing severe and lasting responses to pathogens and is triggered in response to effector molecules (see Section 1.5). Effectors are produced by pathogens to suppress the MTI layer (Jones & Dangl, 2006; Muthamilarasan & Prasad, 2013). Effector molecules are part of a complex evolutionary arms race, and have previously been called Avr proteins, as microbes producing them were avirulent on plant hosts with the appropriate ETI receptors (G. B. Martin, Bogdanove, & Sessa, 2003). Proteins that trigger a response to effector molecules are known as R proteins, and generally contain a nucleotide-binding site (NBS) leucine-rich repeat domain (LRR) (McHale, Tan, Koehl, & Michelmore, 2006). ETI leads to downstream signalling and, if persistent, triggers accumulation of molecules such as salicylic acid which leads to Systemic Acquired Resistance (SAR) (Gao, Zhu, Kachroo, & Kachroo, 2015; Halim, Vess, Scheel, & Rosahl, 2006). This is the most potent and long lasting plant immune response, analogous to acquired immunity in humans.
Endophytic mutualistic fungi differ from pathogens in that they must maintain a stable relationship with the host. It has recently been shown that they too elicit an immune response whilst attempting to colonise their host even though they are generally beneficial (Van Wees, Van der Ent, & Pieterse, 2008). The immune response encountered appears to share significant similarity to the plant’s response to pathogenic attack. Up to 40% of genes responding to mutualistic fungi may also be involved in defence responses (Van Wees et al., 2008). This suggests that pathogenic models may provide useful and important insights into the mechanisms by which mutualistic endophytes colonise their plant hosts.
1.2
The Rhizosphere and Plant Outer Cell Wal
l
1. Introduction
3 the rhizosphere; however the plant can manipulate rhizosphere conditions to select for various beneficial micro-organisms, and this appears to play a role in suppression of plant pathogenic microbes (Bakker et al., 2013). For Trichoderma to colonise the root as an endophyte, it must first be able to pass through the rhizosphere, and survive long enough for root entry. Rhizosphere competence has been shown in many Trichoderma spp. and appears to influence endophytic ability of various strains (Cripps-Guazzone, 2014).
Once the plant is within the rhizosphere, it must contend with the outer cell wall structure and then penetrate the cell wall itself. The outer root cell wall is coverd with root mucilage, which has wide ranging effects on rhizosphere interactions and plant nutrient acquisition and also produces exudates that may influence the surrounding regions (Osborn, Lochey, Mosley, & Read, 1999; Traoré, Groleau-Renaud, Plantureux, Tubeileh, & Boeuf-Tremblay, 2000). Root mucilage in maize consists of polysaccharides, primarily composed of glucose, mannose, fucose, xylose and arabinose, with fucose appearing to make up about 20% of the structure (Bacic, Moody, & Clarke, 1986; Osborn et al., 1999). This may create another barrier to Trichoderma entry, which due to its high sugar content, may induce sugar degrading enzyme production.
1.3
Physical Barriers to Microbe Colonisation
Non-1. Introduction
4 melanised appressoria often lack the ability to penetrate surfaces. Arbuscular mycorrhizal fungi use similar structures, called hyphopodia to attach and facilitate entry on plant epidermal cells (Rich, Schorderet, & Reinhardt, 2014). Appressoria formation has been observed in a variety of fungi, but has yet to be confirmed as a mechanism of penetration in Trichoderma species. Other mechanisms of physical penetration include access through wounds on the plant. Fungi also use compounds or molecules such as cell wall degrading enzymes (CWDE) and cell wall loosening molecules (e.g. expansins such as swollenin), to penetrate the outer layers of the plant, and possibly derive nutrition in the process (Brotman, Briff, Viterbo, & Chet, 2008; Göhre & Robatzek, 2008) (CWDEs are discussed in greater detail in Chapter 4 of this thesis). In brief, CWDEs target cell wall molecules for degradation, and a complex cocktail of enzymes may allow weakening or destruction of the plant’s cell wall matrix. This may facilitate mechanical entry, or be a reliable method of penetration on its own.
1.4
MAMP and PAMP Triggered Interactions
1. Introduction
5 oxidative bursts, localised necrosis and release of proteases. The extent of signalling will determine whether or not the response becomes systemic. The process is tightly regulated as it has significant energy costs to the plant.
Microbes that are adapted to a particular host plant have a counter for their host’s MAMP defence system. This counter takes the form of small secreted molecules, known as effectors. Effectors are an incredibly diverse set of proteins few of which are fully understood. Known effector mechanisms include scavenging of MAMPs, degradation of host proteases, and deregulation of primary and secondary signalling pathways in their host (Presti et al., 2015). This type of interaction tends to lead towards evolutionary arms races, with strong selection pressures for the pathogen to evade host immunity, and for the plant to retain it. A more detailed discussion of these interactions is found in Chapter 2.
1.5
Effector Molecules and Effector Triggered Immunity
Effector molecules used by pathogens to overcome MAMP-triggered immunity can also be their downfall as they may be detected by receptors responsible for ETI. Effector molecules produced by pathogens suppress plant MTI. Detection of effector molecules initiates an immune response that can lead to SAR. Pathogens release another suite of effectors which attempt to counter ETI; however these may be also detected by plant ETI. Thus ETI is the key determinant in the ability of plants to resist colonisation by pathogens (and other colonisers such as endophytes), and the effector suite of a pathogen is the major determinant of its ability to colonise the plant. As a consequence these effector molecules face significant evolutionary pressure.
1. Introduction
6 effectors are secreted, and some are then translocated into the host cell (Catanzariti, Dodds, & Ellis, 2007). Despite the need for transport into the cell, only one putative translocation motif has been found in oomycetes, which is the RxLR motif, however its exact mechanism remains controversial (Birch et al., 2009; Jeffrey G Ellis, 2011; Petre & Kamoun, 2014). This motif has not yet been seen in fungal effectors. It is also possible for other forms of translocation to occur. The type three secretion system of bacteria directly injects effectors into the host cell. Other forms of effector may not need to enter the cell to be effective and recently the Lysin motif (LysM), thought to be responsible for scavenging chitin that is released from the fungus by plant chitinases, was examined in detail (de Jonge & Thomma, 2009; Sánchez-Vallet, Mesters, & Thomma, 2015). This motif is found in many fungi and may allow them to evade detection by the host by reducing the extent of the immune response elicited by chitin, essentially evading the chitin recognition PRR involved in MTI. Molecules with this motif have also been shown to be capable of eliciting an immune response in Arabidopsis, which indicates a possible ETI response to this effector (de Jonge & Thomma, 2009). This motif has been found in mutualistic fungi and may be part of the communication system established with their hosts.
Effector genes are found in the majority of pathogens, fungal pathogens with known effectors include but are not limited to Cladosporium fulvum, Fusarium oxysporum, Magnaporthe oryzae,
Phytopthora spp. and Ustilago maydis (De Wit, Mehrabi, Van Den Burg, & Stergiopoulos, 2009; Presti et al., 2015). The vast majority of genes code for proteins shorter than 200 amino acids long, with between one and eight cysteine residues (Catanzariti et al., 2007). A number of these proteins were shown to be secreted, and to directly interact with a host R protein. However, several effectors may act in concert upon a single plant protein, making it difficult to fully determine individual contributions to pathogenicity (Pritchard & Birch, 2011). Several species of pathogenic and mutualistic fungi form complex feeding structures within cells, known as haustoria. It has now been shown that haustoria are capable of delivering effectors into host cells in certain pathogens e.g. M. oryzae and Melampsora lini (Dodds et al., 2006; Presti et al., 2015). These findings are important as they indicate that the haustoria may be a key site for molecular communication in fungi.
1. Introduction
7 genes, and activates the hypersensitive response (Feechan et al., 2015). When resistance (R) proteins, which are usually nucleotide binding site – leucine rich repeat (NBS-LRR) proteins, bind to an effector molecule, they activate downstream responses, such as MAPK, volatile organic compound production and modification of plant hormone levels (Cui, Tsuda, & Parker, 2015; McHale et al., 2006). Sufficient levels of plant hormones, particularly salicylic acid (SA), then lead to enhanced and systemic plant resistance to the majority of pathogens (Halim et al., 2006).
Several possible models of ETI activation have been postulated; namely the receptor ligand model, the guard model, the decoy model and the bait and switch model (Cui et al., 2015; Stuart, Paquette, & Boyer, 2013). The receptor ligand model suggests that R proteins bind effectors and signal to trigger immunity (previously known as the gene-for gene model). The guard model suggests that R proteins detect modification to effector target PRRs which then causes them to signal in place of the original PRR protein. The decoy model involves proteins that are similar to effector targets, but have no real function in the cell other than to signal when they are targeted by effectors. Finally, the bait and switch model suggests that PRR proteins are bound by secondary proteins that protect them from the effector’s action whilst preserving their signalling capacity upon the binding of the decoy to an effector (Cui et al., 2015; Stuart et al., 2013). Preservation of pathogenic ability can therefore only occur when a pathogen is capable of evading or suppressing all of the above mechanisms of MTI and ETI.
1. Introduction
8 for molecular work the organism’s evolutionary capability is unlikely to change across the duration of a particular experiment.
Figure 1: The zig-zag model of plant-pathogen interactions. This model was proposed by Jones and Dangl in 2006 (Jones & Dangl, 2006). It suggests four key time-points during an interaction, pathogen triggered immunity (PTI), effector triggered susceptibility (ETS), and effector triggered immunity (ETI). The last two (ETS and ETI) form an arms race, with the eventual winner successfully overcoming the other’s defences.
1.6
R Proteins
1. Introduction
9 also be more resistant to suppression by effectors than gene-for-gene systems (De Wit et al., 2009). Once a modification is detected, R proteins can activate signalling pathways to induce a number of defence responses, such as oxidative bursts, up-regulation of defence genes, and the hypersensitive response (McHale et al., 2006). These responses share many similarities to both PRR-based MTI and NBS-LRR based ETI, in that MAP kinases trigger further downstream responses, leading to hormonal changes throughout the plant. It is notable that deletion of proteins related to general disease susceptibility in Arabidopsis affected both ETI and MTI significantly, further supporting the crosslinking of these pathways. Furthermore, the evolutionary costs of maintaining large numbers of R proteins are thought to be high, potentially causing them to be maintained only under selection pressure (Tian, Traw, Chen, Kreitman, & Bergelson, 2003).
1.7
Endophytes,
Trichoderma
and Plant Colonisation
Endophytic mutualistic fungi differ from pathogens in that they must maintain a stable relationship with their host. Although these fungi are beneficial to the host, it has recently been shown that they also elicit an immune response, in a manner similar to that of pathogens (Presti et al., 2015; Van Wees et al., 2008). This immune response does not, however, escalate to the same levels as those involved in pathogen clearing. The plants response to mutualistic fungi is regulated by a complex communication system established between the plant and fungus. The exact mechanisms of this communication are unknown; however, signalling networks involving jasmonic acid, ethylene and salicylic acid are thought to be involved (Van Wees et al., 2008). These signalling networks are all part of systematic defence signalling pathways that are triggered in response to pathogenic attack (Shah, 2009).
1. Introduction
10 2014). It is clear that closely related pathways that respond to both pathogens and endophytes exist. These pathways are subject to extremely tight regulation. Understanding these will increase our knowledge of microbial communication, the interactions that determine pathogenicity, and may also aid us in understanding similar communication in human pathogens.
Trichoderma is a diverse genus of ascomycete fungi, with over 100 species currently known (Harman, Howell, Viterbo, Chet, & Lorito, 2004a). The genomes of three species, Trichoderma atroviride, Trichoderma reesei and Trichoderma virens, have been fully sequenced (http://genome.jgi-psf.org/). They have a wide variety of habitats and similarly diverse life histories. They are found in soils worldwide, but also function as opportunistic avirulent plant symbionts (Harman, Howell, Viterbo, Chet, & Lorito, 2004b). The ability of Trichoderma spp. to thrive in such a wide range of habitats is linked to their ability to produce a number of bioactive molecules, such as lytic enzymes and antibiotics (Woo, Scala, Ruocco, & Lorito, 2006). This has made them popular for use in the industrial biosynthesis of compounds such as cellulases, xylanases and chitinases (Felse & Panda, 1999; Mehrdad Azin, 2007). Trichoderma spp. are frequently found in symbiotic relationships with plants and are capable of increasing plant tolerance to a wide range of abiotic and biotic stresses. This makes them popular as biocontrol agents in agriculture (Kubicek et al., 2011). Trichoderma spp. are therefore good candidates for studies of host-microbe interactions.
1. Introduction
11 immune system, but also by mycoparasitism and antibiosis (Shoresh et al., 2010). Maize is expected to derive some or all of these benefits from Trichoderma colonisation.
Plant defence is induced by Trichoderma through a number of methods. Recently Sm1 (and homologous proteins Epl1 and Sm2), a protein related to pathogenic phytotoxic proteins, was discovered to be secreted by both T. atroviride and T. virens (Djonovic et al., 2007; Frankie K. Crutcher, 2015; Gaderer et al., 2015; Salas-Marina et al., 2015). This protein is not toxic to the plant, and instead induced a systematic plant immune response. Deletion of the Epl1 gene in T. atroviride
reduced the protective effect in tomato plants (Salas-Marina et al., 2015, p. 1). Terpenoids, peptabiols and other secondary metabolites synthesised by Trichoderma have also been shown to induce plant immune responses (F. Vinale, 2008; Shah, 2009; Shoresh et al., 2010). This results in a heightened response to pathogenic attack via priming of induced systemic resistance (ISR), and is less costly to the plant than constitutive expression of resistance genes. How Trichoderma evades the immune response itself is not yet clear and represents the main aim of this research.
Understanding the molecular dialogue between plants and mutualists is essential to the safe and effective use of biocontrol agents such as Trichoderma in agriculture. While these fungi are capable of increasing crop yields and protecting crops from biotic and abiotic stress factors, the lack of a clear explanation for the difference between pathogenic and endophytic lifestyles is troubling. Similar molecules seem to be involved in both pathogenic and mutualistic interactions. An in-depth study of Trichoderma in interaction with an agriculturally relevant plant will increase our understanding of the process of colonisation and the differences between endophytism and pathogenicity (Harman et al., 2004b). Pathogenic organisms have been well studied, however the focus with beneficial microbes has mainly been on their antibiotic properties. Trichoderma spp. are good candidates as they exist as mutualists with agriculturally relevant plants and are already in use in agriculture, making findings readily applicable.
1.8
Key Questions
It is apparent that data on plant-endophyte interactions is scarce in several key areas. Firstly, there is a limited understanding of the factors that influence host specificity and colonisation ability in
1. Introduction
12 understood. These topics are investigated in this thesis in the hope of determining the general genetic and physiological attributes that T. virens uses to act as a root endophyte of maize, and provide some ability to extrapolate this to other Trichoderma species, such as T. atroviride and T. reesei.
Chapter 3 asks three key questions:Firstly,does T. virens possess endophytic capability in maize? Secondly, what effect does maize host line have on fungal colonisation? And thirdly what morphological features enable entry into the host plant?
Chapter 4 examines the genetic components behind the interaction via in silico techniques. This section was guided by two key questions: do the Trichoderma species T. atroviride, T. reesei and T. virens have similar genetic components that resemble known effector genes? And what genetic characteristics exist in these Trichoderma spp. that may be relevant to plant colonisation? These questions aimed to identify general trends in Trichoderma spp. genetics and relate them to T. virens
colonisation.
Chapter 5 aimed to determine which key genes or gene groups are differentially expressed during root-T. virens interaction, following the hypothesis that predicted small secreted effector proteins should be up-regulated during colonisation.
Chapter 6 took two highly differentially expressed candidate genes from the differential expression analysis in Chapter 5, and tested whether these genes had an effect on root colonisation in vivo
2. General Materials and Methods
13
2
General Materials and Methods
2.1
Materials, Kits and Sources
General kits (Table 1), media and methods used in all subsequent chapters will be presented here. Methods relevant to specific chapters will be presented where appropriate.
Table 1: Kits used in this study and their purpose
Kit Name Purpose
Ambion Turbo DNA-Free (Thermo-Fisher) DNA-digestion
PCR-Select cDNA Subtraction Kit (Clontech) cDNA Suppressive Hybridisation Phusion High-Fidelity DNA Polymerase (NEB) PCR (Polymerase Chain Reaction) NEB Phusion Taq Polymerase (NEB) PCR
Promega Wizard SV Gel (Promega) Gel and PCR clean-up pGEM-T (Promega) Subcloning PCR products
Nucleospin Plasmid Mini (Macherey-Nagel) Plasmid DNA extraction and purification Nucleobond Midi (Macherey-Nagel) Plasmid DNA extraction and purification Nucleobond Maxi (Macherey-Nagel) Plasmid DNA extraction and purification Qiagen RNeasy (Qiagen) RNA isolation and purification
TA-Cloning Kit pCR2.1 vector(Invitrogen) pCR 2.1 vector and subcloning PCR products Zymo Plasmid Miniprep Plasmid DNA extraction and purification Faststart Taq Polymerase (Sigma Aldrich) PCR
2.2
Organisms and Strains
The following organisms and strains were used during the course of this Ph.D. (Table 2). Table 2: Organisms and strains used for the experiments presented in this thesis.
Organism Strain/Line Source
Escherichia coli Top10F Invitrogen
Trichoderma atroviride IMI206040 Dr. Alfredo Herrera-Estrella (Langebio, Mexico)
Trichoderma hamatum FCC207 TrichoBank (Lincoln University)
Trichoderma harzianum FCC261 TrichoBank (Lincoln University)
Trichoderma reesei QM6a ATCC 13631**
Trichoderma virens Tv10.4 Professor Charles Kenerley (Texas A&M University, USA)
Trichoderma virens* Gv 29.8 Professor Charles Kenerley (Texas A&M University, USA)
Zea mays
34H31
Pioneer Seeds
Zea mays
33M54
Pioneer Seeds
Zea mays
34F95
Pioneer Seeds
2. General Materials and Methods
14
Zea mays
35A30
Pioneer Seeds
Zea mays
36B08
Pioneer Seeds
Zea mays
36M28
Pioneer Seeds
Zea mays
37Y12
Pioneer Seeds
Zea mays
38V12
Pioneer Seeds
Zea mays
39G12
Pioneer Seeds
Zea mays
39T45
Pioneer Seeds
Zea mays
P0537
Pioneer Seeds
Zea mays
G30
Chieftain Seeds
Zea mays
F1
Chieftain Seeds
Zea mays
Popcorn
New World Supermarket
*T. virens Gv29.8 was used for all experiments in this thesis except protoplasting. When T. virens is mentioned, it will be this strain unless otherwise specified. **American Type Culture Collection
2.3
Media
All media (Table 3) were made up to 1 L with dH2O and sterilised by autoclaving at 121°C for at least 15 min unless otherwise specified. Media containing thermally unstable chemicals were filter sterilised by vacuum filtration through a 0.22 µm filter into a previously autoclaved container.
2.3.1
Bacterial Growth Media
Strains of Escherichia coli were propagated overnight at 37°C in either 5 mL LB broth in a 20 mL universal tube, or on LB + Agar plates containing 25 mL of LB Agar. Liquid cultures were shaken at 180 RPM. Selective media was prepared with the addition of 100 µg/mL ampicillin when required. IPTG (0.1 M final concentration) and X-gal (20 mg/mL) were added to solid selection media when required. Stock cultures were maintained at -80°C in a final concentration of 25% glycerol.
Table 3: Growth media for microorganisms and required supplements
Media Components
LB Broth (Difco) Tryptone 10 g/L
Yeast Extract 5g /L NaCl 10 g/L
LB Agar (Difco) Tryptone 10 g/L
Yeast Extract 5g /L NaCl 10 g/L Agar 15 g/L Glucose-Yeast Extract-Casein (GYEC) Casein 20 g/L
2. General Materials and Methods
15 Glucose 10 g/L
PDA (Difco) Potato Starch Infusion 4
g/L
Dextrose 20 g/L Agar 15 g/L
PDB (Difco) Potato Starch
Infusion 4 g/L Dextrose 20 g/L
Minimal Media Vogel's Salts 20 mL
Sucrose 15 g/L
Vogel's Salts Sodium Citrate 150 g/L
KH2PO4 250 g/L NH4NO3 100 g/L MgSO4.7H2O 10 g/L CaCl2.2H2O 5 g/L Trace elements 5 mL Biotin Solution 2.5 mL
Trace Elements (100 mL) Citric acid 5g
ZnSO4.7H2O 5g
Fe (NH4)2 (SO4)2.6H2O 1g CuSO4.5H2O 0.25g MnSO4.H2O 0.05g H3BO3 0.05g
Na2MoO4.2H2O 0.05g
Biotin Solution (50 mL) Biotin 5 mg
Trichoderma Selective Media (TSM) Agar 20 g/L
Glucose 3 g/L
Ammonium Nitrate 1 g/L K2HPO4.3H2O 0.9 g/L MgSO4.7H2O 0.2g/L KCl 0.15 g/L
Terrachlor 75 WP 0.2g/L Rose Bengal 0.15 g/L Chloramphenicol (2.5 mg/mL stock) 1 mL Metal Salt Solution 1 mL
Metal Salt Solution FeSO4.7H2O 1 g/L
2. General Materials and Methods
16
2.3.2
Fungal Growth Media
Fungal isolates were propagated on PDA, PDB, GYEC media or minimal media. Cultures were inoculated by placing 5 drops of spores on the plate or in the solution. Cultures were incubated at 25°C for 7 days. Liquid cultures (PDB, GYEC, Minimal media) were shaken at 180 RPM. Where required Hygromycin B was added at a final concentration of 200 µg/mL. Stock cultures were stored at -80°C in 50% glycerol at a 1:1 ratio with the culture solution.
2.3.3
Plant Growth Media
John Innes loam, potting mix and soil from monitored fields were used for plant growth (Table 4). All soils used for final experiments were gamma ray sterilised. Initially autoclaving was used but it was found to have imperfect sterilisation results (discussed in Chapter 3). Plants grown hydroponically were placed in 50 mL of an autoclaved water-Hoagland’s basal salt mixture solution, with the seed supported by a plug of sterile cotton wool.
2.3.1
Protoplasting Media
Fungal digestion was performed in osmotic media (Table 5). Three different osmotic media were trialled in this study. Fungal digestion was performed with 0.24g cellulase and 0.5g Glucanex (Novozyme) per 50 mL of osmotic media.
2.3.1
Fungal Transformation Media
2. General Materials and Methods
17 Table 4: Growth media for plants
Media Components
Hoagland's Basal Salt Mixture No. 2 (Sigma-Aldrich) Ammonium phosphate 115.03 mg/L Boric acid 2.86 mg/L
Calcium Nitrate 656.4 mg/L Cupric sullipide.5H2O 0.08 mg/L Ferric tartrate.2H2O 5.32mg/L Magnesium sullipide 240.76 mg/L Manganese chloride.4H2O 1.81 mg/L Molybdenum trioxide 0.016 mg/L Potassium Nitrate 606.6 mg/L Zinc Sullipide.2H2O 0.22 mg/L
John Innes Loam (Potting Mix) 7 kg Loam
3 kg Peat 2 kg Sand
0.6 kg Limestone (ground) 1.2 kg Hoof and Horn 1.2 kg Superphosphate 600 g Potassium Sulphate
Soil Analysis Results* Phosphorus 102 mg/L
Potassium 1.72 me/100g Calcium 14.3 me/100g Magnesium 4.53 me/100g Sodium 0.4 me/100g Nitrogen 77 kg/ha Mineralisable N 57 ug/g Carbon 6.2%
*Full results shown in supplementary material. The cation exchange capacity is measured by milliequivalents per 100g (me/100g).
Table 5: Protoplasting media
Media Components
OM Media (pH 5.8) 1.2 M MgSO4.7H2O
100 mM NaH2PO4
Mannitol 0.6 M (pH 5.5) 50 mM CaCl2
0.6 M Mannitol 50 mM MES hydrate
Mannitol 0.7 M (pH 5.5) 50 mM CaCl2
2. General Materials and Methods
18
2.4
Primers
Primer oligonucleotides were ordered and synthesised by Integrated DNA technology (IDT). Table 6: Primers used during this study.
Primer Name Sequence (5’ -> 3’) Experiment
47927 OPL GCCGAGTCAGCCACGAGAATAG XlnR Deletion
47927OPR CCTCGTGAATCCGCCTCTCA XlnR Deletion
47927 LF L AAAGGCAAGGCTCATGCCATTTAG XlnR Deletion
47927 LF R SfiI AACGGGCCATCTAGGCCAACGGGCCTTGTGGAAGAAGTC XlnR Deletion 47927 RF L Sfi I GGCCTGAGTGGCCTTGTACCGGTGGACAAAG XlnR Deletion
47927 RF R TTTCAATAGGTCGTCCATCAG XlnR Deletion
47927 LFAcc65I AAAGGTACCAGCCCTTTGTCGTGTTTC XlnR Deletion 47927 RF XbaI TTTTCTAGACAATAGGTCGTCCATCAG XlnR Deletion 47927 Complementation
Left Acc65I
AAAGGTACCGGCAAGGCTCATGCCATTTAG XlnR Deletion
47927 Complementation Right XbaI
TTTTCTAGACCACCATCACTGATGCAAGTC XlnR Deletion
58714 LF L AAACGCCTTGAAACGGTATATCG XlnR Deletion
58714 LF R Sfi I AACGGGCCATCTAGGCCTGTCGGGATACGCAGAATAG XlnR Deletion 58714 RF L Sfi I GGCCTGAGTGGCCTCTTGCGTTGTACCGATG XlnR Deletion
58714 RF R TTTAGTCCCGTTTGAACTCTG XlnR Deletion
58714 LFAcc65I AAAGGTACCCGCCTTGAAACGGTATATCG XlnR Deletion 58714 RF Xba I TTTTCTAGAAGTCCCGTTTGAACTCTGTG XlnR Deletion 58714 Complementation
Left Acc65I
AAAGGTACCCGCCTTGAAACGGTATATCG XlnR Deletion
58714 Complementation Right XbaI
TTTTCTAGAATTTGCTGCCAGCCATCTC XlnR Deletion
58714 OPR ACCACGGCAATAAACTGTCG XlnR Deletion
58714 Complementation Left Acc65I
AAAGGTACCCGCCTTGAAACGGTATATCG XlnR Deletion
58714 Complementation Right XbaI
TTTTCTAGAATTTGCTGCCAGCCATCTC XlnR Deletion
M13 Forward Primer TGTAAAACGACGGCCAGT Sequencing PCR
M13 Reverse Primer CAGGAAACAGCTATGAC Sequencing PCR
oAM-LU 347 GGATGCCTCCGCTCGAAGTA XlnR Deletion
oAM-LU 348 CGTTGCAAGACCTGCCTGAA XlnR Deletion
oAM-LU 357 TTAGCGGCCGCCCGACGTTAACTGATATTGAAGGAGCA HygR Not1 5' oAM-LU 358 TTAGCGGCCGCCGTTAACGGAACCCGGTCGG HygR Not1 3' oAM-LU 359 TTAGGTACCATAACGGTGAGACTAGCGGCCGGT Acc65I pki promoter oAM-LU 360 TAACTCGAGGCGGTTAAGAGGGTTCTTCCGGCTTCGCGATAAGGTACT XhoI pki Promoter
oAM-LU347 GGATGCCTCCGCTCGAAGTA HY
2. General Materials and Methods
19
2.5
Vectors
Both vectors for E. coli transformation contained ampicillin resistance cassettes, and ampicillin was used as a selection antibiotic for all E. coli transformants. Fungal transformants were selected for using hygromycin resistance via an introduced resistance cassette. Cloning of products was verified by blue-white screening (indicating disruption of the lac operon by the insert – white colonies are selected), followed by polymerase chain reaction (PCR) and agarose gel electrophoresis verification of selected colonies. Final products were verified by sequencing using M13 primers.
2.5.1
Cloning Vectors for
E. coli
pCR 2.1 was used for cloning PCR products. This vector contains ampicillin and kanamycin resistance cassettes and contains the lac operon for blue-white colony screening. Inserts were verified by sequencing using the M13 forward and M13 reverse primers. pCR2.1 is a 3.9 kb plasmid. pGEMT vector was used for cloning PCR products. This vectors contains an ampicillin resistance cassette as well as the lac operon for blue-white colony screening. Insertions may also be verified by M13 primer sequencing.
2.5.2
Vectors Created for
T. virens
Transformation
pAMT-30 contains the phosophotransferase of hygromycin under the control of trp1 promoter (Mendoza-Mendoza, unpublished). This plasmid was used to create the following vectors.
pGEMT-47927LF-HY vector. A 1.1-Kb region of the 5’ region of 47927 (Gene Identification number in the JGI T. virens V2 genome available at the Joint Genome Institute (JGI)) gene was amplified using T. virens Gv29.8 genomic DNA as template and primer combination 47927 LF R SfiI and 47927 OPL. The resulting PCR product was digested with SfiI restriction enzyme and ligated to the 1.4-kb SfiI hygromycin resistance cassette fragment from PAMT-30 (Mendoza-Mendoza, unpublished). To generate the 47927LF-HY product, the ligation product was amplified with Phusion Taq polymerase using the primer combination 47927 LF L and oAM-LU347. The resulting PCR product was gel purified, A-tailed and ligated into plasmid pGEMT, generating plasmid pGEMT- 47927LF-HY. The resulting plasmid was amplified in Top10 F’ E. coli and sequenced. pGEMT- 47927LF-HY was used for overlap transformation of T. virens Gv29.8 alongside pGEMT- 47927RF-YG.
pGEMT-47927RF-YG vector. A 1.1 Kb region 3’ of the 47927 gene was amplified from T. virens
2. General Materials and Methods
20 manner as pGEMT-47927LF-HY except the primer combination 47927 RF-R and oAM-LU348 was used. Plasmid pGEMT-47927RF-YG was used for overlap transformation alongside pGEMT-47927LF-HY.
pGEMT-58714LF-HY A 1.1 Kb region 5’ of the 58714 gene was amplified from T. virens genomic DNA using primers 58714 LF R Sfi I and 58714 OPL. The vector was created in the same manner as pGEMT-47927LF-HY except the primer combination 58714 LF-L and oAM-LU347 was used. Plasmid pGEMT-58714LF-HY was used for overlap transformation alongside pGEMT-58714RF-YG.
pGEMT-58714RF-YG A 1.1 Kb region 3’ of the 58714 gene was amplified from T. virens genomic DNA using primers 58714 RF L Sfi I and 58714 OPR. The vector was created in the same manner as pGEMT-47927LF-HY except the primer combination 58714 RF-R and oAM-LU348 was used. Plasmid pGEMT-58714RF-YG was used for overlap transformation alongside pGEMT-58714LF-HY.
2.6
General Methods
2.6.1
DNA Isolation
Phenol:Chloroform:Isoamylalcohol extraction was used to obtain genomic DNA from Trichoderma
isolates (Sambrook & Russell, 2001). Approximately 100 mg of mycelial tissue from 1 day old PDB suspensions was harvested and ground under liquid nitrogen. Tissue was placed in a 2 ml tube with 0.5 mL of DNA extraction buffer (100 mM TRIS-HCl pH 7.5, 50 mM EDTA pH8, 1.5 M NaCl, 2% CTAB and 0.05% β-mercaptoethanol). A 0.5 mL mix of 25:24:1 phenol:chloroform:isoamylalchohol was added and then the tube was vortexed for 10 seconds. Following this, the sample was centrifuged for 10 min at 13,000 rpm. The top layer is then removed via careful pipetting and placed in a new tube, where 2.5 volumes of ice cold ethanol were added. The tube was then mixed by inversion before centrifuging again for 5 min at 13,000 rpm. The supernatant was then discarded and the centrifugation was repeated. Any remaining ethanol was removed and then the DNA pellet was re-suspended in 100 µL sterile H2O. Resulting DNA was quantified by Nanodrop and verified by agarose gel electrophoresis.
2. General Materials and Methods
21 The pellet was then washed in 100 µL 70% ethanol before air drying and re-suspension in 100 µL sterile H2O.
2.6.2
RNA Isolation from
T. virens
in Interaction with Maize
Total RNA isolation was carried out from approximately 200 mg of ground T. virens-inoculated maize root tissue taken from the 2 cm root section closest to the seed. The Qiagen RNeasy kit was used according to the kit’s instructions, except that 700 µL of RLC buffer was used instead of 450 µL. RNA quantity was determined by Nanodrop analysis, and RNA quality was verified by denaturing agarose gel electrophoresis.
2.6.3
Agarose Gel Electrophoresis
Agarose gel electrophoresis was used to determine the quality of DNA and RNA extractions, and determine the successful amplification of PCR products via size separation. 0.8% agarose gels were prepared by addition of 3.2 g of agarose to 400 mL of 1x TAE. The solution was then heated until the agarose was fully dissolved. 1x TAE was prepared from a stock solution of 50 x TAE buffer (2 M Tris-HCl, 2 M acetic acid, 50 mM EDTA, pH 8). Agarose solution was cooled and 1 µL of Red-Safe was added per 100 mL of gel. Gels were then poured into a casting tray containing a single comb. DNA or RNA samples were then mixed with an appropriate loading dye and pipetted into the sample wells. The gel was run for 35 min at 110 V and 500 mA. Bands were then observed under UV light and digitalised using a Bio-Rad Molecular Imager VersaDoc MP 4000.
2.6.4
Polymerase Chain Reaction (PCR)
2. General Materials and Methods
22 Table 7: Standard PCR protocols for Faststart and Phusion Taq polymerases
Cycles Step Faststart Taq Polymerase
(Sigma-Aldrich)
Phusion® High-Fidelity DNA Polymerase (NEB)
Temperature (°C) Time Temperature (°C) Time
1X Initial Denaturation 95 4 min 98 30 s
Denaturation 95 30 s 98 5 - 10 s
35X Annealing 55-65 30 s 50-65 10 - 30 s
Elongation 72 90 s 72 15 - 30 s/kb
1X Final Elongation 72 7 min 72 10 min
2.6.5
TA Cloning of Inserts
Both pGEMT and PCR2.1 vectors were capable of accepting inserts via TA ligation. PCR products containing a single 3´ adenine overhang were ligated (using T4 DNA ligase) into a linearised vector containing a complementary 3' thymine overhang. Two ligation procedures were used; time period for ligation was either 1 h or overnight, dependent on whether the 1 h ligation was initially successful.
Table 8: Ligation Protocol for T4 and Rapid Ligase
T4 Ligase 1 µL T4 Ligase 3 µL insert 1 µL vector
1 µL 10 x Ligation Buffer 4 µL dH2O
pGEMT Rapid Ligase
5 µL Rapid Ligase Buffer (2x) 1 µL T4 Ligase
1 µL pGEM-T Vector 2 µL PCR product 1 µL dH2O
2.6.6
Bacterial Transformation via Heat Shock
2. General Materials and Methods
23 ice for 10 min and then added to 300 µL of SOC media at 37°C. This mixture was then incubated for 1 h at 37°C shaking at 200 RPM. Cells are then plated onto LB + Ampicillin + IPTG + X-gal plates and grown overnight at 37°C. White colonies were selected for further analysis.
2.6.7
Plant Growth Methods
Seed sterilisation and plant growth methods were determined by the investigations presented in Chapter 3. The methods presented here are the final methods and were used for all subsequent experiments.
2.6.7.1
Seed Sterilisation
Maize seeds were placed in a 50 mL tube containing 95% ethanol and stirred for 7 min. Seeds were transferred to a solution of bleach containing 5% sodium hypochlorite- and stirred for 5 min. Seeds were subsequently removed from this solution and washed twice in dH2O. Seeds were then planted immediately. Storage of seeds is possible for 1-2 days in sealed containers.
2.6.7.2
Sterile Soil Growth
John Innes Soil (John Innes Loam, a monitored soil available from Lincoln University) is pre-packed into split 50 mL Falcon tubes, which were then sealed and wrapped in a rubber coat. Approximately 100 of these tubes were then packed into buckets and sealed, before being gamma irradiated at 25-30000 Gy for 1 h, according to commercial food sterilisation practices at MSD Animal Health (MSD Animal Health New Zealand). This ensured total soil sterility and drastically reduced the handling of soil and subsequent risk of contamination.
2. General Materials and Methods
24
2.6.7.3
Spore Isolation and Inoculation of Maize Plants
Spores from T. virens Gv 29.8 were obtained from PDA plates after 7 days growth, by suspension in 10 mL dH2O and filtration through 2 layers of sterile miracloth. Spores were then counted and diluted to the appropriate concentration. Surface sterilised seeds were inoculated with a solution of 1x10⁶ T. virens spores in 10 µL of dH2O. Seeds were air dried in sterile conditions until the water had dried. Seeds were then planted.
2.6.7.4
Hydroponic Growth
Hoagland’s basal salt mixture was prepared according to section 2.3.3. Media was poured into 50 mL tubes to the 35 mL mark. A plug of sterilised cotton wool was placed into the media so that it was moist but not fully submerged. Seeds were sterilised by the method in section 2.6.7.1. As germination was not possible in this media, seeds were germinated for 3 days on sterile germination paper moistened with sterile water before being transferred to the hydroponic solution. Seeds were placed on the centre of the cotton wool, ensuring that they were not fully submerged and then grown for the appropriate duration for each experiment in a Sanyo MLR-352H humidity controlled incubator using the following conditions: 10 h maximum light (setting 5), 2 h ‘dusk’ (setting 3), 10 h ‘night’ (setting 0) and 2 h ‘dawn’ (setting 3). Humidity was set at 85% and temperature was set at 25°C.
2.6.8
Microscopy
Microscopy was carried out using light, fluorescence and confocal microscopes. Both stained and mutants expressing fluorescent mCherry red protein were used to identify Trichoderma inside plant tissue. Light microscopes were used at 20x magnification to count spores from protoplast isolations in conjunction with a haemocytometer and for general examination of fungal or bacterial colonies.
2.6.8.1
Staining
2.
General Materials and Methods
25 KOH for1 h at 90°C. The sample is then transferred into 1x PBS before application of the staining solution.
Table 9: Propidium Iodide and Alexa Fluor 488 staining solution
Staining Solution PBS 1x
Propidium Iodide 20 µg/mL Na2HPO4 1.42g/L WGA Alexa Fluor 488 10 µg/mL KH2PO4 0.245 g/L 0.02% Tween 20 NaCl 8 g/L in 1 x PBS KCl 0.2 g/L
2.6.8.2
Fluorescence Microscopy
Fluorescent microscopy was carried out on an Olympus BX51 microscope. Light microscopy was carried out at up to 100x magnification under oil, or 40x without. UV excitation was used to visualise fluorescent samples. Cell^F software was used for digitalisation of images. Green, red and blue filters were available on this microscope. Blue filter (DAPI) excites at 340-380 nm and emits at 435-385 nm. Green filter (GFP) excites at 450-490 nm and emits at 500-550 nm) and red filter (TRITC) excites at 530-560 nm and emits at 572-648 nm.
2.6.8.3
Confocal Microscopy
Confocal microscopy was carried out on a Leica TCS SP5 microscope. Laser excitation was possible between 405-633 nm. Green fluoresce of WGA Alexa Fluor 488 was excited at 488 and detected between 505-560 nm. Red fluorescence was excited at 535 nm and detected at 600-625 nm. Simultaneous detection of these fluorescent emissions was possible and overlay images were created with LAS AF-Lite imaging software. Three dimensional imaging of samples was possible using the Z-stack functionality of this microscope.