University of New Hampshire
University of New Hampshire Scholars' Repository
Applied Engineering and Sciences Scholarship
Applied Engineering and Sciences
10-16-2008
A collaborative and experiential learning model
powered by real-world projects
Mihaela C. Sabin
University of New Hampshire, Manchester, [email protected]
Follow this and additional works at:
https://scholars.unh.edu/unhmcis_facpub
This Article is brought to you for free and open access by the Applied Engineering and Sciences at University of New Hampshire Scholars' Repository. It has been accepted for inclusion in Applied Engineering and Sciences Scholarship by an authorized administrator of University of New Hampshire Scholars' Repository. For more information, please [email protected].
Recommended Citation
A Collaborative and Experiential Learning
Model
Powered
by Real-
World Projects
Mihaela Sabin
Division of Science and Technology
University of New Hampshire
Manchester, NH 03101, U.S.A
(603) 641 4144
[email protected]
ABSTRACT
Information Technology (IT) curricula’s strong application component and its focus on user centeredness and team work require that students experience directly real-world projects for real users of IT solutions. Although the merit of this IT educational tenet is universally recognized, delivering collaborative and experiential learning has its challenges. Reaching out to identify projects formulated by actual organizations adds significantly to course preparation. There is a certain level of risk involved with delivering a useful solution while, at the same time, enough room should be allowed for students to experiment with, be wrong about, review, and learn. Challenges pertaining to the real-world aspect of problem-based learning are compounded by managing student teams and assessing their work such that both individual and collective contributions are taken into account. Finally, the quality of the project releases is not the only measure of student learning. Students should be given meaningful opportunities to practice, improve, and demonstrate their communication and interpersonal skills.
In this paper we present our experience with two courses in which teams of students worked on real-world projects involving three external partners. We describe how each of the challenges listed above has impacted the course requirements, class instruction, team dynamics, assessment, and learning in these courses. Course assessment and survey data from students are linked to learning outcomes and point to areas where the collaborative and experiential learning model needs improvement.
Categories and Subject Descriptors
K.3.1 [Computer Uses in Education]: Collaborative learning.
K.3.2 [Computer and Information Science Education]: Computer science education. Information systems education. Curriculum. Self-assessment.
General Terms
Design, Experimentation, Human Factors, Management, Measurement, Performance.
Permission to make digital or hard copies of all or part of this work for personal or classroom use is granted without fee provided that copies are not made or distributed for profit or commercial advantage and that copies bear this notice and the full citation on the first page. To copy otherwise, or republish, to post on servers or to redistribute to lists, requires prior specific permission and/or a fee.
SIGITE’08, October 16–18, 2008, Cincinnati, Ohio, USA. Copyright 2008 ACM 978-1-60558-329-7/08/10...$5.00.
Keywords
Real-world team projects, self assessment and assessment of teamwork, guided instruction, and interactive teaching.
1.
!
INTRODUCTION
The Information Technology (IT) curricula’s learning outcomes emphasize strong application elements in every knowledge area [10]. Learning from direct experience with real-world team projects is a well researched approach to teaching [1, 3, 12, 18, 21], which IT education has adopted and continues to study [5, 8, 9, 15, 19]. Nonetheless, moving from theory to practice with a collaborative and experiential learning model tailored to IT education raises some critical questions. The use of real-world projects in the classroom requires that external partners offer to commit their time and resources to certain class activities, participate in preparing course requirements and assessment tools, and continue their involvement with the program curricula beyond the end of the course semester. The life expectancy of real-world projects cannot be limited to the duration of a given semester or by the student roster of a given course.
Students favor team work and are highly motivated by real experiences that are relevant to their major [4, 11, 17]. Key to this learning model is that the instructor will step down from the stage and turn it around to let students work collaboratively, formulate questions, apply concepts to a new problem, and devise and communicate solving methods. The instructor’s role of facilitating learning suggests minimal guidance instruction, whose proponents argue in favor of giving students the latitude to discover and construct knowledge for themselves. This minimally guided approach has attracted a significant following of educators, educational researchers, and instructional designers and produced very popular models, such as experiential learning [12], problem-based learning [3, 18], discovery learning [1, 4], inquiry learning [17], and constructivist learning [11, 21].
area. Thus, the instructor can apply discovery and inquiry methods to classroom instruction and pedagogical content as long as these methods accompany teaching the facts, laws, principles, theories, and practices that make up the discipline’s knowledge or content.
It follows that striking the right balance in the classroom between direct instruction and student direct involvement has larger consequences than what we might be inclined to consider. The pedagogy of interactive classes in which students work on teams and are charged with delivering solutions to external partners is faced with an array of practical questions. How are teams formed and managed? How is progress with the project ensured? How is academic performance measured? How, what, and when feedback is shared? Assessment of collaborative and experiential learning, in particular, is a complex issue [5, 6, 14, 20]. Are there multiple sources of assessment, including self, peer, clients, and other external evaluators? How is the final individual grade obtained from deliverables that are produced collectively?
Another aspect this study considers pertains to the IT curricula’s theme of discussing, disseminating, and communicating IT solution features and outcomes to the user and general public. Too often IT majors fail to communicate effectively to a non-IT audience and do not excel in interpersonal skills that facilitate that communication. Training them to acquire these skills should be complemented with meaningful opportunities in which students practice and demonstrate effective communication.
In this paper we present a model of collaborative and experiential learning we developed in two courses taught in Spring 2008. Three external partners contributed their time and staff to introduce the IT projects they needed help with. Students worked in teams and carried out a series of tasks: they conducted site visits and interacted with the users of the proposed projects; assumed different roles pertaining to the project tasks; defended their findings and offered feedback to other teams; made public presentations and demonstrations; and participated in the model’s assessment.
The model exhibits novel ways in monitoring student progress, providing prompt feedback, and creating opportunities for review and revision. Moreover, the assessment of student performance combines multiple sources of evaluation of different competencies captured by different course requirements. One source in particular, that is, students assessing themselves and their peers, has the distinctive function of determining the weights for separating individual from collective contributions for each project deliverable. Finally, the variety of the assessment means we used to measure student performance and their relevance to targeted learning outcomes, such as team work, communication, and user centeredness, made possible the evaluation of the model’s effectiveness. The results show strong student achievement of the course outcomes. Combined with student feedback, assessment data helped us determine where and how the model can be improved.
2.!
THE MODEL
Computing education literature extensively supports collaborative and experiential learning. There are compelling examples of IT and Software Engineering team projects
throughout curriculum [7, 19], which ensure that graduates develop team work skills during their entire course of study. Team projects prove to be relevant and more effective if they are developed with the participation of industry partners [5, 8, 9] or non-profit organizations [15], or if they simulate a company environment to expose students to real-world product and project management situations [23]. Bringing projects with
outside clients into the classroom raises specific client
management issues and affects the way student teams operate and projects are assessed [2]. Assessing group projects poses the particular problem of determining individual credit for each student whose work partly counts to the project deliverables [5, 6, 14, 20].
The model we propose addresses these challenges. Guided by learning objectives that focus on team work, communication skills, problem solving skills, user centeredness, and planning effectively the development of a real-world project, we propose curricular, pedagogical, and assessment methods that improve student performance.
2.1!
Objectives
The Computing Curricula Information Technology Volume report [10] emphasizes the integrative nature of the IT discipline. This definitional trait is reflected in the report’s fourteen characteristics of IT graduates (or program outcomes) and the seven pervasive themes that run throughout the IT program’s outcomes. Among the student learning outcomes, three in particular have influenced our model:
•! Ability to function effectively on teams to accomplish a common goal
•! Ability to communicate effectively with a range of audiences
•! Ability to identify and analyze user needs and take them into account in the selection, creation, evaluation, and administration of computer-based systems.
These outcomes connect closely to three of the topics that are “woven like threads throughout the tapestry of the IT curriculum,” that is, professionalism, interpersonal skills, and user centeredness and advocacy. They all underline that designing and integrating IT-based solutions occur with a user in mind, whether an individual or an organization. Consequently, IT graduates will be involved at all levels in organizations and will work in diverse teams. Their professionalism and interpersonal skills define the “face” that the organization and general public see first.
The model we propose focuses on effective team work and communication and interpersonal skills, and promotes a professional behavior that is mindful of the importance of users and organizational culture and diversity. In addition, since all the learning outcomes listed in the IT computing curricula report rely on a strong application component, we support the recommendation that experiential learning should “permeate the IT curriculum.”
2.2!
Curricular Features
model that uses experiential learning and gives high priority to the objectives mentioned above. The courses, CIS610 System Analysis and Design and CIS650 System Implementation with DBMS, were taught in Spring 2008. Common to both courses are the following features:
•! Teams of students work on semester-long course projects that have real “clients”, who are community partners in the Manchester area.
•! The student teams make three client site visits during the semester.
•! The projects have four releases and a final project report. Release proposals are presented and discussed in class prior to the final release submissions.
•! Teams submit weekly reports.
•! Students present their experience at the UNH Undergraduate Research Conference by participating in the poster session.
•! Two special class periods “bookmark” the students learning experience: Meet the Clients workshop at the beginning of the semester and the project demonstrations event, at the end of the semester, with the participation of clients and other guests (faculty in the program and IT professionals).
•! Projects are not discarded or closed at the end of the semester. They become a curricular resource for other courses in the program, including these two courses when scheduled next time around.
The teams were formed in the first day of class based on student personal preferences. Given the class sizes of 14 students in CIS610 and 10 students in CIS650, we imposed the restriction that teams have 3 or 4 members. Most of the student choices were determined by the commonality of their course schedules. This factor became a priority because of the explicit requirement that at least six hours be spent weekly outside class, with a split of 2 to 3 hours individual work and 3 to 4 hours team work. Another factor took into account that six of the students were enrolled in both courses. All six students chose to have a second member on the team from the pool of students who were taking
both courses.
The CIS610 teams’ responsibilities were to (1) capture, analyze, refine, and document user requirements, and to (2) produce analysis artifacts and a preliminary design study for an IT solution that meets the user needs. The teams in the CIS650 class were asked to (1) use and apply database concepts, practices, and tools, and (2) carry on an application development process to deliver a database application that meets the user requirements. All teams shared the responsibilities for (3) planning and managing project work and mitigating risk factors the team might encounter, and (4) improving personal and interpersonal communication through interaction with team members and the project client. Each team has its members assume the roles of product manager, project architect, and developer. The CIS610 teams had one product manager and two or three architects. The CIS650 teams had one product manager, one or two architects, and a one developer.
2.3!
Community Outreach Projects
The University of New Hampshire academic plan includes engagement and outreach to meet the needs of the citizens of New Hampshire and beyond. UNH Manchester College has the strategic goal of enhancing outreach efforts and, as a result, increasing the college relevance and importance in the greater Manchester community. With UNH funding for an outreach scholarship project, we were able to develop a partnership with three non-profit organizations in Manchester area: Massabesic Audubon Center, Salvation Army in Manchester, and New Hampshire Catholic Charities. They all expressed interest in contributing to the program’s curriculum real-world IT projects for which they needed improved IT solutions. They have responded very positively to our request for direct collaboration
with the students involved with developing the desired IT solutions.
The external partners who have participated in the implementation of our model hosted three site visits and evaluated some of the student performance. They have been also the resource for assisting students with the analysis of the user needs and computing requirements for the projects.
There were four projects in the CIS610 System Analysis and Design course: a volunteer management system for Salvation Army in Manchester, an asset mapping database system for New Hampshire Catholic Charities, and two community program management systems for Massabesic Audubon Center. Four student teams were set up initially, two teams of three students and two of four. One four-student team lost a member who dropped the course by mid-semester. In the end, 13 students worked on the CIS610 projects.
The CIS650 System Implementation with DBMS course had 10 students, assigned to three teams, two of three students and one of four. All teams had the same external partner, Massabesic Audubon Center, and the same project assignment, the development of a database application to manage the center’s community programs: registering participants, scheduling events, tracking volunteers, sponsors, and donors, renting equipment and facilities.
Each project had seven milestones: four project releases, two public presentations (poster presentation and project demo), and a final project report. Students were responsible for scheduling weekly time for team meetings and their three client site visits. The courses introduced new concepts, techniques, and tools, and combined coverage of theoretical aspects with the analysis of case studies and practice with adequate tools. UML editors were used in the CIS610 course. In CIS650 we had an Oracle 10g Express Edition DBMS installed in the lab. Students developed their database applications on the server using Oracle SQL Developer IDE and a rapid application development tool kit for web-based IT solutions, Oracle application express (APEX).
2.4!
Interactive T
eaching
1.! First exposure, when students first encounter new information, concepts, and procedures of the subject matter.
2.! Process, when students assimilate and transform the material to which they have been exposed and produce work required in the course.
3.! Grading and feedback, which the instructor produces in response to student work.
In traditional lecture-based teaching, the instructor uses most of the class time for first exposure. Students use their study time outside class to do work that is assigned for next class. The instructor expects students to process the material taught in class, use feedback to previously graded work, and, desirably, solicit additional feedback via email or office hours. Such a
learning iteration is parameterized by where learning occurs,
whether in class or outside class, and by whom participates in the process, whether the student, the instructor, or both.
Instructor Student
In-class
?
Outside class
Figure 1 Lecture-based teaching with minimal student involvement during class time
Although Figure 1 oversimplifies the relationship between direct instruction and student involvement in the learning process, it undoubtedly points out that in-class time is underutilized. Walvoord and Anderson’s interactive teaching method shifts the responsibility for first exposure into the student study time and makes effective use of class time for process and feedback (Figure 2).
Student Instructor
In class
Outside class
Figure 2 Interactive teaching with student direct
involvement during class time
The most familiar application of this method requires students to do reading assignments prior to class and actively participate in class by asking questions, working in break up groups, doing lab activities, presenting and defending problem solutions, and such. Despite its obviousness, teachers very well know that assigned reading does not get read outside class and the repeated invitation to students to ask questions in class turns many times rhetorical.
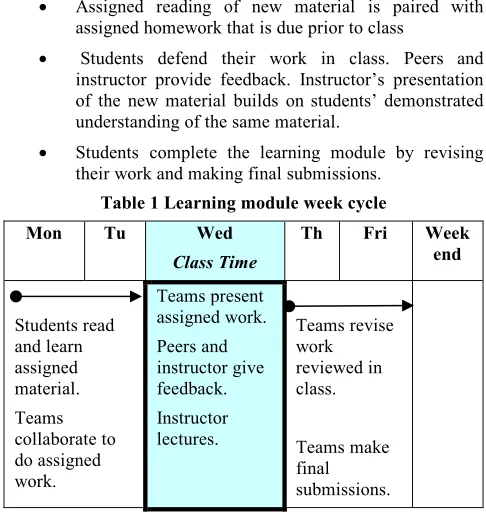
Our application of interactive teaching is based on the assumption that a new learning module, which spans an entire week, does not start with the class period. Note that courses at
UNH Manchester are 16-week long and have one three-hour class per week. Table 1 shows an example of a learning module cycle with Wednesday classes, whose typical elements are:
•! Assigned reading of new material is paired with assigned homework that is due prior to class
•! Students defend their work in class. Peers and instructor provide feedback. Instructor’s presentation of the new material builds on students’ demonstrated understanding of the same material.
•! Students complete the learning module by revising their work and making final submissions.
Table 1 Learning module week cycle
Mon Tu Wed
Class Time
Th Fri Week
end
Students read and learn assigned material. Teams collaborate to do assigned work.
Teams present assigned work. Peers and instructor give feedback. Instructor
lectures.
Teams revise
work reviewed in class.
Teams make final submissions.
2.5!
Assessment
We consider that the curricular content and teaching methods in our instructional model prepare students to achieve the course learning outcomes. We also know that in an effective instructional model course requirements should be mapped to learning outcomes through adequate course assessments. In this section we present how course projects were evaluated and students graded. Two guiding principles were used to devise the model’s assessment scheme:
•! Assessment tools use rubrics whose criteria map to the intended learning outcomes.
•! Assessment data is collected from assessors who are directly involved with what is being assessed.
2.6!
Sources of Assessment and
Accountability
Project evaluation took into account three components: (1) the product, what teams delivered; (2) the process, how teams worked; and (3) public presentations and demonstrations, what teams told the outside world about their work. Students learned in the course by contributing to the team’s deliverables (project releases, public poster preparation and presentation, project report and demonstration), and by participating in the team work, such as, interaction and communication within the team and with the client. The final grade reflected both individual and team work.Research shows that self and peer assessment [5, 6, 20] is the best source of meaningful data to measure competencies, behaviors, and skills pertaining to team work. Several sources of assessment, such as peers, self, instructor, clients, and staff involved in the team project development provide critical First Exposure
Grading & Feedback Process
Process First Exposure
Process
First Exposure Feedback
information and perspectives and address the issues of fairness,
consistency, and accuracy effectively. Our assessment tools used multiple assessors: instructor (I), self and peers (S/P), clients (C), and external evaluators (E), such as faculty in the program, alumni, and IT professionals. The breakup between instructor and other sources’ contribution to the final grade was 50% instructor and 50% others. The percentage of the individual component of the final grade was 40% and team component’s was 60%. Table 2 details the distribution of points according to these two assessment dimensions, sources of assessment and sources of accountability.
Table 2 Assessment scheme
Category Component Project Pts Team Indivi- dual
Team
Deliverables
(66 pts)
Release v0.2 15 9 (I) 6 (S/P)
Release v0.4 15 9 (I) 6 (S/P) Release v0.6 15 9 (I) 6 (S/P) Release v0.8 15 9 (I) 6 (S/P) Project Report v1.0 6 4 (P) 2 (S/P)
Team Present. (14 pts)
Poster Presentation 7 4 (E) 3 (S/P) Project Demos 7 4 (P/C/E) 3 (S/P) Individual Deliv.
(8 pts)
One odd-numbered
release proposal 8 0 8 (I)
Team Work Process (12 pts)
Site Visits 6 6 (C) 0
Weekly Reports 6 6 (I) 0
Total 100 60 40
The assessment instruments used rubrics with criteria reflective of the expected learning outcomes associated with the project components that were assessed.
2.7!
Self and Peer Assessment
Of particular importance were the self and peer evaluations students submitted along with the project deliverables. Based on solutions advanced by Clark et al. [6] and Smith and Smarkusky [20] we developed a form with criteria in five areas: communication, interaction, process, contribution, and responsibility. Students were asked to score themselves and
their peers using a 1 to 5 scale (from less than satisfactory to outstanding) for each criterion. For example, the criteria assessing individual contribution to a project deliverable were: team member follows project processes, contributes in team decision making, provides constructive feedback, motivates and encourages positive contributions in others. Students were also asked to provide comments on their individual responsibilities within the group, as well as team members’ performance.
Finally, they had to quantify the relative contribution of each team member by distributing a fake $1,000 bonus among team members.
This relative contribution measure was used to determine the individual component of the grade for each project deliverable. We applied the formula proposed by Clark et al. [6], which takes into account the team size, the grade the team received for the project deliverable, the maximum number of points possibleat team and individual level, and the student’s relative contribution.
Let us consider the example of one of the project releases. The maximum number of points possible is 15 of which 9 account for team work (max team = 9) and 6 for individual work (max ind = 6). We assume that the team has 3 students (team size = 3) and the team grade students got for that release is 8 (team grade = 8). We want to calculate the grade for one of the students,
3.!
RESEARCH METHOD
The study’s most important objective is to evaluate the model’s effectiveness. Does student performance show high levels of competency in carrying out a team project for a real client? More specifically, do students communicate effectively? Do they function effectively on teams? Does their solution meet the user needs? Do they use and apply current concepts and practices to complete their projects? The source of data we used to find answers to these questions was the student performance measured in the two courses with which we implemented our model. The diversity of assessment tools helped us focus on learning outcomes of interest, which fall into five broad skill categories: user centeredness, team work, communication, problem solving, and project planning skills.
In our study we used eight learning outcomes from the list of fourteen in the IT curricula report (see Table 3). We note that these outcomes correspond to the recently revised ABET CAC accreditation criteria as follows: five correspond to computing requirements (labeled C) and three to Information Technology accreditation requirements (labeled IT).
Table 3Computing and IT learning outcomes
C1 Ability to analyze a problem and identify and define computing requirements
C2 Ability to design, implement, and evaluate a computer-based system, process, component, or program to meet desired needs
C3 Ability to function effectively on teams to accomplish a common goal
C4 Ability to communicate effectively with a range of audiences
C5 Ability to use current techniques, skills, and tools necessary for computing practice
IT6 Ability to use and apply current technical concepts and practices in the core information technologies
IT7
Ability to identify and analyze user needs and take them into account in the selection, creation, evaluation, and administration of computer-based systems
IT8 Ability to assist in the creation of an effective project plan
We also used two student survey instruments, pre- and post-course, with which we collected student feedback on their experience with team work, real-world projects, course time requirements and grading scheme, and public presentations. Students were also asked to rank the learning outcomes we used in the study based on how they perceive the outcomes’ importance and the degree to which the course facilitated student achievement of each of those outcomes. Student feedback was used to identify areas in the course requirements and teaching methods which need improvement.
The academic performance of 23 students in CIS610 and CIS650 courses was examined for this study. All 23 filled out the pre-course survey, and 22 completed the post-pre-course survey.
4.!
RESULTS AND DISCUSSION
The student overall performance in both courses was strong (Figure 3), with final grades of B- and higher. All seven teams participated in the poster session of the university’s Undergraduate Research Conference (URC) in April 2008. One team received an honorable mention from the panel of judges who evaluated the posters.
Figure 3 Final grades in CIS610 and CIS650 courses
4.1!
Learning Outcomes
To correlate student performance with the learning outcomes in Table 3, we had to identify which student results and to what degree they were reflective of certain learning outcomes. The variety of the assessment means we used to evaluate student performance and their relevance to the course objectives helped us estimate student achievement of the learning outcomes.
Table 4 Mapping project components to learning outcomes
4Rs ID PRD SV WR
Team work 0.25 0.1 0.2 0.25 0.2
Communication 0.1 0.5 0.3 0.1
Problem solving 0.4 0.4 0.1 0.1
User centeredness 0.1 0.1 0.1 0.7
Project planning 0.1 0.1 0.1 0.7
Given the early stage of the implementation of our model, we use a very simple scheme to make these estimations. The project components in Table 2 were partitioned into: project releases (4Rs), individual deliverable (ID), project poster, report, and demo (PRD), client site visits (SV) and weekly reports (WR). The learning outcomes in Table 3 were partitioned into: team work (C3), communication (C4), problem solving (C1, C5, IT6), user centeredness (C2, IT7), and project planning (IT8). We assigned weights to the project components to indicate how relevant they are to the broader skill categories (Table 4). By applying these weights to the student performance recorded for
the corresponding project components we obtained the results in
Table 5 (shown in descending order).
Although these results are aligned with the strong student overall performance, as expected, they indicate a lower level of ability in user centeredness and project planning. A short-term direction for future work is to discriminate with finer granularity between the levels of outcome achievement. One way to do it is to refine the weight matrix in Table 4 such that target learning
70.0 75.0 80.0 85.0 90.0 95.0 100.0
1 3 5 7 9 11 13 15 17 19 21 23
outcomes replace the broader clusters of outcomes (across rows) and individual project components replace some of the project component aggregates (across columns).
Table 5 Outcome-based student performance
# Outcome Score
C1 Analyze problem/identify computing requirements 89.67
C5 Use techniques, skills, tools 89.67
IT6 Use and apply concepts and practices 89.67 C3 Function effectively on teams 89.03
C4 Communicate effectively with a range of audiences 88.14
IT8 Assist with creation of an effective project plan 86.89
IT7 Identify & analyze user needs to deliver IT solution 86.83
C2 Design, implement, evaluate […] to meet desired needs 86.83
Having isolated the areas where there is room for improvement, we are interested in finding out how we can improve. This is where student feedback becomes very useful.
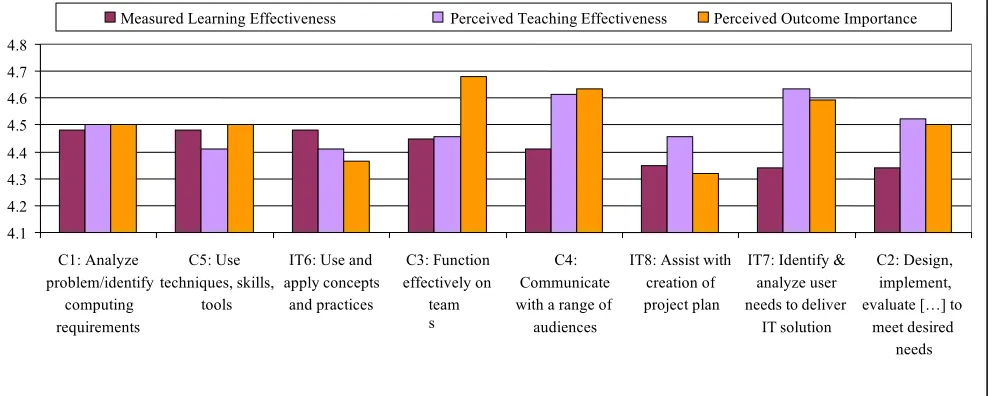
In the post-course survey, students were asked to rank the eight learning outcomes based on two criteria: how important these outcomes are to their learning and how effectively the courses prepared them to achieve these outcomes. A 1 to 5 scale was
used to rank the learning outcomes by student perceived importance and student perceived teaching effectiveness. We wanted to compare student perceptions with student actual performance. Thus, we scaled down the scores of
outcome-based student performance (Table 5) to match the 1 to 5 range and we named them measured learning effectiveness. We collected all results for comparison in Figure 4 (shown in decreasing order of measured learning effectiveness).
The most important observation is that user centeredness and
communication types of outcomes (C4, IT7, and C2 in Figure 4), show the largest discrepancy between lower student achievement on these outcomes and how highly students perceive these outcomes’ importance and teaching effectiveness. It tells us that we have to emphasize higher expectations for the client site visits and for project documentation and public presentations and demonstrations. We should also consider working closely with the clients to more rigorously evaluate student work in these areas and provide more avenues for formative assessment.
Apart from all the other outcomes, C3: Function effectively on teams shows the highest level of perceived importance and largest offset from its effectiveness levels, perceived and measured, both almost identical. It tells us that there is a lot of untapped receptiveness at the student end and that we can do a much better job teaching students effective team work practices. The last observation concerns IT8 on project planning, which has the lowest perceived importance. We attribute the student lack of interest in project planning to the highly prescribed project development ‘pace’, with release deadlines and project
presentations scheduled up front. As we will show in the rest of this section, handling time requirements for these courses was
the students’ biggest hurdle and their control on planning activities was severely limited.
Figure 4 Comparative results of measured learning effectiveness and student perceived importance and perceived teaching effectiveness of learning outcomes
One improvement we should consider is structuring the content
of weekly reports to make planning activities more explicit
4.2!
The most important contributor to the student achievements wasStudent Feedback
time on task. The model proved successful in making students spend the required time outside class. We used the pre-course survey to solicit student written commitment for at least six4.1
4.2 4.3 4.4 4.5 4.6 4.7 4.8
C1: Analyze problem/identify
computing requirements
C5: Use techniques, skills,
tools
IT6: Use and apply concepts
and practices
C3: Function effectively on
team s
C4: Communicate with a range of audiences
IT8: Assist with creation of project plan
IT7: Identify & analyze user needs to deliver
IT solution
C2: Design, implement, evaluate […] to
meet desired
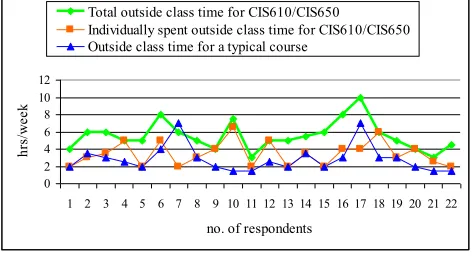
hours outside class time in the CIS610/650 courses (58% of the students had prior experience with team projects). In the post-course survey students reported that they spent almost twice as much time outside class (5.52 hrs/week on average, in the 3 to 10 hrs/week range) than in any other course (2.86 hrs/week). Even the individual portion of the outside class time is 21% higher than the typical outside class time for any other course (Figure 5).
Figure 5 Outside class time analysis
One interesting fact is the discrepancy between student reported time outside class and what we calculated as outside time based on more specific information provided by students about their semester course load and time spent outside class on various types of courses. This immediately highlights questionable time management skills. Our college is primarily a commuting school and all but one student had a paid job and/or internship. The reported job/internship time averaged 29.3 hours/week, which is almost identical to the total average academic time, inside and outside class, of 29.5 hours/week. With time demands averaging 60 hours/week, it is a very serious challenge to find the time for team meetings, client site visits, public presentations, and online collaboration to prepare the project deliverables. How we address this problem is a much larger issue, which goes beyond the scope of this paper.
The other four areas of interest for which we solicited student
feedback were team work, relationship with the client, the
project presentation events, and the grading system.
We were pleased to find out that students were very favorable of the grading system. Students reported that the grading scheme (Table 2) adequately accounted for team contributions (4.68 highest average score with the lowest standard deviation of 0.57), particular project deliverables (avg=4.59, SD=0.59), and individual contributions (avg=4.50, SD=0.96). Course
assessment made appropriate use of multiple sources (4.50) and adequately reflected team work versus individual work (4.41). The lowest scores were recorded for how self and peer evaluations adjust the points a member earns for a project deliverable authored by the team (4.33) and the overall understanding of the assessment scheme (4.23). We have learned that how assessment works should be revisited in class when evaluation results are communicated to students for each project deliverable. Special emphasis should be given to the crucial control students have on adjusting the individual component of the grade for their peers on any team deliverable. We observed that in general they tend to shy away from penalizing team members who underperform.
Student feedback on team work was very valuable. The highest and strongest agreement (avg=4.85, SD=0.47) was on the
essentiality of team work to the success of the course project. The strongest disagreement (lowest average score of 3 and largest SD of 1.33) was on the question whether “All team members contributed equally.” This feedback is supported by the observation that none of the teams had the same final grades for all team members. Another interesting aspect is that students ranked higher the role of “Imyself” then the role of “others.” For example, “My communication within the team was effective and timely” scored 4.41 on average, while its counterpart “The other team members communicated effectively and timely” scored 4.23.
The relationship with the client and the opportunities for
communicating project findings to the general public are the areas where the model should reevaluate its methods. Although students admitted that their teams were very committed to succeed with the poster presentation (avg=4.41), they reported much lower scores on actually having enjoyed the poster presentation and project demonstration events (3.95 and 3.82), and expected a higher involvement of the external partners with these events (avg=3.14). The latter feedback item is supported by the students evaluation of the overall involvement of the client with the project (avg=3.07), the lowest in the client relationship category. Since time management was the biggest challenge, we plan to arrange with the clients to have one or two meetings with the students at school. We believe that some additional infrastructure needs to be in place for a more effective connection between student teams and external partners. For example, we are exploring ways to extend the outreach model and engage industry fellows with IT professional experience to contribute to the communication between student teams and external partners.
5.
!
CONCLUSION
Team projects with real clients motivate students to commit the required time to successfully complete challenging projects. Collaborative and experiential learning has many merits. However, a judicious combination between direct instruction of the subject matter and student direct involvement during class
time is necessary to maximize the learning experience. To
ensure that the course objectives are met, assessment means should closely target learning outcomes we want students to achieve. Assessment data from multiple sources and student feedback are essential to informed our effective decisions for continuous improvement.
REFERENCES
[1]! Anthony, W.S. 1973. Learning to discover rules by discovery. Journal of Educational Psychology, 64, 3 (June 1973), 325-328.
[2]! Judith, W.C., Bair, B., Borstler, J., Lethbridge, T.C., and Surendran, K. 2003. Client sponsored projects in software engineering courses. ACM SIGCSE Bulletin, 35, 1, 401-402.
[3]! Barrows, H.S. and Tamblyn, R.M. 1980. Problem-based learning: An approach to medical education. Springer, New York.
0 2 4 6 8 10 12
1 2 3 4 5 6 7 8 9 10 11 12 13 14 15 16 17 18 19 20 21 22
no. of respondents
hr
s/
w
ee
k
Total outside class time for CIS610/CIS650
[4]! Bruner, J.S. 1961. The art of discovery. Harvard Educational Review, 31, 1, 21-32.
[5]! Clark, N. 2005. Evaluating student teams developing unique industry projects. In Proceedings of the 7th Australian Computing Education Conference (Newcastle, Australia, 2005).
[6]! Clark, N., Davies, P., and Skeers, R. 2005. Self and Peer Assessment in Software Engineering Projects. In Proceedings of the 7th Australian Computing Education Conference (Newcastle, Australia, 2005).
[7]! Fenwick Jr., J.B. and Kurtz, B. 2005. Intra-curriculum software engineering education. ACM SIGCSE Bulletin, 37, 1, 540-544.
[8]! Gorka, S., Miller, J.R., and Howe, B.J. 2007. Developing Realistic Capstone Projects in Conjunction with Industry. In Proceedings of the SIGITE Conference on Information Technology Education (Destin, FL, USA., October 2007). [9]! Grisham, P.S., Krasner, H., and Perry, D.E. 2006. Data
engineering education with real-world projects. ACM
SIGCSE Bulletin, 38, 2, 64-48.
[10]!Joint Task Force on IT Computing Curricula. 2008. Computing Curricula Information Technology Volume. Retrieved June 26, 2008 from
http://campus.acm.org/public/comments/it-curriculum-draft-may-2008.pdf
[11]!Jonassen, D. 1991. Objectivism versus constructivism. Educational Technology Research and Development, 39, 3, 5-14.
[12]!Kolb, D.A. 1984. Experiential learning: Experience as the source of learning and development. Prentice-Hall, Englewood Cliffs, NJ.
[13]!Kirschner, P.K., Sweller, J., and Clark, R.E. 2006. Why
Minimal Guidance During Instruction Does Not Work: An Analysis of the Failure of Constructivist, Discovery, Problem-Based, Experiential, and Inquiry-Based Teaching.
Educational Psychologist, 41, 2, 75-86.
[14]!LeJeune, N. 2006. Assessment of individuals on CS group projects. Journal of Computing Sciences in Colleges, 22, 1. [15]!Leidig, P.M., Ferguson, R., and Leidig, J. 2006. The Use of
Community-Based Non-Profit Organizations in Information Systems Capstone Projects.” ACM SIGCSE Bulleting, 38, 3.
[16]!Mayer, R. 2004. Should there be a three-strikes rule against pure discovery learning? The case for guided-methods of
instruction. American Psychologist, 59, 1, 14-19. [17]!Papert, S. 1980. Mindstorms: Children, computers, and
powerful ideas. New York: Basic Books.
[18]!Schmidt, H.G. 1983. Problem-based learning: Rationale and description. Medical Education, 17, 1, 11-16.
[19]!Smarkusky, D., Dempsey, R., Ludka, J., and Quillettes, F. 2005. Enhancing team knowledge: instruction vs. experience. ACM SIGCSE Bulletin, 37, 1, 460-464. [20]!Smith, III, H.H. and Smarkusky, D. 2005. Competency
Matrices for Peer Assessment of Individuals in Team Projects. In Proceedings of the SIGITE Conference on
Information Technology Education (Newark, NJ, USA, 2005).
[21]!Steffe, L. and Gale, J. 1995. Toward a theory of cognitive
aptitude for learning from instruction. Journal of Educational Psychologist, 76, 347-376.
[22]!Sweller, J. 2003. Evolution of human cognitive architecture. In The Psychology of Learning and Motivation, B. Ross, Ed. Academic, San Diego, CA, 43, 215-266.
[23]!Tan, J. and Phillips, J. 2005. Real-world project management in the academic environment. Journal of Computing Sciences in Colleges, 20, 5.