Persistent Postconcussion
Symptoms After Injury
Linda Ewing-Cobbs, PhD, a, b Charles S. Cox Jr, MD, c Amy E. Clark, MS, d
Richard Holubkov, PhD, d Heather T. Keenan, MDCM, PhDd
OBJECTIVES: We examined whether preinjury, demographic, and family factors influenced
vulnerability to postconcussion symptoms (PCSs) persisting the year after mild traumatic brain injury (mTBI).
METHODS: Children with mTBI (n = 119), complicated mild traumatic brain injury (cmTBI)
(n = 110), or orthopedic injury (OI) (n = 118), recruited from emergency departments, were
enrolled in a prospective, longitudinal cohort study. Caregivers completed retrospective surveys to characterize preinjury demographic, child, and family characteristics. PCSs were assessed using a validated rating scale. With multivariable general linear models adjusted for preinjury symptoms, we examined predictors of PCSs 3, 6, and 12 months after injury in children ages 4 to 8, 9 to 12, and 13 to 15 years at injury. With logistic regression, we examined predictors of chronic PCSs 1 year after traumatic brain injury.
RESULTS: Postinjury somatic, emotional, cognitive, and fatigue PCSs were similar in the mTBI
and cmTBI groups and significantly elevated compared with the OI group. PCS trajectories varied with age and sex. Adolescents had elevated PCSs that improved; young children had lower initial symptoms and less change. Despite similar preinjury PCSs, girls had elevated symptoms across all time points compared with boys. PCS vulnerability factors included female sex, adolescence, preinjury mood problems, lower income, and family discord. Social capital was a protective factor. PCSs persisted in 25% to 31% of the traumatic brain injury group and 18% of the OI group at 1 year postinjury. The odds of chronic PCSs were almost twice as high in girls as in boys and were >4 times higher in young children with cmTBI than in those with mTBI.
CONCLUSIONS: A significant minority of children with mTBI and OI have PCSs that persisted 1
year after injury.
abstract
NIH
aChildren’s Learning Institute and Departments of bPediatrics and cPediatric Surgery, John P. and Katherine G. McGovern Medical School, The University of Texas Health Science Center at Houston, Houston, Texas; and dDepartment of Pediatrics, The University of Utah, Salt Lake City, Utah
Drs Ewing-Cobbs and Keenan conceptualized and designed the study, drafted the initial manuscript, and reviewed and revised the manuscript; Dr Cox made substantial contributions to the acquisition of data and critically reviewed and revised the manuscript for important intellectual content; Ms Clark and Dr Holubkov made substantial contributions to the analysis and interpretation of data and revised the manuscript for important intellectual content; and all authors approved the final manuscript as submitted and agree to be accountable for all aspects of the work.
DOI: https:// doi. org/ 10. 1542/ peds. 2018- 0939 Accepted for publication Aug 29, 2018
Address correspondence to Linda Ewing-Cobbs, PhD, Department of Pediatrics, Children’s Learning Institute, The University of Texas Health Science Center at Houston, 7000 Fannin St, Suite 2401, Houston, TX 77030. E-mail: [email protected]
WHAT’S KNOWN ON THIS SUBJECT: After mild traumatic brain injury (mTBI), ∼15% to 30% of children have postconcussion symptoms (PCSs) for several months. There is little consensus regarding which injury-related, child demographic, preinjury, and family factors confer vulnerability to or protect against PCSs persisting during the first year.
WHAT THIS STUDY ADDS: Vulnerability factors used to predict PCSs persisting during the year after uncomplicated mTBI (25%), complicated mTBI (31%), or orthopedic injury (18%) included preinjury affective problems, female sex, adolescence, and family stresses. Girls had twice the odds of having chronic PCS compared with boys.
Postconcussion symptoms (PCSs) are cognitive, physical, and affective symptoms, such as difficulty concentrating, headache, and irritability, that occur in ∼30% children with mild traumatic brain injury (mTBI) seen in the emergency department (ED). Although PCSs resolve in many children with mTBI within 1 week to 1 month, 1, 2
symptoms persist for ≥1 month in 11% to 30% and negatively impact functioning at home and school.2–5
PCSs or “concussionlike symptoms”
are relatively nonspecific and are endorsed after traumatic brain injury (TBI), to a lesser extent by children experiencing bodily injuries, 3, 6–8 and
by some children without injuries.9
Even in children whose PCSs resolve, persistent reductions in health-related quality of life, particularly in physical or academic areas, are documented in children who are managed up to 1 year after injury.10, 11
The literature is inconsistent regarding injury and noninjury factors that may place children at high risk for prolonged PCSs. Greater injury severity and positive computed tomography (CT) scan findings are often used to predict acute PCSs; however, preinjury characteristics of the child and family, including increasing age, female sex, poorer preinjury child adjustment, and family dysfunction, may be used to predict more chronic PCSs.2, 5, 12–15 Persistent PCSs have
a major impact on both health care and school systems. With 1 million to 2 million US children sustaining a concussion from just sport and recreation participation annually, 16
it is essential to identify injury and noninjury factors that either promote or hinder recovery from mTBI. To address gaps in the literature, we examined parent ratings of PCSs in a prospective, longitudinal cohort study of recovery from pediatric mTBI relative to an orthopedic injury (OI) comparison group. We
hypothesized that elevated parent ratings of PCSs during the first year after a mTBI would be associated with vulnerability factors of greater injury severity (including loss of consciousness and the presence of neuroimaging abnormalities), demographic variables (including older age and female sex), preinjury child factors (including learning and psychological health difficulties), and family circumstances (including poverty and poorer family functioning). Social capital, or a family’s connectedness to the community, was expected to buffer the effects of injury on PCSs.
METHODS
Participants were children ages 4 to 15 years who sustained a mTBI or OI and were recruited from the ED at 2 level 1 pediatric trauma centers (Children’s Memorial Hermann Hospital and the University of Texas Health Science Center at Houston [Houston, TX] and Primary Children’s Hospital [Salt Lake City, UT]) as part of a larger cohort study from January 2013 through September 2015. Recruitment was sequential and stratified by age at injury (4–5, 6–11, and 12–15 years), type of injury, and TBI severity. Children with severe psychiatric disorders or developmental delay were excluded because of difficulty assessing the impact of injury on outcomes. Institutional review board approval was received from each institution. Parents provided consent. Children
≥8 years of age provided assent.
Definitions
TBI severity was based on the lowest ED Glasgow Coma Scale (GCS) score.17 mTBI was defined
on the basis of the World Health Organization18 and Centers for
Disease Control and Prevention19
criteria of a GCS score of 13 to 15 on presentation for health care with 1 or more of the following: confusion or
disorientation, loss of consciousness for ≤30 minutes, posttraumatic amnesia for <24 hours, the presence or absence of a skull fracture, and/ or other transient neurologic abnormalities. Complicated mild traumatic brain injury (cmTBI) met the above criteria but included an intracranial contusion or hemorrhage diagnosed by using a CT scan.20 CT
imaging in the ED was performed for clinical indication only. Those in an OI comparison group sustained an extremity fracture but no head injury. The Abbreviated Injury Scale21 score
and Injury Severity Score were assigned by trauma registrars.
Procedure
Parents or legal guardians completed a survey as soon as possible after injury to characterize preinjury family structure, sociodemographic, and child characteristics. Follow-up surveys were scheduled for 3, 6, and 12 months after injury. English-speaking families completed surveys either online or by telephone interview; Spanish-speaking families completed telephone interviews with bilingual study coordinators.
Child and Family Measures Child Behavior Checklist
We used the attention-deficit/ hyperactivity disorder (ADHD), affective disorder, and anxiety disorder scales yielding t scores normed for age and sex; higher scores indicate more problems.22
The Child Behavior Checklist (CBCL) has excellent test-retest reliability (r = 0.7–0.8) and internal consistency (α = 0.90–0.94) at 1 year.
Postconcussion Symptom
Inventory–Parent
The Postconcussion Symptom Inventory–Parent (PCSI-P) scale is a validated parent-report measure used to provide a total score and physical, cognitive, emotional, and fatigue subscores.23 It has 20
that are used to discriminate children who are concussed from those who are uninjured ages 5 to 15 years; we extended the age range to include 4-year-olds for consistency with other survey measures. A global question asked to what degree the child acted differently than before the injury. The PCSI-P total score has favorable internal consistency (α = 0.94). Higher scores indicate more symptoms.
The presence or absence of PCSs was dichotomized on the basis of the International Classification of Diseases, 10th Revision (ICD-10) criterion of at least 1 symptom being present (or, for follow-up, increasing relative to preinjury) in at least 3 of the following areas: cognitive, emotional, somatic, and sleep and/or fatigue.
Family Environment Covariates
Preinjury family function was assessed by using the McMaster Family Assessment Device (FAD)–
General Functioning Scale.24 The FAD
has 12 items scored 1 to 4; higher scores represent worse functioning. The Social Capital Index is used to measure perceptions of personal, family, neighborhood, and spiritual community support; higher total scores indicate greater support.25
Families self-reported race, ethnicity, and income by family size; we calculated income relative to the poverty level using federal norms.
Statistical Approach
All children with outcomes available at preinjury and at least 1 follow-up time point were included in the analysis. Generalized linear mixed models, in which maximum likelihood estimation is used to incorporate all available outcome data, were fit with an unstructured covariance matrix and empirical estimates of the SE for model parameters for PCSI-P total scores and subscores by using SAS PROC MIXED (SAS Institute, Inc, Cary,
NC). Potentially clinically important covariates were selected a priori, including the 3-way and 2-way interactions between injury group, time, and age (4–8, 9–12, and 13–15 years). Additional candidate covariates, including enrollment site, injury factors (previous concussion and loss of consciousness), child characteristics (sex; race and/ or ethnicity; preinjury learning, behavioral, or developmental delay; and preinjury CBCL scores), and parent and/or family factors (respondent education, poverty level, preferred language, FAD score, social capital) were initially screened in a model controlled for preinjury PCSI-P score, injury group, time, and injury group by time interaction. To develop the final reported longitudinal models, a full model that included all candidate covariates with P < .20 in initial screening, and these 4 factors, was iteratively reduced by removing variables (excluding preinjury PCSI-P score and main effects of injury and time) with P > .1. To identify predictors of chronic PCSs (yes or no) at the 1-year follow-up, multivariable logistic regression models were constructed by using an analogous
approach. In all analyses, we used a significance level of .05.
RESULTS
Study Population
Of the 414 children who consented to participate, 383 (93%) completed the initial survey in which we assessed retrospective ratings of preinjury PCSs and child and family functioning. The final cohort contained 347 (91%) children completing at least 1 postinjury assessment: 119 children with mTBI, 110 with cmTBI, and 118 with OI (Fig 1). In Supplemental Table 5, we compare key variables for children who did and did not have complete data; retention was lower in Hispanic children from the Houston site. Most families (76%) completed surveys online and had an English language preference (90%). The injury groups did not differ significantly on age, sex, race, or parental employment; however, parent income and education were lower in the mTBI group. Preinjury child psychological health and PCS estimates did not differ significantly across groups (Tables 1 and 2) or by sex.
FIGURE 1
TABLE 1 Child, Family, and Injury Characteristics by Injury Group
mTBI (N = 119) cmTBI (N = 110) OI (N = 118) Pa
Child and family characteristics
Enrollment site Texas (versus Utah), n (%) 50 (42) 44 (40) 52 (44) .82
Prefer to complete surveys online, n (%) 82 (69) 93 (85) 90 (76) .02
Preferred language Spanish (versus English), n (%) 14 (12) 4 (4) 15 (13) .04
Age at injury, y, mean (SD) 10.3 (3.7) 10.5 (3.5) 9.7 (3.7) .16
Child sex female, n (%) 44 (37) 33 (30) 44 (37) .43
Child race, n (%) .14
American Indian or Alaskan native 2 (2) 0 (0) 0 (0)
Asian American 1 (1) 5 (5) 2 (2)
African American 11 (9) 4 (4) 6 (5)
Native Hawaiian or other Pacific Islander 1 (1) 0 (0) 0 (0)
White 90 (76) 93 (85) 95 (82)
Multiracial 13 (11) 7 (6) 13 (11)
Child ethnicity Hispanic or Latino, n (%) 31 (26) 17 (16) 33 (28) .06
Married parents, n (%) 85 (73) 90 (83) 83 (72) .11
Either caregiver currently employed, n (%) 112 (94) 105 (95) 106 (90) .21
Respondent education, n (%) .001
Less than high school 18 (15) 7 (6) 16 (14)
High school 29 (24) 16 (15) 14 (12)
Vocational and/or some college 36 (30) 59 (54) 42 (36)
Bachelor’s degree or more 36 (30) 28 (25) 46 (39)
Income at or below poverty level, n (%) 37 (34) 11 (11) 21 (19) <.001
Insurance type, n (%) .29
None 9 (8) 10 (9) 5 (4)
Medicaid and/or CHIP 43 (36) 31 (28) 33 (28)
Commercial, private, and/or military 67 (56) 68 (62) 80 (68)
Previous concussion with ED or doctor visit, n (%) 10 (8) 8 (7) 5 (4) .41
Developmental, learning, or behavioral problem, n (%) 17 (14) 13 (12) 9 (8) .26
CBCL affective t score, mean (SD) 55.3 (7.5) 54.4 (6.6) 54.2 (6.0) .38
CBCL anxiety t score, mean (SD) 53.5 (6.2) 53.8 (6.6) 53.7 (5.4) .95
CBCL ADHD t score, mean (SD) 55.0 (7.2) 53.5 (5.7) 53.8 (6.0) .16
FAD general functioning scale, mean (SD) 1.5 (0.5) 1.5 (0.4) 1.5 (0.5) .66
Social Capital Index, mean (SD) 3.5 (1.1) 3.6 (1.0) 3.7 (1.0) .44
Injury characteristics
Injury mechanism, n (%) <.001
Pedestrian or bicycle 21 (18) 15 (14) 4 (3)
Motorized vehicle 30 (25) 24 (22) 11 (9)
Fall 44 (37) 54 (49) 83 (70)
Struck by or against 12 (10) 10 (9) 6 (5)
Organized sport 10 (8) 4 (4) 12 (10)
Other 2 (2) 3 (3) 2 (2)
Loss of consciousness (yes), n (%) 45 (38) 49 (45) 0 (0) <.001
ED GCS (lowest postresuscitation), median (Q1, Q3) 15 (15, 15) 15 (14, 15) — .09
Maximum AIS excluding head, median (Q1, Q3) 1 (0, 2) 1 (0, 1) 2 (2, 2) <.001
ISS score, median (Q1, Q3) 5 (1, 10) 10 (9, 16) 4 (4, 5) <.001
Head imaging in ED (CT), n (%) 104 (87) 110 (100) — <.001
Injuries seen on brain imaging, n (%)
Skull fracture 27 (23) 74 (67) — <.001
Cortical contusion 0 (0) 32 (29) — —
Hemorrhage 0 (0) 97 (88) — —
Admission type, n (%) <.001
ED and/or observation only 53 (45) 5 (5) 78 (66)
Hospital but not PICU 50 (42) 51 (46) 39 (33)
PICU 16 (13) 54 (49) 1 (1)
Hospital LOS, d, median (Q1, Q3) 2 (1, 4) 2 (2, 3) 2 (1, 3) .80
AIS, Abbreviated Injury Scale; CHIP, Children’s Health Insurance Program; ISS, Injury Severity Score; Q1, first quartile; Q3, third quartile; —, not applicable.
aP values reflect tests of association with injury group, specifically the χ2 test for categorical variables, analysis of variance for continuous variables summarized by using the mean, and
Injury mechanism differed, with the youngest age group sustaining the mildest injuries, primarily from falls. Loss of consciousness was reported in 11% of younger and 33% to 41% of older children.
Outcomes
Injury Group and Time Since Injury
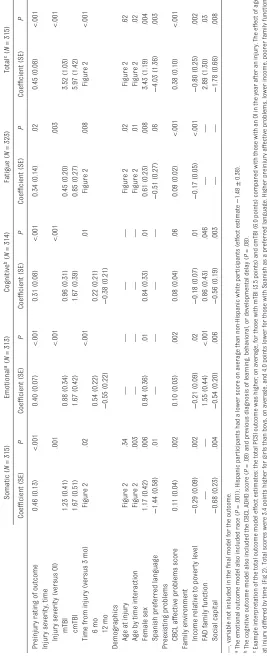
Before injury, 18% of children had symptoms that were consistent with ICD-10 concussion diagnostic criteria (Table 2). Figure 2 includes the unadjusted PCSI-P group means from preinjury through the 12-month follow-up. Children were similar at baseline except for slightly higher cognitive scores seen in children with mTBI. Children with TBI had elevated scores at all follow-up time points that did not return to baseline. Table 3 includes multivariable model results across the 3 time points that were adjusted for preinjury PCSI-P ratings. Children with cmTBI (6 points) and mTBI (3.5 points) had higher adjusted scores compared with those with OI on the total postinjury PCSI-P and all subscales; however, those with mTBI and cmTBI did not differ significantly from each other.
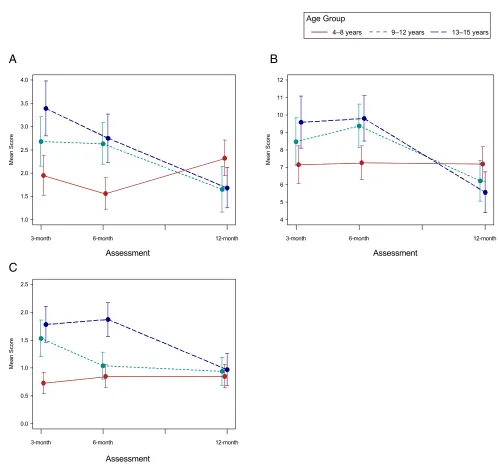
Time from injury was important. Emotional and cognitive symptoms increased from 3 to 6 months but then fell at 12 months. Total, somatic, and fatigue symptoms resolved differently over time depending on age; 4- to 8-year-olds had lower scores at 3 months than older children, which either did not change or increased across follow-up (Fig 3). Older children had higher total and somatic scores than the 4- to 8-year-old group at 3 months, but their symptoms decreased over time. Adolescents had the highest fatigue symptoms, which had decreased by 1 year after injury.
Demographic, Child, and Family Predictors of PCSs
Girls had higher unadjusted postinjury symptoms than boys in all areas of the PCSI-P despite similar preinjury PCSs (Fig 4). In the adjusted analysis, total scores remained 3.4 points higher for girls than for boys across the follow-up. Preexisting affective problems, as measured by using the CBCL, were associated with elevated PCSs. Preinjury CBCL affective, anxiety, and ADHD scores were significantly associated with postinjury PCSs
in univariable analyses. Only the affective score remained significant in multivariable analyses.
Family characteristics, including lower income, were associated with higher symptom burden; poorer family functioning predicted greater emotional and cognitive symptoms. Hispanic ethnicity was protective for emotional symptoms; Spanish language preference was protective for both total and somatic symptoms. Higher social capital was associated with lower symptom burden.
PCSs 12 Months After Injury
Despite significant improvement in PCSI-P scores over time, the PCSI-P global outcome question revealed that 21%, 39%, and 46% of the OI, mTBI, and cmTBI groups, respectively, continued to act differently 1 year after injury (Table 2). Most changes were mild to moderate; however, 3%, 8%, and 10% of the groups, respectively, showed significant to major differences.
Chronic postinjury concussion symptoms, defined as ≥1 symptom increasing in at least 3 areas relative to preinjury at 12 months postinjury, were identified in 18%, 25%, and
TABLE 2 Unadjusted PCSI-P Outcomes and ICD-10 Concussion Criteria
Injury Group PCSI Cluster and Total Scores PCSI Global
Outcome
ICD-10
Somatic Emotional Cognitive Fatigue Total Act Differently Concussion Criteriaa
Mean (SD) Mean (SD) Mean (SD) Mean (SD) Mean (SD) n (%) n (%)
mTBI
Preinjury 2.1 (4.6) 1.6 (3.4) 2.0 (4.6) 0.5 (1.4) 6.1 (12.1) — 26 (22)
Month 3 3.7 (6.1) 3.1 (4.6) 2.9 (4.8) 1.6 (3.1) 11.3 (15.7) 54 (48) 35 (31)
Month 6 3.4 (5.6) 3.6 (4.6) 3.1 (5.2) 1.5 (2.9) 11.5 (16.0) 44 (40) 41 (37)
Month 12 3.2 (5.7) 2.5 (4.4) 2.5 (4.6) 1.0 (2.3) 9.3 (13.8) 40 (39) 25 (25)
cmTBI
Preinjury 1.4 (3.5) 1.4 (3.0) 1.0 (2.9) 0.7 (2.2) 4.4 (9.8) — 17 (15)
Month 3 4.0 (6.7) 3.4 (5.4) 2.7 (5.2) 1.8 (3.2) 12.0 (18.2) 67 (64) 38 (37)
Month 6 2.9 (4.7) 4.0 (5.0) 2.8 (4.5) 1.6 (2.8) 11.3 (15.2) 48 (47) 38 (37)
Month 12 2.5 (5.0) 2.9 (4.5) 2.3 (4.1) 1.3 (3.1) 9.0 (14.7) 45 (46) 30 (31)
OI
Preinjury 1.8 (3.8) 1.3 (2.8) 1.1 (3.4) 0.5 (1.7) 4.7 (9.8) — 20 (17)
Month 3 1.4 (3.5) 1.9 (3.1) 0.9 (2.1) 0.7 (1.8) 4.9 (8.2) 38 (36) 17 (16)
Month 6 1.6 (3.5) 2.0 (3.1) 1.4 (2.9) 0.7 (1.8) 5.7 (9.2) 21 (19) 23 (21)
Month 12 1.3 (3.0) 1.3 (2.9) 0.8 (2.2) 0.6 (1.4) 4.0 (7.4) 23 (21) 19 (18)
—, not applicable.
FIGURE 2
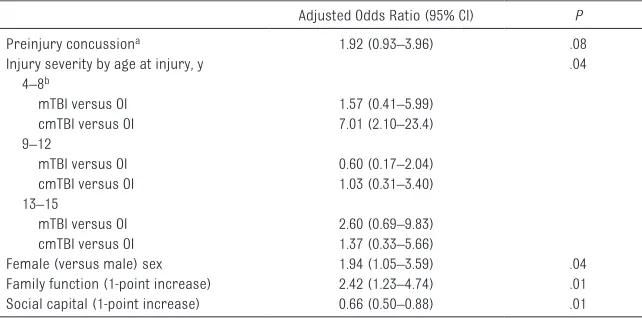
31% of children with OI, mTBI, and cmTBI, respectively (Table 2). In a multivariable model adjusted for preinjury PCSs, the odds of chronic PCSs were higher for girls and children with poorer family function and lower social capital. The odds of chronic PCSs were increased in 4- to 8-year-olds with cmTBI relative to both those with mTBI and OI but not for older children with mTBI or cmTBI relative to those with OI (Table 4).
DISCUSSION
In the current study, we examined injury characteristics as well as demographic, preinjury, and family predictors of persistent PCSs during the first year after TBI in a broadly generalizable cohort of children. Key findings include the striking persistence of PCSs, particularly in girls; the differences in PCS trajectories by age; and the strong association of preinjury PCS and psychological heath symptoms with persistent PCSs. Different characteristics of the family environment influenced PCSs and served as either protective or vulnerability factors. One year after injury, parents rated >40% of children with TBI as acting differently than before the injury, and 25% to 31% had postinjury symptoms meeting concussion diagnostic criteria. Our results converge with findings in other longitudinal studies in which researchers recruited children from EDs and reported
∼20% to 30% of children with new or reemerging symptoms persisting at 3 or 12 months after injury.2, 3, 6
The high rate of chronic concussion symptoms is of concern because of the strong relation between persisting PCSs and reduced health-related quality of life.10–12, 26 PCSs
vary over time; physical effects occur immediately after injury, cognitive symptoms occur throughout, and emotional symptoms develop later.27
TABLE 3
Multivariable Model Results for PCSI-P Outcomes
Somatic (
N
= 315)
Emotional
a (
N
= 313)
Cognitive
b (
N = 314) Fatigue ( N = 323) Total
c (N
= 315) Coefficient (SE) P Coefficient (SE) P Coefficient (SE) P Coefficient (SE) P Coefficient (SE) P
Preinjury rating of outcome
0.46 (0.13) <.001 0.40 (0.07) <.001 0.31 (0.08) <.001 0.34 (0.14) .02 0.45 (0.08) <.001
Injury severity, time Injury severity (versus OI)
.001 <.001 <.001 .003 <.001 mTBI 1.23 (0.41) 0.88 (0.34) 0.96 (0.31) 0.45 (0.20) 3.52 (1.03) cmTBI 1.67 (0.51) 1.67 (0.42) 1.67 (0.39) 0.85 (0.27) 5.97 (1.42)
Time from injury (versus 3 mo)
Figure 2 .02 <.001 .01 Figure 2 .008 Figure 2 <.001 6 mo 0.54 (0.22) 0.22 (0.21) 12 mo − 0.55 (0.22) − 0.38 (0.21)
Demographics Age at injury
Figure 2 .34 — — — — Figure 2 .02 Figure 2 .62
Age by time interaction
Figure 2 .003 — — — — Figure 2 .01 Figure 2 .02 Female sex 1.17 (0.42) .006 0.94 (0.36) .01 0.84 (0.33) .01 0.61 (0.23) .008 3.43 (1.19) .004
Spanish preferred language
− 1.44 (0.58) .01 — — — — − 0.51 (0.27) .06 − 4.03 (1.36) .003
Preexisting problems CBCL affective problems score
0.11 (0.04) .002 0.10 (0.03) .002 0.08 (0.04) .06 0.09 (0.02) <.001 0.38 (0.10) <.001
Family environment Income relative to pover
ty level − 0.29 (0.09) .002 − 0.21 (0.09) .02 − 0.18 (0.07) .01 − 0.17 (0.05) <.001 − 0.80 (0.25) .002
FAD family function
— — 1.55 (0.44) <.001 0.86 (0.43) .046 — — 2.89 (1.30) .03 Social capital − 0.68 (0.23) .004 − 0.54 (0.20) .006 − 0.56 (0.19) .003 — — − 1.78 (0.66) .008 —
, variable not included in the final model for the outcome.
a The emotional outcome model also included race (
P
= .001); Hispanic par
ticipants had a lower score on average than non-Hispanic white par
ticipants (effect estimate
−
1.48
±
0.38).
b The cognitive outcome model also included the CBCL ADHD score (
P
= .09) and previous diagnosis of learning, behavioral, or developmental delay (
P
= .08).
c Example interpretation of the total outcome model effect estimates: the total PCSI outcome was higher
, on average, for those with mTBI (3.5 points) and cmTBI (6.0 points) compared with those with an OI in the year after an injur
y. The effect of age
at injury differed by time
(Fig 2). Total scores were 3.4 points higher for girls than boys, on average, and 4.0 points lower for those with Spanish as a p
referred language. Higher preinjury affective problems, lower income, poorer family function,
Persisting cognitive and emotional PCSs likely contribute to reduced school functioning10 and changes
in psychological health.28 Little is
known about how psychological characteristics, such as negative attributions, or physiologic changes in stress response and neural systems contribute to PCSs.29–32
Recently, structural imaging revealed associations of brain network
abnormalities in children with persistent PCSs after mTBI that improved with aerobic training.29
This reveals both neural changes after injury and their potential response to interventions. The nonspecific nature of PCSs is underscored by the substantial rates of PCSs in children with no brain injury. Before injury, 18% of our sample met ICD-10 criteria for
a concussion diagnosis; 1 year after injury, 18% of those in the OI group had postinjury-onset PCSs. Yeates et al6 also found that children with
mTBI and OI had a comparable rate of PCSs of moderate severity across the first year after injury. It is becoming increasingly clear that there is a general effect of injury on PCSs as well as on neurocognitive outcomes in children with mTBI
FIGURE 3
FIGURE 4
and OI.33 The development of
next-generation PCS measures will help better discriminate symptom profiles in children with brain versus bodily injuries.29–32, 34
Girls were almost twice as likely as boys to have persistent PCSs. Despite similar preinjury PCSs and psychological health symptoms, girls developed more elevated postinjury PCSs than boys in all areas that did not resolve. Elevated PCSs have been reported in girls recruited from both ED and sport samples.3, 9, 12, 13, 35, 36
However, the basis for sex differences and their relation with age at injury is unknown. In sport-related concussion samples, girls report more symptoms before and after a concussive event and have a slower recovery trajectory than do boys.35 These samples contain
predominantly postpubertal girls, which has raised the possibility that altered hypothalamic-pituitary-gonadal axis or other physiologic sex-linked differences may contribute to female vulnerability to PCSs.35, 37
Although this mechanism may help in explaining symptom burden in pubertal and postpubertal girls, girls in our sample had elevated PCSs irrespective of age. PCSs are
also related to psychological health problems that may occur more frequently in girls than in boys, including anxiety and posttraumatic stress symptoms.38, 39
Adolescents and young children had different PCS patterns across the first year after injury. Similar to previous studies, adolescence was a susceptibility factor for total PCSs3, 12, 14, 40, 41 and somatic and
fatigue problems. This symptom elevation may be due to higher injury severity because more adolescents had a loss of consciousness and higher-velocity injuries. Although adolescents had more PCSs, their symptoms tended to improve over time. Children in the 4- to 8-year-old group tended to have a lower symptom burden at 3 months, but their symptoms did not improve over time. The odds of chronic PCSs were >4 times higher in children 4 to 8 years old with cmTBI than in those with mTBI and were 7 times higher than in the OI group.
Assessment of functioning before injury is necessary to dissociate postinjury from preexisting symptoms.2, 9, 12 Preinjury PCS
predicted persistent postinjury PCSs across time points. Similarly,
preinjury CBCL affective problem scores predicted elevated postinjury somatic, emotional, and fatigue PCSI scores. The preinjury PCSI-P total score was strongly related to each CBCL score, indicating that these measures share variance related to preinjury adjustment. Although the affective problems score had the most consistent relation with PCSs, a variety of preinjury psychological health issues may influence persistent PCSs.
Family factors exerted independent effects on PCSs, with low income and less adaptive family functioning being associated with greater PCS burden. Hispanic ethnicity and/or preference for Spanish language usage were protective factors for emotional, somatic, and total symptoms. Hispanic ethnicity has been associated with health disparities42
and lower receipt of outpatient psychological health services after pediatric TBI.43, 44 However, Hispanic
families may have cultural features, such as extended family support, that promote resilience.45 Greater social
capital was associated with lower rates of somatic, emotional, and cognitive PCSs. Families with greater social networks and connection to community resources may better access to support services, buffer health inequalities, and reduce the risk of adverse outcomes after injury. We identified several vulnerability factors for prolonged PCSs that may put children at risk for decreased school participation. Consistent with American Academy of Pediatrics guidelines, children with PCSs should be served under return to learning initiatives in which the collaboration of medical, family, and school teams is emphasized.46 The goal is
to target symptoms and institute accommodations to return the children to full participation in school and community activities without significant symptom exacerbation.47
Academic accommodations range from informal academic adjustments
TABLE 4 Logistic Regression Results for Chronic Postinjury Concussion Symptoms at 12 Months After Injury (N = 300)
Adjusted Odds Ratio (95% CI) P
Preinjury concussiona 1.92 (0.93–3.96) .08
Injury severity by age at injury, y .04
4–8b
mTBI versus OI 1.57 (0.41–5.99)
cmTBI versus OI 7.01 (2.10–23.4)
9–12
mTBI versus OI 0.60 (0.17–2.04)
cmTBI versus OI 1.03 (0.31–3.40)
13–15
mTBI versus OI 2.60 (0.69–9.83)
cmTBI versus OI 1.37 (0.33–5.66)
Female (versus male) sex 1.94 (1.05–3.59) .04
Family function (1-point increase) 2.42 (1.23–4.74) .01
Social capital (1-point increase) 0.66 (0.50–0.88) .01
One or more symptoms increased relative to preinjury at the 12-mo follow-up in at least 3 of the following areas: cognitive, emotional, somatic, and sleep and/or fatigue. CI, confidence interval.
a One or more symptoms at preinjury in at least 3 of the following areas: cognitive, emotional, somatic, and sleep and/
or fatigue.
b In children 4 to 8 y old, having a cmTBI was associated with increased odds of chronic concussion relative to mTBI (odds
to services mandated under federal statutes, such as Section 504. Although evidence-based information regarding interventions is lacking, physical and psychological health interventions ranging from graduated exercise to medication management of headache and mood, cognitive behavioral therapy, and family services that are effective in other populations are likely candidates.48, 49
LIMITATIONS AND STRENGTHS
Limitations of this study include that data were collected via parent report, which may be subject to bias50, 51 and
possible under- or overestimation of PCSs relative to self-report. We did not assess PCSs in the initial weeks after injury and may have lost information regarding characteristics of children who recovered quickly. We did not measure pubertal development or litigation status. Our sample was recruited from the ED, and it may not be generalizable to the larger group of children with mTBI who seek community treatment.52
Although 18% did not complete all
time points, multivariable model results for PCSI-P total scores were similar when they were rerun, including only the cases with complete data.
Our multicenter study had several notable strengths, including a prospective, longitudinal cohort design with broad racial and ethnic representation and an injury
comparison group. Careful evaluation of preinjury psychological and physical heath by using validated measures allowed for the dissociation of new postinjury symptoms from preexisting symptoms as well as the identification of the subgroups that were at elevated risk for chronic PCSs.
CONCLUSIONS
Clinical management of children with mTBI, as well as children with bodily injuries, may be enhanced by understanding which children are at risk for persistent PCSs. Because emotional and cognitive symptoms may emerge over time, children with symptoms persisting at 1 month after injury should be managed clinically to monitor symptom course and refer
for any needed physical, cognitive, or psychological health interventions. The consistent importance of family functioning and social capital on PCS resolution reveals that family support services should be considered as an adjunctive intervention.
REFERENCES
1. Belanger HG, Vanderploeg RD. The neuropsychological impact of sports-related concussion: a meta-analysis. J Int Neuropsychol Soc. 2005;11(4):345–357 2. Barlow KM, Crawford S, Brooks
BL, Turley B, Mikrogianakis A. The incidence of postconcussion syndrome remains stable following mild traumatic brain injury in children.
Pediatr Neurol. 2015;53(6):491–497
3. Babcock L, Byczkowski T, Wade SL, Ho M, Mookerjee S, Bazarian JJ. Predicting postconcussion syndrome after mild traumatic brain injury in children and adolescents who present to the emergency department. JAMA Pediatr. 2013;167(2):156–161
4. Grubenhoff JA, Currie D, Comstock RD, Juarez-Colunga E, Bajaj L, Kirkwood
MW. Psychological factors associated with delayed symptom resolution in children with concussion. J Pediatr. 2016;174:27–32.e1
5. Zemek RL, Farion KJ, Sampson M, McGahern C. Prognosticators of persistent symptoms following pediatric concussion: a systematic review. JAMA Pediatr. 2013;167(3):259–265
PEDIATRICS (ISSN Numbers: Print, 0031-4005; Online, 1098-4275). Copyright © 2018 by the American Academy of Pediatrics
FINANCIAL DISCLOSURE: The authors have indicated they have no financial relationships relevant to this article to disclose.
FUNDING: Supported by the Centers for Disease Control and Prevention (Cooperative Agreement U01/CE002188). Contents are solely the responsibility of the authors and do not necessarily represent the official views of the Centers for Disease Control and Prevention. Dr Keenan was also supported by the National Institutes of Health Eunice Kennedy Shriver National Institute of Child Health and Human Development (K24HD072984). Neither the Eunice Kennedy Shriver
National Institute of Child Health and Human Development nor the Centers for Disease Control and Prevention played a role in the design or conduct of the study; collection, management, analysis, and interpretation of the data; preparation, review, or approval of the article; or decision to submit the article for publication. Funded by the National Institutes of Health (NIH).
POTENTIAL CONFLICT OF INTEREST: The authors have indicated they have no potential conflicts of interest to disclose.
ABBREVIATIONS
ADHD: attention-deficit/hyperac-tivity disorder
CBCL: Child Behavior Checklist cmTBI: complicated mild
traumatic brain injury CT: computed tomography ED: emergency department FAD: McMaster Family
Assessment Device GCS: Glasgow Coma Scale ICD-10: International
Classification of Diseases, 10th Revision
mTBI: mild traumatic brain injury
OI: orthopedic injury
PCS: postconcussion symptom PCSI-P: Postconcussion Symptom
6. Yeates KO, Taylor HG, Rusin J, et al. Longitudinal trajectories of
postconcussive symptoms in children with mild traumatic brain injuries and their relationship to acute clinical status. Pediatrics. 2009;123(3):735–743 7. Ponsford J, Willmott C, Rothwell A,
et al. Cognitive and behavioral outcome following mild traumatic head injury in children. J Head Trauma Rehabil. 1999;14(4):360–372
8. Mittenberg W, Wittner MS, Miller LJ. Postconcussion syndrome occurs in children. Neuropsychology. 1997;11(3):447–452
9. Iverson GL, Silverberg ND, Mannix R, et al. Factors associated with concussion-like symptom reporting in high school athletes. JAMA Pediatr. 2015;169(12):1132–1140
10. Novak Z, Aglipay M, Barrowman N, et al; Pediatric Emergency Research Canada Predicting Persistent Postconcussive Problems in Pediatrics (PERC 5P) Concussion Team. Association of persistent postconcussion symptoms with pediatric quality of life. JAMA Pediatr. 2016;170(12):e162900 11. Moran LM, Taylor HG, Rusin J, et al.
Quality of life in pediatric mild traumatic brain injury and its relationship to postconcussive symptoms. J Pediatr Psychol. 2012;37(7):736–744
12. McNally KA, Bangert B, Dietrich A, et al. Injury versus noninjury factors as predictors of postconcussive symptoms following mild traumatic brain injury in children.
Neuropsychology. 2013;27(1):1–12 13. Iverson GL, Gardner AJ, Terry DP, et al.
Predictors of clinical recovery from concussion: a systematic review.
Br J Sports Med. 2017;51(12):941–948 14. Bernard CO, Ponsford JA, McKinlay A, McKenzie D, Krieser D. Predictors of post-concussive symptoms in young children: injury versus non-injury related factors. J Int Neuropsychol Soc. 2016;22(8):793–803
15. Hung R, Carroll LJ, Cancelliere C, et al. Systematic review of the clinical course, natural history, and prognosis for pediatric mild traumatic brain injury: results of the International Collaboration on Mild Traumatic Brain
Injury Prognosis. Arch Phys Med Rehabil. 2014;95(suppl 3):S174–S191 16. Bryan MA, Rowhani-Rahbar A,
Comstock RD, Rivara F; Seattle Sports Concussion Research Collaborative. Sports- and recreation-related concussions in US youth. Pediatrics. 2016;138(1):e20154635
17. Teasdale G, Jennett B. Assessment of coma and impaired consciousness. A practical scale. Lancet.
1974;2(7872):81–84
18. Carroll LJ, Cassidy JD, Peloso PM; WHO Collaborating Centre Task Force on Mild Traumatic Brain Injury, et al. Prognosis for mild traumatic brain injury: results of the WHO collaborating centre task force on mild traumatic brain injury. J Rehabil Med. 2004;(suppl 43):84–105
19. National Center for Injury Prevention and Control. Report to Congress on Mild Traumatic Brain Injury in the US: Steps to Prevent a Serious Public Health Problem. Atlanta, GA: Centers for Disease Control and Prevention; 2003
20. Levin HS, Hanten G, Roberson G, et al. Prediction of cognitive sequelae based on abnormal computed tomography findings in children following mild traumatic brain injury. J Neurosurg Pediatr. 2008;1(6):461–470
21. Gennarelli T A, Wodzin E. Abbreviated Injury Scale 2005. Barrington, IL: Association for the Advancement of Automotive Medicine; 2005 22. Achenbach T. Manual for the Child
Behavior Checklist/4-18 and 1991 Profile. Burlington, VT: University of Vermont College of Medicine; 1991 23. Sady MD, Vaughan CG, Gioia GA.
Psychometric characteristics of the postconcussion symptom inventory in children and adolescents. Arch Clin Neuropsychol. 2014;29(4):348–363 24. Miller IW, Bishop DS, Epstein NB,
Keitner GI. The McMaster Family Assessment Device: reliability and validity. J Marital Fam Ther. 1985;11(4):345–356
25. Runyan DK, Hunter WM, Socolar RR, et al. Children who prosper in unfavorable environments: the relationship to social capital.
Pediatrics. 1998;101(1, pt 1):12–18
26. Zonfrillo MR, Durbin DR, Koepsell TD, et al. Prevalence of and risk factors for poor functioning after isolated mild traumatic brain injury in children.
J Neurotrauma. 2014;31(8):722–727 27. Eisenberg MA, Meehan WP III, Mannix
R. Duration and course of post-concussive symptoms. Pediatrics. 2014;133(6):999–1006
28. Max JE, Friedman K, Wilde EA, et al. Psychiatric disorders in children and adolescents 24 months after mild traumatic brain injury. J Neuropsychiatry Clin Neurosci. 2015;27(2):112–120
29. Yuan W, Wade SL, Quatman-Yates C, Hugentobler JA, Gubanich PJ, Kurowski BG. Structural connectivity related to persistent symptoms after mild TBI in adolescents and response to aerobic training: preliminary investigation. J Head Trauma Rehabil. 2017;32(6):378–384
30. McCarthy MT, Kosofsky BE. Clinical features and biomarkers of concussion and mild traumatic brain injury in pediatric patients. Ann N Y Acad Sci. 2015;1345:89–98
31. Kamins J, Bigler E, Covassin T, et al. What is the physiological time to recovery after concussion? A systematic review. Br J Sports Med. 2017;51(12):935–940
32. Ewing-Cobbs L, Prasad MR, Cox CS Jr, Granger DA, Duque G, Swank PR. Altered stress system reactivity after pediatric injury: relation with post-traumatic stress symptoms.
Psychoneuroendocrinology. 2017;84:66–75
33. Babikian T, Satz P, Zaucha K, Light R, Lewis RS, Asarnow RF. The UCLA longitudinal study of neurocognitive outcomes following mild pediatric traumatic brain injury. J Int
Neuropsychol Soc. 2011;17(5):886–895 34. Laborey M, Masson F, Ribé
reau-Gayon R, Zongo D, Salmi LR, Lagarde E. Specificity of postconcussion symptoms at 3 months after mild traumatic brain injury: results from a comparative cohort study. J Head Trauma Rehabil. 2014;29(1):E28–E36 35. Covassin T, Savage JL, Bretzin AC,
outcomes [published online ahead of print September 18, 2017].
Int J Psychophysiol.10.1016/j. ijpsycho.2017.09.010
36. Rabinowitz AR, Li X, McCauley SR, et al. Prevalence and predictors of poor recovery from mild traumatic brain injury. J Neurotrauma. 2015;32(19):1488–1496
37. Snook ML, Henry LC, Sanfilippo JS, Zeleznik AJ, Kontos AP. Association of concussion with abnormal menstrual patterns in adolescent and young women. JAMA Pediatr. 2017;171(9):879–886
38. Albanese BJ, Boffa JW, Macatee RJ, Schmidt NB. Anxiety sensitivity mediates gender differences in post-concussive symptoms in a clinical sample. Psychiatry Res. 2017;252:242–246
39. Truss K, Godfrey C, Takagi M, et al. Trajectories and risk factors for post-traumatic stress symptoms following pediatric concussion. J Neurotrauma. 2017;34(14):2272–2279
40. Barlow KM, Crawford S, Stevenson A, Sandhu SS, Belanger F, Dewey D. Epidemiology of postconcussion syndrome in pediatric mild traumatic brain injury. Pediatrics. 2010;126(2). Available at: www. pediatrics. org/ cgi/ content/ full/ 126/ 2/ e374
41. Zemek R, Barrowman N, Freedman SB; Pediatric Emergency Research Canada (PERC) Concussion Team, et al. Clinical risk score for persistent postconcussion symptoms among
children with acute concussion in the ED. JAMA. 2016;315(10):1014–1025 42. Jimenez N, Ebel BE, Wang J, et
al. Disparities in disability after traumatic brain injury among Hispanic children and adolescents. Pediatrics. 2013;131(6). Available at: www. pediatrics. org/ cgi/ content/ full/ 131/ 6/ e1850
43. Moore M, Jimenez N, Graves JM, et al. Racial disparities in outpatient mental health service use among children hospitalized for traumatic brain injury. J Head Trauma Rehabil. 2018;33(3):177–184
44. Jimenez N, Quistberg A, Vavilala MS, Jaffe KM, Rivara FP. Utilization of mental health services after mild pediatric traumatic brain injury.
Pediatrics. 2017;139(3):e20162462 45. Gallo LC, Penedo FJ, Espinosa de los
Monteros K, Arguelles W. Resiliency in the face of disadvantage: do Hispanic cultural characteristics protect health outcomes? J Pers. 2009;77(6):1707–1746
46. Halstead ME, McAvoy K, Devore CD, Carl R, Lee M, Logan K; Council on Sports Medicine and Fitness; Council on School Health. Returning to learning following a concussion. Pediatrics. 2013;132(5):948–957
47. Lumba-Brown A, Yeates KO, Sarmiento K, et al. Centers for Disease Control and Prevention guideline on the diagnosis and management of mild traumatic brain injury in children [published
online ahead of print September 4, 2018]. JAMA Pediatr.10.1001/ jamapediatrics.2018.2853
48. Graham R, Rivara FP, Ford MA, Spicer CM, eds. Sports-Related Concussions in Youth: Improving the Science, Changing the Culture. Washington, DC: Institute of Medicine and National Research Council of the National Academies; 2013
49. McCarty CA, Zatzick D, Stein E, Wang J, Hilt R, Rivara FP; Seattle Sports Concussion Research Collaborative. Collaborative care for adolescents with persistent postconcussive symptoms: a randomized trial. Pediatrics. 2016;138(4):e20160459
50. Gunstad J, Suhr JA. “Expectation as etiology” versus “the good old days”: postconcussion syndrome symptom reporting in athletes, headache sufferers, and depressed individuals. J Int Neuropsychol Soc. 2001;7(3):323–333
51. Brooks BL, Kadoura B, Turley B, Crawford S, Mikrogianakis A, Barlow KM. Perception of recovery after pediatric mild traumatic brain injury is influenced by the “good old days” bias: tangible implications for clinical practice and outcomes research. Arch Clin Neuropsychol. 2014;29(2):186–193
52. Zogg CK, Haring RS, Xu L, et al. The epidemiology of pediatric head injury treated outside of hospital emergency departments. Epidemiology.
DOI: 10.1542/peds.2018-0939 originally published online October 15, 2018;
2018;142;
Pediatrics
T. Keenan
Linda Ewing-Cobbs, Charles S. Cox Jr, Amy E. Clark, Richard Holubkov and Heather
Persistent Postconcussion Symptoms After Injury
Services
Updated Information &
http://pediatrics.aappublications.org/content/142/5/e20180939
including high resolution figures, can be found at:
References
http://pediatrics.aappublications.org/content/142/5/e20180939#BIBL
This article cites 48 articles, 11 of which you can access for free at:
Subspecialty Collections
_sub
http://www.aappublications.org/cgi/collection/traumatic_brain_injury
Traumatic Brain Injury
b
http://www.aappublications.org/cgi/collection/head_neck_injuries_su
Head and Neck Injuries
http://www.aappublications.org/cgi/collection/concussion_sub
Concussion
cal_fitness_sub
http://www.aappublications.org/cgi/collection/sports_medicine:physi
Sports Medicine/Physical Fitness following collection(s):
This article, along with others on similar topics, appears in the
Permissions & Licensing
http://www.aappublications.org/site/misc/Permissions.xhtml
in its entirety can be found online at:
Information about reproducing this article in parts (figures, tables) or
Reprints
http://www.aappublications.org/site/misc/reprints.xhtml
DOI: 10.1542/peds.2018-0939 originally published online October 15, 2018;
2018;142;
Pediatrics
T. Keenan
Linda Ewing-Cobbs, Charles S. Cox Jr, Amy E. Clark, Richard Holubkov and Heather
Persistent Postconcussion Symptoms After Injury
http://pediatrics.aappublications.org/content/142/5/e20180939
located on the World Wide Web at:
The online version of this article, along with updated information and services, is
http://pediatrics.aappublications.org/content/suppl/2018/10/11/peds.2018-0939.DCSupplemental
Data Supplement at:
by the American Academy of Pediatrics. All rights reserved. Print ISSN: 1073-0397.