P
EDIATRICS
Jul 2003VOL. 112 NO. 1
䡠䡠䡠 䡠䡠䡠 䡠䡠䡠 䡠䡠䡠 䡠䡠
Diffusion-Weighted Imaging of the Brain in Preterm Infants With Focal
and Diffuse White Matter Abnormality
Serena J. Counsell, MSc*; Joanna M. Allsop, DCR*; Michael C. Harrison, MRCP‡; David J. Larkman, PhD*; Nigel L. Kennea, MRCP‡; Olga Kapellou, MRCPCH‡; Frances M. Cowan, PhD‡; Joseph V. Hajnal, PhD*;
A. David Edwards, F Med Sci, FRCP*‡; and Mary A. Rutherford, FRCPCH, FRCR*‡
ABSTRACT. Objective. The most common finding on magnetic resonance imaging (MRI) of the brain in pre-term infants at pre-term-equivalent age is diffuse excessive high signal intensity (DEHSI) in the white matter. It is unclear whether DEHSI represents a biological abnor-mality. This study used diffusion-weighted imaging (DWI) to compare apparent diffusion coefficient (ADC) values in DEHSI with infants with normal imaging and those with overt brain damage to determine whether DEHSI shows the diffusion characteristics of normal or abnormal tissue.
Methods. MRI, using conventional and
diffusion-weighted imaging (DWI), was performed in 50 preterm infants at term-equivalent age using a 1.5 Tesla MR scan-ner. The infants were divided into 3 groups on the basis of their MRI results: 1) normal white matter, 2) DEHSI, or 3) overt white matter pathology. ADC values were mea-sured in the frontal, central, and posterior white matter at the level of the centrum semiovale. ADC values in the 3 groups of preterm infants were compared using a 1-way analysis of variance with a Bonferroni test for multiple comparisons.
Results. ADC values were significantly higher in in-fants with DEHSI and inin-fants with overt white matter pathology than in infants with normal white matter. There was no significant difference between ADC values in infants with DEHSI and those with overt white matter pathology.
Conclusions. This study provides objective evidence that DEHSI represents diffuse white matter abnormality.
Pediatrics2003;112:1–7;magnetic resonance imaging, dif-fusion weighted imaging, DEHSI, preterm, brain.
ABBREVIATIONS. PVL, periventricular leukomalacia; PHI, periventricular hemorrhagic infarction; IVH, intraventricular hemorrhage; MRI, magnetic resonance imaging; DEHSI, diffuse excessive high signal intensity; DWI, diffusion-weighted imaging; ADC, apparent diffusion coefficient; GA, gestational age; PMA, postmenstrual age; CSE, conventional spin echo; FSE, fast spin echo; ROI, region of interest; DTI, diffusion tensor imaging.
I
mprovements in neonatal intensive care have re-sulted in a decline in the incidence of periven-tricular leukomalacia (PVL), perivenperiven-tricular hem-orrhagic infarction (PHI), and major intraventricular hemorrhage (IVH).1,2However, magnetic resonanceimaging (MRI) has demonstrated diffuse excessive high signal intensity (DEHSI) in the cerebral white matter on T2-weighted imaging in 75% of preterm infants at term-equivalent age.3 In the absence of
postmortem correlation, it has been unclear whether DEHSI is an imaging correlate of diffuse white mat-ter disease. The assessment of DEHSI by visual anal-ysis is difficult, as the appearances are influenced by the windowing used before image processing. There-fore, an objective method of assessing the cerebral white matter in preterm infants is required to deter-mine whether DEHSI reflects a true white matter abnormality.
Diffusion-weighted imaging (DWI) is a MR tech-nique that demonstrates the molecular motion of water in tissue,4 and previous studies have shown
that DWI is able to reveal abnormalities in the cere-bral white matter of the preterm brain that are not demonstrated on conventional MRI.5–7Apparent
dif-fusion coefficient (ADC) values (quantitative mea-sures of water motion) can be calculated from DWI and may be useful to assess objectively the cerebral white matter in DEHSI. The aim of this study was to
From the *Robert Steiner Magnetic Resonance Unit, Imaging Sciences De-partment, MRC Clinical Sciences Centre; and ‡Department of Paediatrics, Faculty of Medicine, Imperial College, Hammersmith Campus, London, United Kingdom.
Received for publication Sep 11, 2002; accepted Dec 20, 2002.
Reprint requests to (M.A.R.) Robert Steiner MR Unit, Imaging Sciences Department, MRC Clinical Sciences Centre, Imperial College, Hammer-smith Campus, DuCane Rd, London W12 0HS, United Kingdom. E-mail: [email protected]
quantify ADC values in the cerebral white matter in preterm infants to determine whether DEHSI has the same diffusion characteristics as normal-appearing white matter or those of overt white matter pathol-ogy.
METHODS
Ethical permission for this study was granted by the Hammer-smith Hospital Research Ethics Committee, and informed parental consent was obtained for each infant. We studied 50 preterm infants between October 2000 and June 2002 at term-equivalent age. The infants were either referred for MRI because of a preex-isting abnormality on cranial ultrasound or recruited at random from the neonatal intensive care unit as part of an ongoing MRI project to examine brain development in preterm infants. They represented 14% of the eligible population. The median (range) gestational age (GA) of the infants at birth was 29 weeks (25–34 weeks), and the median birth weight was 1086 g (502–2120 g). The median postmenstrual age (PMA) at scanning was 41 weeks (37– 44 weeks). No infants required mechanical ventilation at the time of the MRI examination.
MRI was performed on a 1.5 Tesla Eclipse scanner (Philips Medical Systems, Cleveland, OH) using a dedicated pediatric head coil. The infants were sedated for imaging with oral chloral hydrate (20 –30 mg/kg), and pulse oximetry and electrocardio-graph were monitored throughout the procedure. Ear protection was used for each infant (Natus MiniMuffs, Natus Medical Inc, San Carlos, CA). An experienced neonatologist, trained in MRI procedures, was in attendance throughout the MRI examination. Transverse T1-weighted conventional spin echo (CSE; TR 500/TE 15 ms) and T2-weighted fast spin echo (FSE; TR 4500/TEeff210
ms) images were obtained before the DWI. Single-shot echo planar DWI was obtained using the following pulse sequence parame-ters; TR⬁, TE 100 ms, 100⫻100 matrix, FOV 24 cm, slice thickness 5 mm. A reference image was obtained with a b value of 0 (nominal value), and DWIs were obtained with abvalue of 1000 s/mm2in the read, phase, and slice directions. The total scanning
time of the DWI sequence was 37 seconds. Accuracy and repro-ducibility of the DWI sequence was assessed using a distilled water phantom at 20°C.
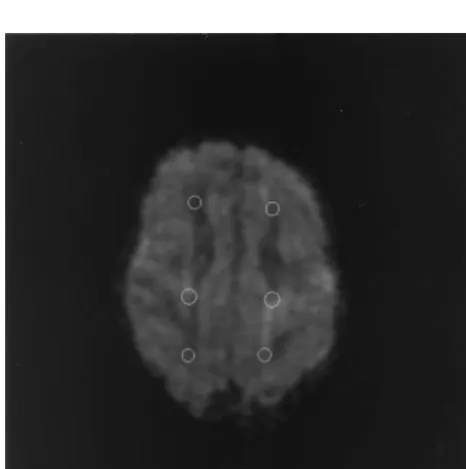
Circular regions of interest (ROIs) were positioned in the fron-tal, central, and posterior white matter bilaterally on the reference image (b⫽0) and on the phase, read, and slice DWIs at the level of the centrum semiovale (on the transverse slice above the level of the lateral ventricles, where the central sulcus was at its maximum depth; Fig 1). Care was taken to position the ROIs so as to avoid
partial volume averaging from cerebrospinal fluid or cortical gray matter. The size of the ROIs depended on the area of white matter at this level (ROI diameter: 4.2–5.4 mm). Consistency of position-ing was ensured by havposition-ing all ROIs positioned by a sposition-ingle inves-tigator. The ADC value for the ROIs in each direction of sensiti-zation was calculated as follows, and the directionally averaged ADC for each ROI was calculated:
ADC⫽ ⫺1bln S S0
where S is signal in the DW image, S0is the signal in the reference
image, andbis given by the following equation:
b⫽␥2G2␦2共⌬⫺␦/3兲
where␥is gyromagnetic ratio for protons, G is amplitude of the pulsed gradient,␦is duration of the pulsed gradient, and⌬is time interval between the leading edges of the 2 pulsed gradients.
For infants with overt white matter pathology, the ROIs were positioned as consistently as possible but avoiding regions of obvious focal pathology.
The conventional MR images were reviewed separately by 2 investigators who were unaware of the DWI results (M.A.R. and J.M.A.), and the infants were divided into 3 groups on the basis of their MR images: 1) normal white matter, 2) DEHSI, or 3) overt white matter lesions. Interobserver and intraobserver variability for the assessment of DEHSI were analyzed by calculating the statistic, and the following ranges for agreement were used: 0.00, poor; 0.00 to 0.20, slight; 0.21 to 0.40, fair; 0.41 to 0.6, moderate; 0.61 to 0.8, substantial; and 0.81 to 1.0, almost perfect.8 ADC
analysis was performed by another investigator (S.J.C.) who was unaware of the MRI findings.
The data were tested for normality using a Shapiro Wilks test and found to be compatible with a normal distribution. Statistical analysis of the ADC values between groups and regional variation within groups was performed using a 1-way analysis of variance with a Bonferroni test for multiple comparisons. In addition, linear regression analysis was performed to examine the relationship between PMA at scanning and ADC values for each group. Re-peated measures reliability testing was evaluated by calculating coefficients of reliability for each ROI (公[2⫻standard deviation of the differences between the 2 measurements2]).9
RESULTS Phantom Studies
The mean ADC value of the distilled water was 2.01 ⫾ 0.05⫻ 10⫺3mm2/s, which is comparable to
published values,10 –12and the reproducibility of the
DWI sequence was⬍2.5%.
MRI
There were no complications during or immedi-ately after the MRI studies. Thirteen infants had nor-mal white matter (Fig 2), 23 had DEHSI (Fig 3), and 11 had overt white matter lesions. There was no significant difference in the GA at birth (P ⫽ .61), birth weight (P⫽.41), or PMA at scanning (P⫽.50) of the infants in the 3 groups. Table 1 summarizes the characteristics of the infants in the 3 groups. Of the infants with normal white matter, 1 had evidence of previous IVH, 1 had unilateral minimal ventricular dilation, and 1 had bilateral minimal ventricular di-lation (Fig 4), but none had any parenchymal abnor-mality. Of the infants with DEHSI, 2 had evidence of previous unilateral germinal layer hemorrhage, 2 had evidence of previous bilateral germinal layer hemorrhage, and 2 had bilateral minimal ventricular dilation. None of the infants in this group had focal parenchymal lesions.
The overt white matter lesions included bilateral periventricular leukomalacia (n⫽5; Fig 5), a unilat-Fig 1. Positioning of ROIs in the white matter at the level of the
eral cystic lesion in the white matter lateral to the right lentiform nucleus, consistent with an area of infarction (n ⫽ 1), unilateral PHI (n ⫽2), and bilat-eral multiple punctate lesions (n ⫽ 3; Fig 6). Two infants with PVL, all 3 of the infants with multiple punctate lesions, both infants with PHI, and the in-fant with the cystic lesion in the white matter lateral to the right lentiform nucleus also had areas of long T2 within the “unaffected” white matter. The 3 re-maining infants with PVL demonstrated white mat-ter atrophy and bilamat-teral ventricular dilation.
Al-though visual analysis of DEHSI is subjective, the statistic for interobserver and intraobserver variabil-ity of differentiation between normal white matter and DEHSI was high (⫽0.68 and⫽0.72, respec-tively), representing substantial agreement.8
ADC Values
Unpairedttests showed no significant difference between the right and left hemispheres (P⬎.05), so the mean was calculated from the bilateral measure-ments to give ADC values for each region. The mean ADC values obtained in the frontal, central, and posterior white matter are shown in Table 2. ADC values were significantly higher in infants with DEHSI (frontal white matter,P⬍.0001; central white matter,P ⫽.007; posterior white matter,P⬍ .0001) and in infants with overt white matter lesions (fron-tal white matter,P⬍.0001; central white matter,P⫽
.001; posterior white matter,P⬍.0001) than in those with normal white matter. There was no significant difference between infants with DEHSI and those with overt white matter lesions (frontal white matter,
P⫽1.0; central white matter,P⫽.42; posterior white matter, P ⫽ 1.0). Figure 7 demonstrates the ADC values obtained in the posterior white matter in the 3 groups of infants.
Analysis of regional variation within each infant group showed no significant difference between ADC values in the frontal, central, and posterior white matter regions for infants with normal-appear-ing white matter (frontal vs central white matter,P⫽
1.0; central versus posterior white matter, P ⫽ 1.0; frontal vs posterior white matter,P⫽1.0) and those with overt white matter lesions (frontal vs central white matter, P ⫽ 1.0; central vs posterior white matter,P⫽1.0; frontal vs posterior white matter,P⫽
1.0). For infants with DEHSI, there was no significant difference in ADC values between the frontal and posterior white matter (P⫽1.0) or between the cen-tral and posterior white matter (P ⫽.16). However, ADC values in the frontal white matter were signif-icantly higher than in the central white matter (P⫽
.01) in this group of infants.
A significant negative correlation between PMA and ADC values was demonstrated in the frontal white matter for infants with normal-appearing white matter (P⫽ .04). However, there was no sig-nificant correlation between PMA at scanning and ADC values for central (P⫽.59) and posterior (P⫽
.81) white matter in infants with normal-appearing white matter, in infants with DEHSI (frontal white matter, P ⫽ 0. 54; central white matter, P ⫽ .20; posterior white matter,P⫽.35), or infants with overt white matter lesions (frontal white matter,P ⫽ .57; central white matter,P⫽.89; posterior white matter,
P ⫽ .71). The coefficient of reliability for the mea-surement of ADC values in each region was as fol-lows: frontal white matter, 4.4%; central white mat-ter, 4.6%; posterior white matmat-ter, 3.5%.
DISCUSSION
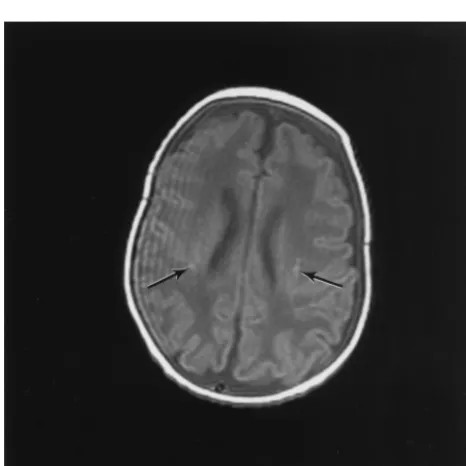
This study demonstrates that ADC values in the cerebral white matter are higher in infants with DEHSI and overt white matter pathology than in Fig 2. Transverse T2-weighted FSE image at the level of the
cen-trum semiovale of an infant at 42 weeks’ PMA, who was born at 31 weeks’ GA, demonstrating normal signal intensity in the cere-bral white matter.
infants with normal white matter on MRI and that there is no significant difference in ADC values be-tween infants with DEHSI and those with overt white matter pathology. Therefore, DEHSI has the same diffusion characteristics as the white matter of infants with overt white matter pathology. DEHSI, the phenomenon of excessive high signal intensity on T2-weighted MRI and corresponding low signal on T1-weighted imaging, is usually most marked in the periventricular white matter but often evident throughout the white matter.3 The signal intensity
associated with DEHSI exceeds the high signal inten-sity of normal unmyelinated white matter in the neonatal brain. Although visual analysis of this sig-nal is subjective, interobserver agreement was good in this study.
Using line scan diffusion tensor imaging (DTI), ADC values of 1.4⫾ 0.2⫻ 10⫺3mm2/s5and 1.5 ⫾
0.2⫻ 10⫺3mm2/s13have been found in the central
white matter of preterm infants at term, which are slightly higher than our values of 1.29⫾0.12⫻10⫺3
mm2/s in this region. Normative ADC values in
full-term infants have been reported as 1.2⫾0.10⫻ 10⫺3mm2/s using line scan DTI5and 1.43⫾0.14⫻
10⫺3 mm2/s using echo planar DTI14 in the central
white matter and in the frontal white matter, 1.62⫾ 0.16 ⫻ 10⫺3 mm2/s using echo planar DWI.10
Al-though previous studies have found a significant reduction in ADC values in normal white matter with increasing PMA fromⱕ32 weeks’ GA to term-equivalent age,5,7,11,14,15 with the exception of the
frontal region in infants with normal-appearing white matter, we found no significant decrease in ADC with increasing PMA in this study. This is likely to be attributable to the narrow range of PMAs (37– 44 weeks) studied here.
Elevations in ADC values may be caused by an increase in water content and a decrease in restric-tion to water morestric-tion. The reducrestric-tion in ADC values in the cerebral white matter with increasing PMA in the preterm brain is probably attributable to a reduction in the cerebral water content and a decreased extra-cellular space, which reduces separation of struc-tures such as cell membranes and so impedes diffu-sion of water.14As other studies have demonstrated
a reduction in ADC values in the cerebral white matter from the preterm period to term-equivalent age, it is possible that the elevated ADC values in DEHSI represent delayed white matter maturation in these infants.
A previous study that examined ADC values in the white matter at the level of the centrum semi-ovale found no regional variation between frontal, central, and posterior white matter areas.14However,
another study, which examined a greater number of white matter regions, reported varying ADC values across white matter regions in both infants with nor-mal white matter and those with white matter inju-ry.7 Although we found no regional variation in
ADC values at the level of the centrum semiovale in infants with normal-appearing white matter or those with overt white matter lesions, ADC values in the frontal region were higher than in the central white matter in DEHSI. It is possible that elevated ADC values in the frontal white matter represent an area of more severe damage or delayed maturation com-pared with the central white matter at this level. It is interesting that Miller et al7reported an absence of
the normal maturational increase in anisotropy (the directional dependence of water diffusion in tissue) in this region in infants with minimal white matter injury. These results suggest an increase in suscepti-bility to injury in the frontal white matter.
The elevation in ADC values in infants with overt pathology reported here suggests diffuse involve-ment of the white matter, beyond the visually obvi-Fig 4. T2-weighted FSE image at the level of the basal ganglia of
an infant at 40 weeks’ PMA, who was born at 30 weeks’ GA, demonstrating minimal bilateral ventricular dilation and normal-appearing white matter.
TABLE 1. Characteristics of the Infants in Each Group
Group P
Normal White Matter
DEHSI Overt White
Matter Pathology
GA (wk; median [range]) 29 (26–32) 29 (25–34) 29 (26–33) .61
Birth weight (g; median [range]) 1045 (502–2036) 1006 (732–2120) 1296 (955–1750) .41
PMA at scanning (wk; median [range]) 41 (39–44) 40 (39–43) 41 (37–42) .50
No. of days requiring assisted ventilation (median [range]) 1 (0–43) 1 (0–21) 1 (0–15) .84 No. of days requiring CPAP (median [range]) 11 (0–51) 9 (0–55) 3 (0–30) .22 No. of days requiring inotropic therapy (median [range]) 0 (0–4) 0 (0–5) 0 (0–4) .74
ous lesions. These findings concur with a recent DTI study, which reported a significant increase in ADC values with increasing PMA in the frontal white matter and visual association areas in moderate white matter injury.7 Indeed, 8 of the infants with
overt lesions in our study also demonstrated the signal characteristics of DEHSI throughout the white matter on visual analysis. In addition, elevated ADC values have been reported in a preterm infant with PVL at term-equivalent age in the cerebral white matter surrounding the cystic lesions.6The elevation
of ADC values in the white matter distant from the
focal lesions in PVL probably reflects the diffuse white matter damage that has been identified on histopathological studies.16 In PHI, positron
emis-sion tomography studies have shown that cerebral blood flow is impaired in the ipsilateral hemisphere distant from the focal lesion, suggesting that the injury extends beyond the obvious focal lesion.17
This may account for the elevated ADC in the ipsi-lateral hemisphere in PHI. ADC values were ele-vated in both hemispheres in the 2 infants with PHI in this study, suggesting bilateral and diffuse white matter involvement. Visual analysis of the images showed DEHSI in the contralateral hemisphere in PHI.
A line scan DTI study of preterm infants at term-equivalent age found that relative anisotropy was reduced in the central white matter in infants with focal white matter pathology.13However, they found
no difference in ADC values between infants with pathology and those with no evidence of pathology on MRI. The reasons for the differing results between this line scan study and our work cannot be ex-plained by the different techniques used. However, it is possible that the line scan DTI study13 included
infants with DEHSI in the “no focal pathology” group. If this were the case, then ADC values in this group would be elevated, and so there may be no Fig 5. A, T1-weighted CSE image at the midventricular level of an infant at 39 weeks’ PMA, who was born at 27 weeks’ GA, demonstrating cystic PVL in the white matter posterior and anterior to the lateral ventricles (arrows). B, T2-weighted FSE image of the same infant demonstrating the cystic lesions as high signal intensity (arrows).
Fig 6. T1-weighted CSE image at the midventricular level of an infant at 41 weeks’ PMA, who was born at 32 weeks’ GA, dem-onstrating multiple punctate high signal intensity lesions in the cerebral white matter (arrows).
TABLE 2. Mean ADC Values for the 3 Groups of Infants
Region ADC Value
(Mean [⫾SD])⫻10⫺3mm2/s
Normal White Matter
DEHSI Overt White Matter Pathology
Frontal white matter 1.361⫾0.10 1.565⫾0.16 1.605⫾0.12 Central white matter 1.287⫾0.12 1.429⫾0.14 1.502⫾0.15 Posterior white matter 1.315⫾0.11 1.535⫾0.14 1.572⫾0.10
difference in ADC values between the 2 groups of infants.
It has been shown that ADC values are higher and anisotropy is lower in preterm infants with no evi-dence of abnormality on MRI at term-equivalent age compared with infants who are born at term,5
sug-gesting differences in the development of cerebral white matter in preterm infants compared with in-fants who are born at term. The reasons for this are not clear, but the white matter in preterm infants is more susceptible to injury. This is attributed to the low blood flow to the cerebral white matter in pre-term infants18 and the susceptibility of immature
oligodendrocytes to injury from free radicals,19
cer-tain cytokines,20,21and glutamate toxicity.22,23In
ad-dition, steroid exposure has been shown to affect the development of the preterm brain.24 Although the
relationship between lesions such as PVL and cere-bral palsy are established, the neuropathological cor-relates for the less severe neurodevelopmental im-pairments in preterm infants are incompletely defined. As focal parenchymal lesions are relatively uncommon, DEHSI may provide the radiologic sub-strate for the high incidence of neurocognitive defi-cits seen in preterm infants. DEHSI may represent delayed white matter maturation or diffuse pathol-ogy in the white matter. However, in view of the fact that DEHSI is clearly distinct from normal-appearing white matter, we propose that DEHSI should be regarded as a diffuse white matter abnormality.
CONCLUSIONS
DWI is able to provide a noninvasive, objective assessment of the cerebral white matter in preterm
infants. Elevated ADC values in DEHSI and infants with overt white matter pathology may be caused by an increase in water content and a decrease in restric-tion to water morestric-tion in the cerebral white matter and suggest diffuse white matter abnormality in these infants. Follow-up studies will determine whether DEHSI is related to poor neurodevelopmental out-come.
ACKNOWLEDGMENTS
We are grateful for the support of the Medical Research Coun-cil, Philips Medical Systems, and the Garfield Weston Foundation.
REFERENCES
1. Cooke RW. Trends in incidence of cranial ultrasound lesions and cere-bral palsy in very low birthweight infants 1982–93.Arch Dis Child Fetal Neonatal Ed.1999;80:F115–F117
2. Heuchan AM, Evans N, Henderson Smart DJ, Simpson JM. Perinatal risk factors for major intraventricular haemorrhage in the Australian and New Zealand Neonatal Network, 1995–97.Arch Dis Child Fetal Neonatal Ed.2002;86:F86 –F90
3. Maalouf EF, Duggan PJ, Rutherford MA, et al. Magnetic resonance imaging of the brain in a cohort of extremely preterm infants.J Pediatr. 1999;135:351–357
4. Le Bihan D, Breton E, Lallemand D, Grenier P, Cabanis E, Laval-Jeantet M. MR imaging of intravoxel incoherent motions: application to diffu-sion and perfudiffu-sion in neurologic disorders.Radiology.1986;161:401– 407 5. Huppi PS, Maier SE, Peled S, et al. Microstructural development of human newborn cerebral white matter assessed in vivo by diffusion tensor magnetic resonance imaging.Pediatr Res.1998;44:584 –590 6. Inder T, Huppi PS, Zientara GP, et al. Early detection of periventricular
leukomalacia by diffusion-weighted magnetic resonance imaging tech-niques.J Pediatr.1999;134:631– 634
7. Miller SP, Vigneron DB, Henry RG, et al. Serial quantitative diffusion tensor MRI of the premature brain: development in newborns with and without injury.J Magn Reson Imaging.2002;16:621– 632
8. Landis JR, Koch GG. The measurement of observer agreement for categorical data.Biometrics.1977;33:159 –174
9. Bland JM, Altman DG. Statistical methods for assessing agreement between two methods of clinical measurement.Lancet.1986;327:307–310 10. Tanner SF, Ramenghi LA, Ridgway JP, et al. Quantitative comparison of intrabrain diffusion in adults and preterm and term neonates and infants.AJR Am J Roentgenol.2000;174:1643–1649
11. Toft PB, Leth H, Peitersen B, Lou HC, Thomsen C. The apparent diffusion coefficient of water in gray and white matter of the infant brain.J Comput Assist Tomogr.1996;20:1006 –1011
12. Sakuma H, Nomura Y, Takeda K, et al. Adult and neonatal human brain: diffusional anisotropy and myelination with diffusion-weighted MR imaging.Radiology.1991;180:229 –233
13. Huppi PS, Murphy B, Maier SE, et al. Microstructural brain develop-ment after perinatal cerebral white matter injury assessed by diffusion tensor magnetic resonance imaging.Pediatrics.2001;107:455– 460 14. Neil JJ, Shiran SI, McKinstry RC, et al. Normal brain in human
newborns: apparent diffusion coefficient and diffusion anisotropy mea-sured by using diffusion tensor MR imaging.Radiology.1998;209:57– 66 15. Counsell SJ, Allsop JM, Harrison MC, Edwards AD, Rutherford MA. Diffusion weighted imaging of the brain in preterm infants [abstract]. Childs Nerv Syst.2002;18:101
16. Paneth N, Rudelli R, Monte W, et al. White matter necrosis in very low birth weight infants: neuropathologic and ultrasonographic findings in infants surviving six days or longer.J Pediatr.1990;116:975–984 17. Volpe JJ, Herscovitch P, Perlman JM, Raichle ME. Positron emission
tomography in the newborn: extensive impairment of regional cerebral blood flow with intraventricular hemorrhage and hemorrhagic intrace-rebral involvement.Pediatrics.1983;72:589 – 601
18. Altman DI, Powers WJ, Perlman JM, Herscovitch P, Volpe SL, Volpe JJ. Cerebral blood flow requirement for brain viability in newborn infants is lower than in adults.Ann Neurol.1988;24:218 –226
19. Back SA, Gan X, Li Y, Rosenberg PA, Volpe JJ. Maturation-dependent vulnerability of oligodendrocytes to oxidative stress-induced death caused by glutathione depletion.J Neurosci.1998;18:6241– 6253 20. Duggan PJ, Maalouf EF, Watts TL, et al. Intrauterine T-cell activation
and increased proinflammatory cytokine concentrations in preterm in-fants with cerebral lesions.Lancet.2001;358:1699 –1700
21. Yoon BH, Jun JK, Romero RH, et al. Amniotic fluid inflammatory cytokines (interleukin-6, interleukin-1, and tumor necrosis factor-␣), neonatal brain white matter lesions, and cerebral palsy.Am J Obstet Gynecol.1997;177:19 –26
22. Oka A, Belliveau MJ, Rosenberg PA, Volpe JJ. Vulnerability of oligo-dendroglia to glutamate: pharmacology, mechanisms, and prevention. J Neurosci.1993;13:1441–1453
23. Yoshioka A, Bacskai B, Pleasure D. Pathophysiology of oligodendroglial excitotoxicity.J Neurosci Res.1996;46:427– 437
24. Murphy BP, Inder TE, Huppi PS, et al. Impaired cerebral cortical gray matter growth after treatment with dexamethasone for neonatal chronic lung disease.Pediatrics.2001;107:217–221
PUPILS OF THE NEONATE
“The iris is not reactive to light until the pupillary light reflex develops between 30 and 34 weeks postmenstrual age. Before the onset of this response, the mean horizontal pupillary diameter is 3.5 mm compared with 3.0 mm after reflex development.”
Fielder AR, Moseley MJ. Environmental light and the preterm infant.Semin Perinatol. 2000;24:291–298
DOI: 10.1542/peds.112.1.1
2003;112;1
Pediatrics
and Mary A. Rutherford
L. Kennea, Olga Kapellou, Frances M. Cowan, Joseph V. Hajnal, A. David Edwards
Serena J. Counsell, Joanna M. Allsop, Michael C. Harrison, David J. Larkman, Nigel
Diffuse White Matter Abnormality
Diffusion-Weighted Imaging of the Brain in Preterm Infants With Focal and
Services
Updated Information &
http://pediatrics.aappublications.org/content/112/1/1
including high resolution figures, can be found at:
References
http://pediatrics.aappublications.org/content/112/1/1#BIBL
This article cites 24 articles, 7 of which you can access for free at:
Subspecialty Collections
sub
http://www.aappublications.org/cgi/collection/fetus:newborn_infant_
Fetus/Newborn Infant
following collection(s):
This article, along with others on similar topics, appears in the
Permissions & Licensing
http://www.aappublications.org/site/misc/Permissions.xhtml
in its entirety can be found online at:
Information about reproducing this article in parts (figures, tables) or
Reprints
http://www.aappublications.org/site/misc/reprints.xhtml
DOI: 10.1542/peds.112.1.1
2003;112;1
Pediatrics
and Mary A. Rutherford
L. Kennea, Olga Kapellou, Frances M. Cowan, Joseph V. Hajnal, A. David Edwards
Serena J. Counsell, Joanna M. Allsop, Michael C. Harrison, David J. Larkman, Nigel
Diffuse White Matter Abnormality
Diffusion-Weighted Imaging of the Brain in Preterm Infants With Focal and
http://pediatrics.aappublications.org/content/112/1/1
located on the World Wide Web at:
The online version of this article, along with updated information and services, is
by the American Academy of Pediatrics. All rights reserved. Print ISSN: 1073-0397.