STUDY ON PERFORMANCE OF 220 kV
M/C MA
TOWER DUE TO WIND
V. LAKSHMI
Assistant Professor, Department of Civil Engineering, JNT University Kakinada Kakinada, Andhra Pradesh, India
M.V.R. SATYANARAYANA
Assistant Engineer, PRI Division, Panchayat Raj Department, Kakinada, Andhra Pradesh, India
V.RAVINDRA
Professor, Department of Civil Engineering, JNT University Kakinada Kakinada, Andhra Pradesh, India
Abstract
Electric Power is today playing an increasingly important role in the life of the community. In the electric power system the production and transmission of power are two predominant factors. For the purpose of transmission of electricity towers are the main medium with some wires at required distances and altitudes. The remote hydroelectric power plants have given rise to the need for extra high voltage. Prior to 1950, 150 kV electric transmission lines were considered and still higher voltages are being considered these days. Hence it has given rise to the need for relative tall structures such as towers. Thus the study of designing and erection of steel towers has become a challenging task. Transmission line tower normally comprise of several hundred - angle members eccentrically connected. Structural analysis of this type of structure requires extensive data generation. Conventional process of data generation in describing the topology, geometry, load and support conditions are very tedious, time consuming and susceptible to error. In general, most towers may be idealized as statically determinate and analyzed for forces. However, the computations are very lengthy and there are many chances of making errors in such cases. Further if a member is to be redesigned then the entire wind load computations have to be repeated. The computational problem in tower is more acute and tedious as the load depends on the member sizes. A rational and economical design can be made with the help of software’s like STADD Pro 2003, SAP-2000.In this dissertation an attempt is made to develop a software for load calculations on transmission line towers of capacity 220 kV, only as per new code i.e., IS – 802 (Part- I / Sec-1):1995 by considering reliability, security, safety and anti-cascading conditions. In MS-office the EXCEL is used to develop program for wind load calculations on the tower and other loads like wind load on conductor, conductor weights are calculated manually. Then these loads are applied on the model done in the STADD Pro for analysis. Different types of failure conditions are modeled and their effects on the performance of the tower are studied.
1. Introduction
The performance of the intact structure under medium wind load of basic wind speed 38.8 m/sec is presented. The configuration of tower consists of 33.935 m height arranged in 13 height panels at different levels. The structure has 131nodes and 225 members. The tower is to transmit tower voltage of 220 kV. The details of load calculation, modeling and analysis are discussed. The wind intensity converted into point loads and loads are applied at panel joints.
2. Formulation of the Problem
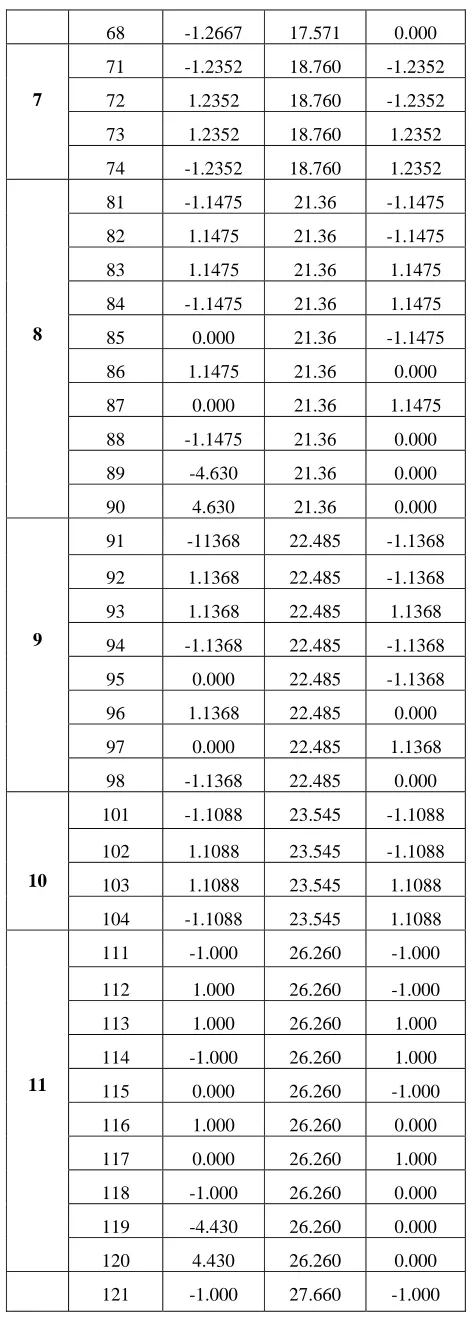
TABLE 1 Joint Co-ordinates of the node numbers
Tier Node Number
CO-ORDINATES OF NODE POINT
DISTANCES in m
X Z Y
1
11 -4.520 0.000 -4.520
12 4.520 0.000 -4.520
13 4.520 0.000 4.520
14 -4.520 0.000 4.520
2
21 -3.3986 5.6800 -3.3986
22 3.3986 5.6800 -3.3986
23 3.3986 5.6800 3.3986
24 -3.3986 5.6800 3.3986
3
31 -2.297 11.260 -2.297
32 2.297 11.260 -2.297
33 2.297 11.260 2.297
34 -2.297 11.260 2.297
4
41 -1.6514 14.530 -1.6514
42 1.6514 14.530 -1.6514
43 1.6514 14.530 1.6514
44 -1.6514 14.530 1.6514
5
51 -1.300 16.310 -1.300
52 1.300 16.310 -1.300
53 1.300 16.310 1.300
54 -1.300 16.310 1.300
55 0.000 16.310 -1.300
56 1.300 16.310 0.000
57 0.000 16.310 1.300
58 -1.300 16.310 0.000
59 -5.155 16.310 0.000
60 5.155 16.310 0.000
6
61 -1.2667 17.571 -1.2667
62 1.2667 17.571 -1.2667
63 1.2667 17.571 1.2667
64 -1.2667 17.571 1.2667
65 0.000 17.571 -1.2667
66 1.2667 17.571 0.000
68 -1.2667 17.571 0.000
7
71 -1.2352 18.760 -1.2352
72 1.2352 18.760 -1.2352
73 1.2352 18.760 1.2352
74 -1.2352 18.760 1.2352
8
81 -1.1475 21.36 -1.1475
82 1.1475 21.36 -1.1475
83 1.1475 21.36 1.1475
84 -1.1475 21.36 1.1475
85 0.000 21.36 -1.1475
86 1.1475 21.36 0.000
87 0.000 21.36 1.1475
88 -1.1475 21.36 0.000 89 -4.630 21.36 0.000
90 4.630 21.36 0.000
9
91 -11368 22.485 -1.1368
92 1.1368 22.485 -1.1368
93 1.1368 22.485 1.1368
94 -1.1368 22.485 -1.1368
95 0.000 22.485 -1.1368
96 1.1368 22.485 0.000
97 0.000 22.485 1.1368
98 -1.1368 22.485 0.000
10
101 -1.1088 23.545 -1.1088
102 1.1088 23.545 -1.1088
103 1.1088 23.545 1.1088
104 -1.1088 23.545 1.1088
11
111 -1.000 26.260 -1.000
112 1.000 26.260 -1.000
113 1.000 26.260 1.000
114 -1.000 26.260 1.000
115 0.000 26.260 -1.000
116 1.000 26.260 0.000
117 0.000 26.260 1.000
118 -1.000 26.260 0.000
119 -4.430 26.260 0.000
120 4.430 26.260 0.000
121 -1.000 27.660 -1.000
12 122 1.000 27.660 -1.000
123 1.000 27.660 1.000
124 -1.000 27.660 1.000
13 131 0.000 33.935 0.000
3. Calculation of Co-efficient of drag
For panel – I
Base width (a) = 9.04 m
Top width (b) = 6.78 m
Height (h) = 5.68 m
Members faced along wind direction
Leg members (130 x 12) – 2Nos,
Diagonal members (75 x 6) – 2Nos.
In between members (50 x 6) R1 to R8 – 2Nos.
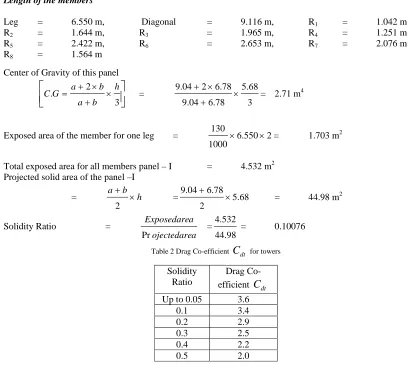
Length of the members
Leg = 6.550 m, Diagonal = 9.116 m, R1 = 1.042 m
R2 = 1.644 m, R3 = 1.965 m, R4 = 1.251 m
R5 = 2.422 m, R6 = 2.653 m, R7 = 2.076 m
R8 = 1.564 m
Center of Gravity of this panel
3 2 . h b a b a GC =
3 68 . 5 78 . 6 04 . 9 78 . 6 2 04 . 9
= 2.71 m4
Exposed area of the member for one leg = 6.550 2 1000
130
= 1.703 m2
Total exposed area for all members panel – I = 4.532 m2 Projected solid area of the panel –I
= abh 2
= 5.68
2 78 . 6 04 . 9
= 44.98 m2
Solidity Ratio =
a ojectedare
a Exposedare
Pr =44.98 532 . 4
= 0.10076
Table 2 Drag Co-efficient
C
dt for towers SolidityRatio
Drag Co-efficient
C
dt Up to 0.05 3.60.1 3.4 0.2 2.9 0.3 2.5 0.4 2.2 0.5 2.0
For this solidity ratio the coefficient drag values given are interpolated from table 2
0.1 3.4
0.2 2.9
For the value the solidity ratio
0.10076 3.396
4.Calculation of Wind Load
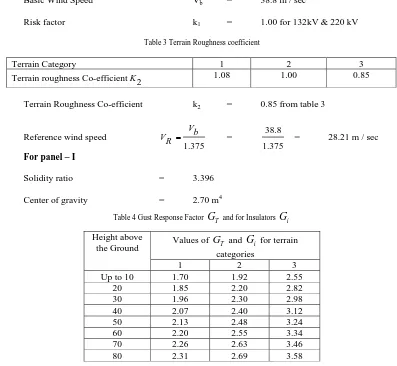
Basic Wind Speed Vb = 38.8 m / sec
Risk factor k1 = 1.00 for 132kV & 220 kV
Table 3 Terrain Roughness coefficient
Terrain Category 1 2 3
Terrain roughness Co-efficientK2 1.08 1.00 0.85
Terrain Roughness Co-efficient k2 = 0.85 from table 3
Reference wind speed
375 . 1
b V R
V =
375 . 1
8 . 38
= 28.21 m / sec
For panel – I
Solidity ratio = 3.396
Center of gravity = 2.70 m4
Table 4 Gust Response Factor
G
T and for InsulatorsG
i Height abovethe Ground Values of
G
T andG
i for terrain categories1 2 3
Up to 10 1.70 1.92 2.55
20 1.85 2.20 2.82
30 1.96 2.30 2.98
40 2.07 2.40 3.12
50 2.13 2.48 3.24
60 2.20 2.55 3.34
70 2.26 2.63 3.46
80 2.31 2.69 3.58
Note: Intermediate values may be linearly interpolated.
Gust factor GT = 1.70 (This value is taken from table 4)
Design Wind Speed R V k k d
V 1 2 = 1.000.8528.21= 23.98 m / sec
Design wind pressure 2 6 . 0 Vd d
P = 0.623.982 = 345.02 m / sec
Force for Panel – I T G e A dt C d P wt
F =345.023.3964.5322.55 = 13540.728
5. Parameters for Study
The Parameters involved in this study are axial deflections, axial forces in various members of the transmission tower under basic wind speed is 38.8 m/sec. The tower is 3D space frame with the deflections are in three planes viz. UXY Deflection in XY plane i.e. opposite to Z-axis, UYZ deflection in YZ plane i.e. opposite to X-axis and Uxz deflection in XZ plane i.e. opposite to Y-axis are considered.
The deflections of nodes in three planes are presented in Table 5, Axial forces of vertical members are presented in Table 6. Axial forces of horizontal members are presented in Table 7. Axial forces of diagonal members are presented in Table 8. The details of deletions at various nodes are presented in figure 2, 3, and 4. Similarly the axial forces in various vertical, horizontal and diagonal members are furnished in figure 5, 6 and 7.
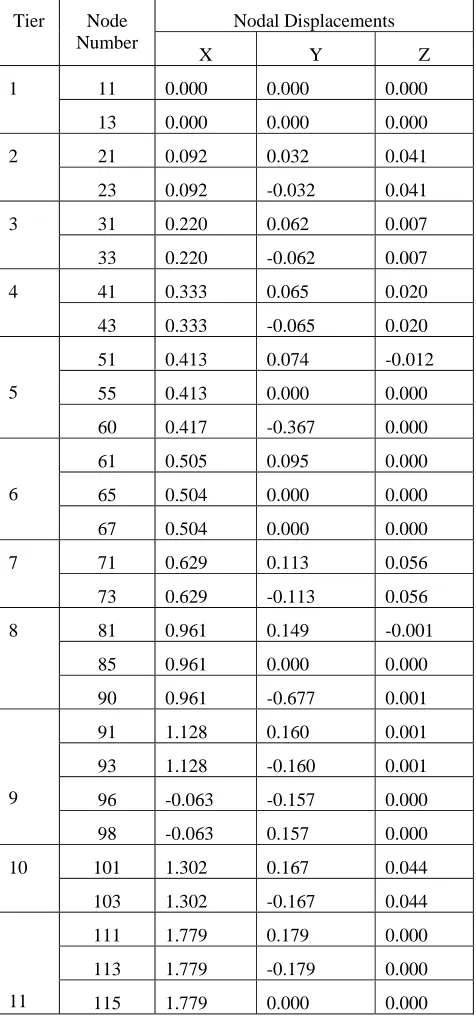
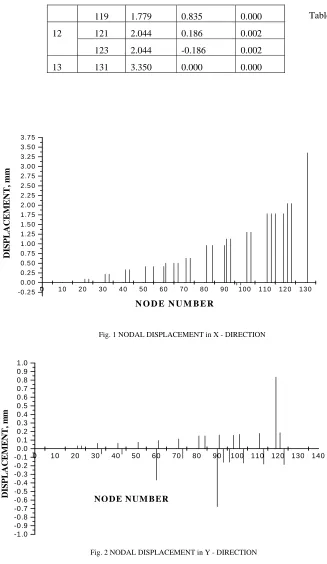
Table 5 Nodal Deflections in Tower for Wind Load
Tier Node Number
Nodal Displacements
X Y Z
1 11 0.000 0.000 0.000
13 0.000 0.000 0.000
2 21 0.092 0.032 0.041
23 0.092 -0.032 0.041
3 31 0.220 0.062 0.007
33 0.220 -0.062 0.007
4 41 0.333 0.065 0.020
43 0.333 -0.065 0.020
5
51 0.413 0.074 -0.012
55 0.413 0.000 0.000
60 0.417 -0.367 0.000
6
61 0.505 0.095 0.000
65 0.504 0.000 0.000
67 0.504 0.000 0.000
7 71 0.629 0.113 0.056
73 0.629 -0.113 0.056
8 81 0.961 0.149 -0.001
85 0.961 0.000 0.000
90 0.961 -0.677 0.001
9
91 1.128 0.160 0.001
93 1.128 -0.160 0.001
96 -0.063 -0.157 0.000
98 -0.063 0.157 0.000
10 101 1.302 0.167 0.044
103 1.302 -0.167 0.044
11
111 1.779 0.179 0.000
113 1.779 -0.179 0.000
119 1.779 0.835 0.000
12 121 2.044 0.186 0.002
123 2.044 -0.186 0.002
13 131 3.350 0.000 0.000
Table 5 (Continued)
0 1 0 2 0 3 0 4 0 5 0 6 0 7 0 8 0 9 0 1 0 0 1 1 0 1 2 0 1 3 0
-0 .2 5 0 .0 0 0 .2 5 0 .5 0 0 .7 5 1 .0 0 1 .2 5 1 .5 0 1 .7 5 2 .0 0 2 .2 5 2 .5 0 2 .7 5 3 .0 0 3 .2 5 3 .5 0 3 .7 5
DIS
P
LACE
M
E
N
T
, m
m
N O D E N U M B E R
Fig. 1 NODAL DISPLACEMENT in X - DIRECTION
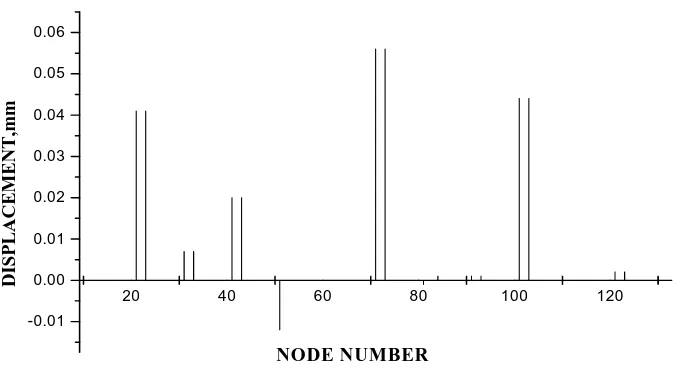
0 10 20 30 40 50 60 70 80 90 100 110 120 130 140
-1.0 -0.9 -0.8 -0.7 -0.6 -0.5 -0.4 -0.3 -0.2 -0.1 0.0 0.1 0.2 0.3 0.4 0.5 0.6 0.7 0.8 0.9 1.0
D
ISP
LACEM
ENT
, m
m
NO DE NUM BER
6. Performance of Tower Based on Deflections
The members in 11th, 12th and 13th tier had largest deformation with node 131 recording peak deformation in the direction of wind flow in YZ plane. The deformations are maximum positive values and the 4th and 9th tier nodes having negative values, the maximum negative value at node 43 and all nodes subsequent tiers had deformation bending the tower in one direction as shown in figure.1.
The bent shape can be clearly felt along XZ plane with least deformation at all nodes near the base and as we approach to top of the tower having largest deformation. Symmetric deformation among all the nodes of one plane is observed from the figure 2.
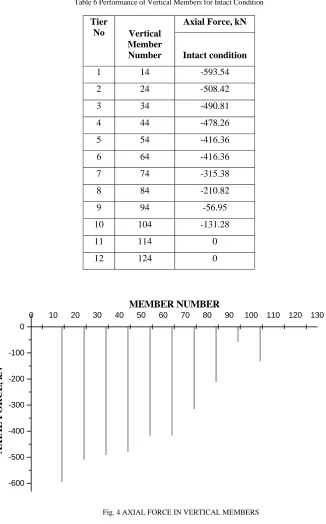
Both the nodes facing the wind and nodes away from wind direction in one plane had same deflection of the figure 3.
7. Performance of Tower Based on Member Forces
After determination of the external loads acting on the tower is calculated, the deflections in different planes are observed in previous section. In this section the truss is analyzed for lateral wind loads for the forces in various members with a view to fixing up their sizes. Since axial force for a truss element, the member has to be designed for either compression or tension. When there are multiple load conditions certain members may be subjected to both compression and tensile forces under different loading conditions. Reversal of loads may induce alternate nature of forces. The total compression or tensile forces in horizontal, vertical and diagonal members are given in table 6, 7, and 8.
To critical elements are also observed from the figures indicating both deflections and member forces. The graphs are drawn between node numbers and deflections in figure 1, 2 and 3 and member numbers and axial forces in figure 5,.6 and 7.
20 40 60 80 100 120
-0.01 0.00 0.01 0.02 0.03 0.04 0.05 0.06
DISPLACE
ME
NT,
m
m
NODE NUMBER
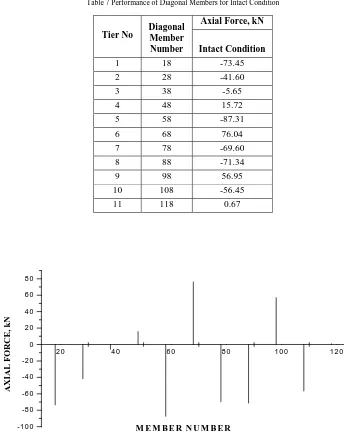
Table 6 Performance of Vertical Members for Intact Condition
Tier
No Vertical Member Number
Axial Force, kN
Intact condition
1 14 -593.54
2 24 -508.42
3 34 -490.81
4 44 -478.26
5 54 -416.36
6 64 -416.36
7 74 -315.38
8 84 -210.82
9 94 -56.95
10 104 -131.28
11 114 0
12 124 0
0 10 20 30 40 50 60 70 80 90 100 110 120 130
-600 -500 -400 -300 -200 -100 0
AX
IA
L FOR
C
E,
kN
MEMBER NUMBER
Table 6 Performance of Horizontal Members for Intact Condition
Tier No
Horizontal Member Number
Axial Force, kN Intact condition
4 415 0
416 0
5 515 -7.89
516 7.89
7 715 0
716 0
8 815 -9.78
816 9.78
10 1015 0
1016 0
11 1114 -57.11
4 0 0 5 0 0 6 0 0 7 0 0 8 0 0 9 0 0 1 0 0 0 1 1 0 0 1 2 0 0
-6 0 -5 0 -4 0 -3 0 -2 0 -1 0 0 1 0
AX
IA
L FORCE,
kN
M E M B E R N U M B E R
Table 7 Performance of Diagonal Members for Intact Condition
Tier No Diagonal Member Number
Axial Force, kN
Intact Condition 1 18 -73.45 2 28 -41.60
3 38 -5.65
4 48 15.72 5 58 -87.31 6 68 76.04 7 78 -69.60 8 88 -71.34 9 98 56.95
10 108 -56.45
11 118 0.67
8. Performance of Tower Due to Member Forces
In vertical members as shown figure 4 A uniform reduction in axial compressive forces is observed as we approach top tier from bottom tier vertical members.
As shown in figure 5 the horizontal members in 4th, 7th and 10th tier members had no axial forces, the maximum axial forces in the 11th tier member. At 5th and 8th tiers the axial force is more as compared to its successive tiers, which accommodate of conductors. It is observed that in horizontal members in tiers attached to cross arms (5, 8, 11) large values of axial tensile forces are observed and in horizontal member in tiers immediately below the tiers where cross arms (4, 7, 10) are connected the axial forces are minimum due to redistribution of axial forces.
The diagonal members as shown figure 6 had largest axial forces in all tiers and the 3rd and 11th tier members are very low axial forces compare with other tiers. Axial forces are present in all diagonal members in all tiers and there is reduction in axial force in tiers, in which horizontal members have significant contribution.
2 0 4 0 6 0 8 0 1 0 0 1 2 0
-1 0 0 -8 0 -6 0 -4 0 -2 0 0 2 0 4 0 6 0 8 0
AX
IA
L
FORC
E,
kN
M E M B E R N U M B E R
Considering the above diagram the members in the bottom two tiers are critical in taking the cable load under medium wind intensity. More over the vertical members in the bottom ties are likely to have larger contribution of the loads and are vital in stability of the tower under any loading conditions. Any abnormality in the cross sectional properties or the material properties are likely to result in abnormal functioning of the entire structure.
9. Conclusions
1. It is observed that the effect of broken conductor & ground wire is not significant in lower tier members. As we approach the top tiers, the effect is felt near the panels connected to cross arm due to redistribution of forces in members.
2. In case of the tower subjected to wind load maximum positive deformation is observed at peak in the direction of wind flow and maximum negative deformations are observed in 4th tier leading to formation of contra-flexure point between 4th and top tier.
3. A uniform reduction in axial compressive forces is observed as we approach top tier from bottom tier vertical members.
4. It is observed that in horizontal members in tiers attached to cross arms (5, 8, and 11) large values of axial tensile forces are observed. The member in tiers immediately below the tiers where cross arms are connected (4, 7, and 10) the axial forces reduced due to redistribution of axial forces.
5.
Axial forces are present in all diagonal members in all tiers and there is reduction in axial force in tiers, in which horizontal members have significant contribution.
10. References
[1] Anantakumar V.Torne , M.Tech. Dissertation Thesis titled “Damage detection in Transmission Line Towers with Dynamic Response Characteristics”, submitted to Visveswara National Institute of Technology, Nagpur.
[2] Biswas, M., Pandey, A. K., and Bluni, S., “Modified Chain-code computer vision techniques for interrogation of vibration signatures for structural fault detection,” Journal of Sound and Vibration, 175(1), pp 89-104 (1994).
[3] Biswas, M., Pandey, A. K., and Samman, M. M. “Diagnostic experimental /modal analysis of a highway bridge,” Modal Analysis: The International Journal of Analytical and Experimental Modal analysis, 5, pp 33-42 (1990).
[4] Casas J. R., Aparico A. C. (1994) “Structural damage identification from dynamic test data”, Journal of Structural Engineering; 120 (8), 2437-2449.
[5] Chaudhry Z., Ganino A. J., (1994). “Damage detection using neural networks: An itial experimental study on debonded beams”, Journal of Intelligent Material Systems and Structures, 5 (4), 585-589.
[6] Design and Construction failures by Dov Kaminetzky, M.S., P.E. Field kaminetzky & Cohen, P.c. New York.
[7] Doebling S. W., Farrar C. R., Prime M. B., Shevitz D. W., (1996) "Damage identification and health monitoring of structural systems from changes in their vibration characteristics: A literature review", Technical report LA-13070-MS, Los Alamos National Laboratory, Los Alamos, New Mexico.
[8] G. Munuswamy Naidu “Seminar Report on Span Tension and Sag Tension Curves for stringing conductors in Transmission lines”, Published in A.P.S.E.B.Annual Manual.
[9] Indian Electricity Rule, 1956.
[10] IS: 802 (Part 1/sec-1): 1995, “Code of practice for use of structural steel in over head Transmission line towers”, Bureau of Indian Standards, New Delhi.
[11] John B Kosmatka & James M Ricles, (1999), “Damage Detection in structures by modal Vibration Characterization”, Journal of Structural Engineering, Vol-125,No.12, Pg1384-1392.
[12] K.V.S.S. Prasad, E.V. Rao, M. Krishna Kumar and D. Choudary “Seminar Report on New Trends in Transmission Line Tower Design with Reference to Revision in IS: 802” Power Grid Corporation of India Limited, New Delhi.
[13] Kaouk, M. and Zimmerman, D.C. (1994) “Structural damage assessment using a generalized minimum rank perturbation theory”, AIAA Journal No 32, Vol. 12, pp.836-842.
[14] P. Purushothama & P. V. Subba Rao “Seminar Report on Insulators and Conductors for Transmission Lines” by A.P.S.E.B., Published in A.P.S.E.B. Annual Manual.
[15] Pei liu, (1995) , “Identification and Damage Detection of trusses using model data” , Journal of Structural Engineering, Vol-121, No.4,Page.599-608.
[16] Ronaldo C Battista, Rosangela S Rodrigues & Michele S Pfeil, 2003, “Dynamic behavior and stability of transmission line Towers under Wind forces”, Journal of Wind engineering and Industrial Aerodynamics, Vol-91,Pg.1051-1061.
[17] S.S. Murthy & A.R. Santha Kumar, “Transmission Line structures” Tata Mc Graw-Hill publishing company Limited, 1995.
[18] Samman, M. M., and Biswas, M., “vibration Testing for nondestructive evaluation of bridges,” Journal of Structural Engineering, 120 (1), pp 290-306 (1994).