International Journal of Medical Science and Current Research (IJMSCR)
Available online at: www.ijmscr.com
Volume2, Issue 5,Page No: 283-287
September-October 2019
283
Medicine ID-101739732
Acute Metabolic Response (Serum Glucose, Lactate & Triglyceride levels) To Fasting and
Post-Prandial Exercise
Dr .Abhinav Gupta1, Dr. Kapil Gupta2*, Dr. Anil K.Gupta3, Dr. Vinu Jamwal4, Dr. Abhinav Gupta5 1,2
Post Graduate, 3MD Medicine, Professor and Head of Department, 4,5MD Medicine, Associate Professor Department of Medicine, ASCOMS College, Jammu (J&K), India, Pin 180017
*Corresponding Author:
Dr Kapil Gupta
Post Graduate, Department of Internal Medicine, ASCOMS College, Jammu (J&K) India
Type of Publication: Original Research Paper Conflicts of Interest: Nil
ABSTRACT
Background
Metabolic responses to exercise are extremely complex, involving many interacting variables like endocrinological, physiological (cardiovascular and neuromuscular), biochemical, nutritional, and central nervous system components. So the study was done to analyze the acute metabolic response (Serum Glucose, Lactate & Triglyceride levels) to exercise in fasting and postprandial state.
Method-
The Volunteers selected were subjected to two exercise sessions in fasting and in fed state separated by 72 hours each. Two venous samples of volunteers were obtained prior to and immediately after exercise, and used for determination of serum glucose, lactate, and triglyceride levels.
Result-
Glucose concentration was increased in the case of exercise during fasting and a significant reduction in glucose concentration in the postprandial period. The lactate concentration increased significantly as compared with the rest in both conditions Serum lactate level during fed state was significantly less than that during fasting state. Triglycerides also increased in the two experimental conditions, though they were significantly higher after exercise during fasting than in the case of postprandial exercise.
Conclusion- Postprandial exercise is better as compared to exercise in fasting state.
Keywords: Glucose, Exercise and Lactate.
INTRODUCTION
Metabolism is the set of life-sustaining chemical transformations within the cells of organisms and is
divided into two categories: catabolism,
and anabolism. The chemical reactions of metabolism are organized into metabolic pathway, by
a sequence of enzymes Enzymes allow
the regulation of metabolic pathways in response to changes in the cell’s environment or to signals from other cells. Metabolic responses to exercise are extremely complex, involving many interacting
variables, which include endocrinological,
physiological (cardiovascular and neuromuscular), biochemical, nutritional, and central nervous system components1. As the environment of most persons is constantly changing, the reactions of metabolism must be finely regulated to maintain a constant set of
conditions within cells, a condition called
284
284
284
284
284
284
284
284
284
284
284
284
284
284
284
284
284
284
284
284
284
in the form of soluble messengers such as hormones and growth factors and are detected by specific receptors on the cell surface.These signals are then transmitted inside the cell by second messenger systems that often involve phosphorylation of proteins4. There are different levels of metabolic integration during exercise like-Intensity of exercise,
Duration of exercise, Effects of prior
conditioning/training, Existing hormonal level and Effects of prior dietary intake so the study was done to analyze the acute metabolic response (Serum Glucose, Lactate & Triglyceride levels) to exercise in fasting and postprandial state.
Material methods-
50 Healthy adults in Department of Medicine in Acharya Shri Chander College of Medical Sciences and Hospital (ASCOMS& Hospital), Sidhra, Jammu were selected and after taking approval by the Institutional Ethics Committee of the hospital.
The Volunteers were subjected to preliminary anthropometric assessment and assessment of maximal oxygen consumption (VO2max) using uniform and accurate tools like for Weight,for Height,
VO2max was measured using the formula VO2 max =
15 x (HRmax/HRrest) where HR refers to heart rate -maximum (HRmax) and at rest (HRrest) 5. The maximum heart rate was calculated by subtracting the age in years from 220 6. A questionnaire regarding possible pathologies, present and past history, level of physical activity, eating habits was recorded for each volunteer in a predesigned proforma to rule out any condition that could interfere with the performance on treadmill. Two exercise sessions were performed – in fasting and in fed state, separated by 72 hours each .Two venous samples of volunteers were obtained prior to and immediately after exercise and used for determination of serum glucose, lactate, and triglyceride levels. Laboratory investigations include Complete blood count and ESR, Fasting Blood Glucose ,Serum Urea and
Creatinine, Routine Urine examination,
Electrocardiography, Chest X-ray (PA view) and Ultrasound of Abdomen & Pelvis. The data recorded was subjected to statistical analysis and the results
are being expressed with appropriate
charts/tables/diagrams. A p-value of <0.05 is considered significant.
- Age 20 to 30 years
- Both genders
- Non smoker
- No known Cardiovascular,Metabolic,or
Musculoskeletal Disease that could affect the performance on procedures
- Regular physical activity for at least 12 months
EXCLUSION CRITERIA
- Age <20 or >30 years
- Currently suffering from any ailment - Sedentary lifestyle
- Participants who will refuse to cooperate with the study
Results-
Majority of subjects were in the age group of 26-30 years (43; 86%), followed by 21-25 years (7; 14%). Mean age of the subjects was 26.76 with a range of 21 to 30 years. Male subjects dominated the study group (37; 74%) with male to female ratio of 2.85:1.Most subjects had height in the range of 1.6-1.69 meter (22; 44%), followed by 1.7-1.79 meter (17; 34%), >1.8 meter (7; 14%) and 1.5-1.59 meter (4; 8%).Mean height of the subjects was 1.67 with a range of 1.5 to 1.85 .Majority of subjects had weight in the range of 70-79 kg (26; 52%), followed by 60-69 kg (14; 28%), 80-89 kg (5; 10%), 50-59 kg (4; 8%) and >90 kg (1; 2%).Mean weight of the subjects was 70.04 with a range of 52 to 90
Equal number of subjects(25;50%) had BMI in the range of 18.5 to 24.9 kg/m2 (normal) and 25 to 29.9 (overweight) respectively. No subject was obese in this study. Mean BMI of the subjects was 25.03 with a range of 20.76 to 29.38 kg/m2. Mean values of haemodynamic parameters like pulse rate (74.18 beats/minute), SBP (123.72 mmHg), DBP (74.6 mmHg) and respiratory rate (14.3 breaths/minute) were in the normal range .During cardiorespiratory fitness test, female subjects performed better as compared to male subjects
Pag
e
285
Pag
e
285
Pag
e
285
Pag
e
285
Pag
e
285
Pag
e
285
Pag
e
285
Pag
e
285
Pag
e
285
Pag
e
285
Pag
e
285
Pag
e
285
Pag
e
285
Pag
e
285
Pag
e
285
Pag
e
285
Pag
e
285
Pag
e
285
Pag
e
285
Pag
e
285
Pag
e
285
p<0.0001). Similarly after exercise, mean serum glucose level during fed state was significantly more
than that in fasting state (100.88 vs 92.72 mg/dL; p<0.0001
Table 1: Comparison of mean serum glucose during fasting and fed state before exercise and after exercise (n=50)
Variable
Serum glucose (mg/dL)
Statistical inference (Unpaired t test)
Fasting state (n=50)
Mean ± SD
Fed state (n=50) Mean ± SD
Before exercise 87.4 ± 5.67 115.76 ± 4.67 t=27.30; p<0.0001; HS
After exercise 92.72 ± 5.64 100.88 ± 5.43 t=7.36; p<0.0001; HS
HS = highly significant
Mean serum lactate level during fasting state before exercise was 1.42 mmol/L, which increased significantly after exercise to 3.71 mmol/L (p<0.0001).
Similarly, serum lactate level during fed state before exercise was 1.54 mmol/L, which increased significantly after exercise to 3.25 mmol/L (p<0.0001
Table 2: Comparison of mean serum lactate before and after exercise in fasting and fed state (n=50)
Variable
Serum lactate (mmol/L)
Statistical inference (Unpaired t test)
Before exercise Mean ± SD
After exercise Mean ± SD
Fasting state
(normal 0.5-2 mmol/L) 1.42 ± 0.18 3.71 ± 0.16 t=67.23; p<0.0001; HS
Fed state (separated by 72 hours)
(normal 0.5-2 mmol/L) 1.54 ± 0.16 3.25 ± 0.19 t=48.67; p<0.0001; HS
HS = highly significant
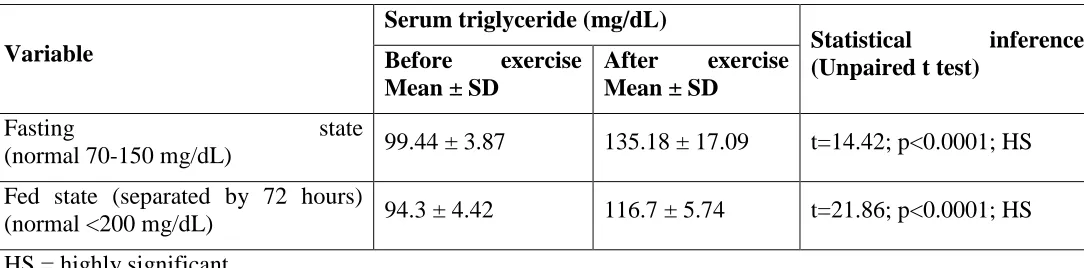
Mean serum triglyceride level during fasting state before exercise was 99.44 mg/dL, which increased significantly after exercise to 135.18 mg/dL (p<0.0001).
Similarly, serum triglyceride level during fed state before exercise was 94.3 mg/dL, which increased significantly after exercise to 116.7 mg/dL (p<0.0
Table 3: Comparison of mean serum triglyceride before and after exercise in fasting and fed state (n=50)
Variable
Serum triglyceride (mg/dL)
Statistical inference (Unpaired t test)
Before exercise Mean ± SD
After exercise Mean ± SD
Fasting state
(normal 70-150 mg/dL) 99.44 ± 3.87 135.18 ± 17.09 t=14.42; p<0.0001; HS
Fed state (separated by 72 hours)
(normal <200 mg/dL) 94.3 ± 4.42 116.7 ± 5.74 t=21.86; p<0.0001; HS
286
286
286
286
286
286
286
286
286
286
286
286
286
286
286
286
286
286
286
286
286
Before exercise, mean serum triglyceride level during fed state was significantly less than that during fasting state (94.3 vs 99.44; p<0.0001).Similarly after exercise, serum triglyceride level during fed state was significantly less than that during fasting state (116.7 vs 135.18; p<0.0001}
DISCUSSION
In this study, blood glucose increases
significantly during exercise while fasting, probably due to the release of glucose by the liver via glycogenolysis and gluconeogenesis, stimulated by glucagon, catecholamines, and cortisol. In the fasting state, cortisol rises considerably, stimulating the release of glucagon and reducing the sensitivity of the
liver to this hormone7,8 . Glucose
concentration in the postprandial exercise was reduced due to the release of insulin stimulated by carbohydrate intake Thus, the glucose present in the blood was used as fuel without having to resort to the liver glycogen. During exercise, the increase in cortisol
followed by glucagon stimulates
gluconeogenesis and glycogenolysis, while the decrease in insulin concentration increases the sensitivity of the liver to glucagon, due to the increase in the number of receptors. Insulin concentration is reduced during moderate exercise, while the increased sensitivity of glucagon in the liver results in the production of glucose.
In this sense, not only intensity, type, and duration of exercise but also carbohydrate intake before exercise seems to affect the
behavior of blood glucose11.Glucose
concentration is influenced by exercise intensity. According to Thompson12 et al (2001), blood glucose is maintained constant even with strenuous exercise,.
In a study by Lima13 et al., 2015 exercise in the fasting state performed for 36 minutes at 65% of Vo2max cannot significantly alter blood glucose, while feeding increases resting levels and modifies the response of glucose to exercise.
In this study, the plasma lactate concentration
increases significantly in the two
state being significantly less than that during fasting state. The intensity of exercise selected seems to be sufficient to stimulate the glycolytic metabolism, since the lactate production was enhanced to values above the threshold. Furthermore, the influence of catecholamine secretion in lactate kinetics14is crucial to explain the behavior of this metabolite after the two experimental conditions studied here.
This study shows that there was significant increase in triglycerides in both situations, with significantly less levels postprandial than that during fasting state.
The enhancement of lipolysis seems to occur during physical activity, generating an increase in plasma triglyceride concentration, and consequently its subcomponents, glycerol and free fatty acids15,. The increase in lipolysis rate is due to the accentuated catecholamine secretion in addition to a higher sensitivity of adipose tissue to these hormones generated by the exercise.16 The stimulation of the release of triglycerides by increased secretion of epinephrine and norepinephrine helps explain the higher rate of lipolysis of the exercise in the fasting state, since the hormonal response of this protocol is increased17
The triglycerides concentration can be
affected by other factors besides lipolysis stimulation. The reduction of triglyceride concentration may occur due to the decrease in production of hepatic very-low density lipoprotein or lipoprotein lipase response18, as well as the activity of chylomicrons. The behavior of triglycerides after exercise is influenced by the level of training of individuals, providing higher releases in trained individuals19. This relationship seems to be favorable to the subjects in the study because they were all regular physical activity practitioners.
CONCLUSION
Pag
e
287
Pag
e
287
Pag
e
287
Pag
e
287
Pag
e
287
Pag
e
287
Pag
e
287
Pag
e
287
Pag
e
287
Pag
e
287
Pag
e
287
Pag
e
287
Pag
e
287
Pag
e
287
Pag
e
287
Pag
e
287
Pag
e
287
Pag
e
287
Pag
e
287
Pag
e
287
Pag
e
287
experimental conditions promoted a significant increase in blood lactate values considered above lactate threshold. However, feeding does decrease
lactate production. The plasma triglyceride
concentration suffered elevation in both the procedures; however, fasting promoted greater release, showing an increase in lipolysis generated by this protocol.
Thus postprandial exercise is better as compared to fasting exercise as per this study, as it maintains fairly normal blood glucose levels, has decrease risk of lactic acidosis and promotes lipolysis to a greater extent as compared exercise performed while fasting, thus having a favorable effect on carbohydrate, lipid and protein metabolism.
References-
1. Edward, S.,.Horton and William,
R..Beisel.1994. Food Components to Enhance Performance: An Evaluation of Potential Performance-Enhancing Food Components for Operational Rations. Institute of Medicine (US) Committee on Military Nutrition Research; Marriott BM, editor. Washington (DC): National Academies Press (US).
2. Albert, R. 2005. Scale-free networks in cell biology. J Cell Sci.,118 (Pt 21): 4947–57.
3. Brand, M. 1997. Regulation analysis of
energy metabolism. J Exp Biol. 200 (Pt 2): 193–202.
4. Maughan, R. J., Fallah, J. and Coyle, E. F. 2010. The effects of fasting on metabolism and performance. Br J Sports Med. 44(7): 490–494.
5. Goodwin, M. L.2010.Blood glucose
regulation during prolonged, submaximal, continuous exercise: a guide for clinicians. J
Diabetes Sci Technol.;4(3): 694–705.
6. Brooks, G. A., Wolfel, E.E., Butterfield, G. E., et al.1998. Poor relationship between arterial [lactate] and leg net release during exercise at 4,300 m altitude. Am J Physiol. 275(4 Pt2): R1192–R1201.
7. Thompson, P. D., Crouse, S. F., Goodpaster, B. et al.2001. The acute versus the chronic
response to exercise. Med Sci Sports
Exerc.;33(6 Suppl): S438–S445.
8. Awobajo, F. O., Olawale, O.A., Bassey, S. 2013. Changes in blood glucose, lipid profile and antioxidant activities in trained and
untrained adult male subjects during
programmed exercise on the treadmill. Nig Q
J Hosp Med. 2013 Apr-Jun;23(2): 117-24.
9. Colberg, S. R.,, Hernandez, M. J. and Shahzad, F.2013. Blood glucose responses to type, intensity, duration, and timing of exercise. Diabetes Care.;36(10): e177.
10.Thompson, P. D., Crouse, S. F., Goodpaster, B. et al.2001. The acute versus the chronic
response to exercise. Med Sci Sports
Exerc.;33(6 Suppl): S438–S445.
11.Lima, F. D., Oliveira, R. J., Correia, A.L.M., et al.2015 Glicemic and blood lactate response to maximal incremental treadmill test. Int J Sports Sci.;5(2): 59–64.
12.Brooks, G.A., Wolfel, E.E, Butterfield, G. E, et al.1998. Poor relationship between arterial [lactate] and leg net release during exercise at 4,300 m altitude. Am J Physiol. 275(4 Pt 2): R1192–R1201.
13.Romijn, J.A., Coyle, E.F., Sidossis, L.S., et al.1993. Regulation of endogenous fat and carbohydrate metabolism in relation to exercise intensity and duration. Am JPhysiol.
265(3 Pt 1): E380–E391
14.Bahr, R., Hansson, P., Sejersted, O.1990.M. Triglyceride/fatty acid cycling is increased after exercise. Metabolism.39 (9): 993–999. Shimada, K., Yamamoto, Y., Iwayama, K., et al.2013. Effects of post-absorptive and postprandial exercise on 24 h fat oxidation. Metabolism. 62(6): 793–800.
15.Gill, J.M., Al-Mamari, A., Ferrell, W. R., et al.2006. Effects of a moderate exercise
session on postprandial lipoproteins,
apolipoproteins and lipoprotein remnants in middle-aged men. Atherosclerosis. 185(1): 87–96.