Correspondence author: [email protected]
REPRODUCIBILITY AND EFFECT OF DELAYED READOUT ON LiF:
Mg, Ti TLD TREATED WITH DIFFERENT PREHEAT TIME
TECHNIQUES: A GLOW CURVE STUDY
M. Fahmi M. Yusof, Nornashriah A. Rashid and Reduan Abdullah
School of Health Sciences, Universiti Sains Malaysia, 16150 Kota Bharu, Kelantan, Malaysia ABSTRACT
The glow curve in TLD-100 was compared by applying long preheat time, short preheat time techniques and without preheat technique before the TLD readout. Fading effect of the TLD signal upon certain storage time with long preheat time (100°C, 10 minutes using the oven) and short preheat time techniques (100°C, 10 seconds using the reader) were also studied. 15 TLD-100 chips were used with 3 of the TLD chips were used for measuring background radiation. 12 TLD chips were annealed, irradiated, preheated long and short preheat time techniques) and analyzed. The TL signals output from TLD chips of without preheated were used as the control. Two sets of data were taken using TLD chips irradiated with 6 MV and 10 MV photon beams. TL signal output was recorded the highest for short preheat time, followed by long preheat time and no preheating. The TL signal loss upon certain storage time was also reduced when short preheat time technique was applied. By applying long preheat time technique the low temperature peak in the glow curve was completely removed for both energies. Whereas, TLD chips exposed to 6 MV and with short preheat time technique the low temperature peak did not disappear completely but decreased in intensity as compared to the control data by 19.80%, 37.69%, 48.19% and 100% at 24, 48, 72 and 96 hours after exposure prior to readout, respectively. Meanwhile, for 10 MV photon beam with short preheat time, the small peak intensity was reduced by 19.58% for readout at 24 hours after irradiation and 100% for 48,72 and 96 hours delayed time prior to readout. It was observed that the TLD-100 was highly dependent on preheat heating time before readout. Short preheat time technique was able to reduce post irradiation fading of TLD-100 dosimeters.
Keywords: preheat time techniques, TLD-100, TL Glow Curve.
INTRODUCTION
36
The emitted light is due to release electrons or holes trapped in impurities in the crystal. The mostly used system is LiF doped with Mg and Ti. The trapped electrons and holes are at various energy levels and hence the emitted light as a function of temperature called “glow curve”. It is a complex curve which usually is supposed to be a convolution of at least four peaks, each one with different activation energy required to release the trapped electrons and consequently emit the light at different temperature ranges. A couple of these peaks are due to low-energy traps that allow their release even at room temperature. Hence, the integral of the emitted light, represented by the area under the glow curve, reduces with increasing the time elapsed between the irradiation of the TLD crystal and its readout, which is the term used for measuring its glow curve, the light emitted as a function of temperature, or more accurately the rate of heating temperature of the chip. This decrease in the emitted light is named usually as “fading” (Johnson T.L. et al., 1980). Fading has a significant effect on the shape of the TLD-100 standard readout glow curve. The two main fading mechanisms are a release of charge carriers from the shallow traps and migration of charge carriers from deep traps to shallower ones. The fading process is time dependent (A. Abraham et al., 2008) A simple technique can be applied to reduce the annoying pre-irradiation and post-irradiation fading (T. Izak Biran et al., 1996).
METHODOLOGY
Types of LiF TLD detectors used are LiF:Mg,Ti TLD chips (Harshaw TLD-100, Bacron, USA). TLD-100 is a lithium fluoride doped with magnesium and titanium having dose dependence up to 100 MGy and is approximately tissue equivalent.
Siemens Primus Version 7 LINAC (S/N: 3347) with nominal energy 6 MV photon comprises of a drive stand, gantry (treatment couch) and console electronic cabinet was used in this study.
PTW-TLDO 1400 TLD oven is used in annealing procedure. It can be programmed to preheat the TLDs for 100°C for 10 minutes (preheat time). It should be brought up to the preselected temperature and allowed to stabilize well before dosimeter insertion.
Harshaw TLD Model 3500 was used for TLD Readout. The Harshaw 3500 operates on WinREMS Software, which runs under Windows® on a separate computer, providing user interface while the reader control the applications software.
A solid water phantom is a material with density close to water and it is used in the measurements of radiation dosimetry.
37
(a) (b)
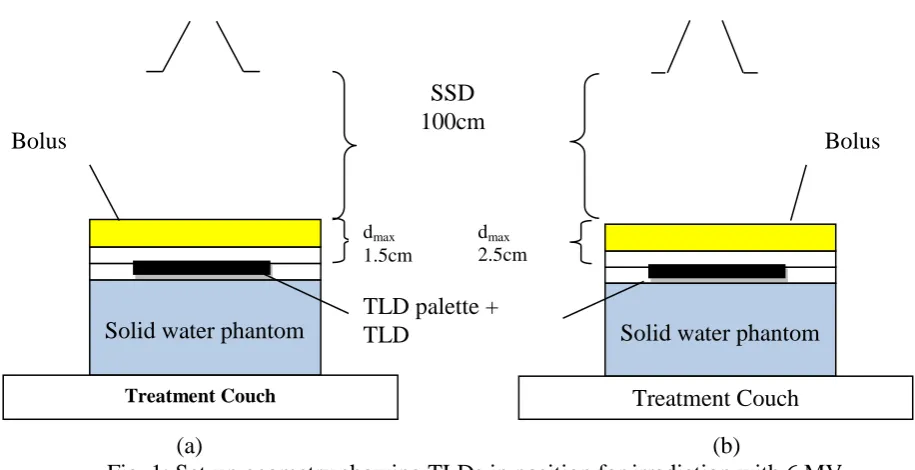
Fig. 1: Set-up geometry showing TLDs in position for irradiation with 6 MV (a) and 10 MV (b) photon beam.
No preheat technique
TLD chips were then been kept in a room at a standard room temperature for 24 hours. The TLDs were then read using the TLD reader with no preheat setup to obtain the TL signal. The procedures were repeated by using 10 MV photon energy. This setting was use as a control in the study.
Long preheat time technique
TLD chips were then been kept in a room with a standard room temperature for 24 hours. TLD chips underwent the preheat using the programmable oven with a temperature of 100°C for 10 minutes just before the TLD readout. The procedures were repeated for 48, 72 and 96 hours post-irradiation before readout. The same procedures were repeated for 10 MV photon energy. The average signal, glow curve and the fading pattern were observed for both photon energies.
Short preheat time technique
TLD chips were then been kept in a room with a standard room temperature for 24 hours. TLD chips underwent the preheat using the TLD reader itself with a temperature of 100°C for 10 seconds followed by TLD readout. The procedures were repeated for 48, 72 and 96 hours post-irradiation before readout. The same procedures were repeated for 10 MV photon energy. The average signal, glow curve and the fading pattern were observed for both photon energies.
RESULTS
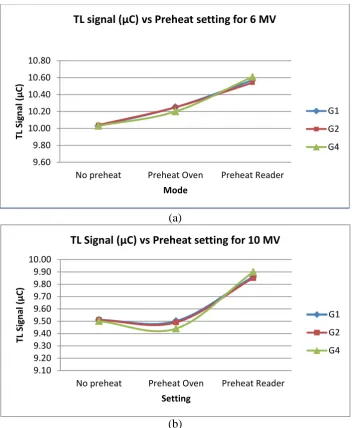
As shown in Fig. 2, TL signal output was recorded highest for both 6 MV (a) and 10 MV (b) photon energies when the TLDs were given high rate preheat technique (using TLD reader) compared to low rate preheat (using TLD Oven) and no preheat.
Solid water phantom
Treatment Couch Bolus
Solid water phantom
Treatment Couch
Bolus SSD
100cm
dmax
2.5cm dmax
1.5cm
38 (a)
(b)
Fig. 2: Graph of average TL signal (µC) versus the preheat mode for TLDs irradiated with 6 MV (a) and 10 MV (b).
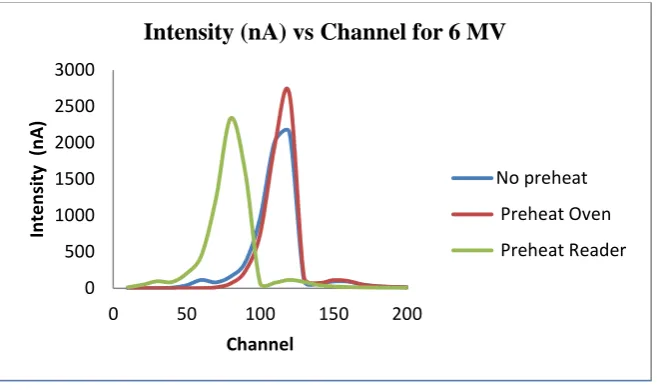
The glow curve of TLD treated with long preheat time technique also having the highest peak as compared to short preheat time and no preheat techniques for 6 MV photon energy as shown in Fig. 3. It is also observed that the small peaks were eliminated for short preheat time. As for 10 MV photon beam in Fig. 4, although the long preheat time technique did not produce the highest glow peak, the elimination of small peaks were also well observed.
9.60 9.80 10.00 10.20 10.40 10.60 10.80
No preheat Preheat Oven Preheat Reader
TL Si
gn
al
(
µ
C)
Mode
TL signal (µC) vs Preheat setting for 6 MV
G1
G2
G4
9.10 9.20 9.30 9.40 9.50 9.60 9.70 9.80 9.90 10.00
No preheat Preheat Oven Preheat Reader
TL Si
gn
al
(
µ
C)
Setting
TL Signal (µC) vs Preheat setting for 10 MV
G1
G2
39
Fig. 3: The glow curves with different preheat time techniques for TLDs exposed with 6 MV photon.
Fig. 4: The glow curves with different preheat time techniques for TLD chips exposed with 6 MV photon.
Table 1 shows the post-irradiation fading of the TLDs. It was noticeable that the TL signal was improved when short preheat time technique was used. The TL signal with both preheat time techniques was compared with the TL signal from the control group and thus gave the percentage difference which indicates amount of fading signal on TLD with delayed of reading time.
0 500 1000 1500 2000 2500 3000
0 50 100 150 200
In
te
n
si
ty
(n
A
)
Channel
Intensity (nA) vs Channel for 6 MV
No preheat
Preheat Oven
Preheat Reader
0 500 1000 1500 2000 2500 3000
0 50 100 150 200
In
te
n
si
ty (n
A
)
Channel
Intensity (nA) vs Channel for 10 MV
No Preheat
Preheat Oven
40
Table 1: Percentage TL signal output increased (positive percentage) and decreased (negative percentage) with different readout times for both energies.
Energy Delayed time of reading (hours)
Oven Preheat Preheat Reader TL Signal
(µC)
% Difference
TL Signal
(µC) % Difference
24 10.24 2.09 10.57 5.38
48 10.07 0.40 10.20 1.69
6 MV 72 9.80 -2.29 10.14 1.10
96 9.73 -2.99 10.21 1.79
24 9.48 -0.32 9.87 3.79
48 9.02 -5.15 9.33 -1.89
10 MV 72 9.12 -4.10 9.37 -1.47
96 8.98 -5.57 9.23 -2.94
The percentage of low temperature peak reduction for all preheat techniques at both 6 MV and 10 MV photon is shown in Table 2. It is observed that both long and short preheat techniques resulted significant reduction of low temperature peaks on the TL Glow Curves.
Table 2: Percentage reduction of TL low temperature peaks.
Preheat Oven Preheat Reader
Energy Delayed time of reading (hours)
Intensity small peak
(nA)
% small peak reduction
Intensity small peak
(nA)
% small peak reduction
24 0.00 100.00 89.89 19.80
48 0.00 100.00 61.29 37.69
6 MV 72 0.00 100.00 53.37 48.19
96 0.00 100.00 0.00 100.00
24 0.00 100.00 65.94 19.58
48 0.00 100.00 0.00 100.00
10 MV 72 0.00 100.00 0.00 100.00
96 0.00 100.00 0.00 100.00
DISCUSSIONS
In average, the TL signal output was expected to be the highest when short preheat time technique was applied, followed by long preheat time technique and without preheat time. This expectation was fulfilled when 6 MV photon beam was used and was in agreement with the result reported by
41
It was clearly showed that preheat applied time influenced the peak of the glow curve. The TLD peak intensity was at the lowest value when there was no preheat compared to the applied preheated techniques before readout as shown in Figure 3. The highest peak found at the short preheat time technique (using the reader) followed by the long preheat time technique (using the programmable oven). The peak intensity of the glow curve was dependant on the period of preheating time, however, for 10 MV photon in Figure 4, the highest peak intensity was not achieved with short preheat time technique. This phenomenon was due to the preheat time applied was not long enough to remove the peak 1 (low temperature peak) of the glow curve. In the previous study conducted by
H.Stadtmann, C.Hranitzky, N.Brasik and T.Izak Biran, S.Malchi, Y.Shamai Z.B.Alfassi, 30°C/s of heating rate was used whereas only 10°C/s heating rate was used in this study (T. Izak Biran et al., 1996). However, both energies of 6 MV and 10 MV agreed that the low temperature peak intensities were eliminated using short preheat time technique.
Another observation that can be seen was the shift of glow curve peak towards the left of the graph when the short preheat time technique was used. This trend is similar to the previous study conducted by T.Izak Biran, S.Malchi, Y.Shamai and Z.B.Alfassi but there was no scientific explanation given. The result obtained was different with the result reported by H.Stadtmann, C.Hranitzky and N.Brasik as their study reported that the glow curve had the temperature shift towards the right of the graph as the detector thickness and the heating rate were increased (H. Stadtmann et al., 2006).
It can be seen that for TLD chips exposed with 6 MV and 10 MV photon beam, the TL signal output was decreasing when it was read at delayed time of reading after 48, 72 and 96 hours. However, TLD chips exposed with 10 MV photon beam had a higher percentage of the TL signal reduced which was in the range of 0.32-5.57% while for TLD chips exposed with 6 MV photon beam had the TL signal loss in the range of 2.29-2.99%. This pattern changed when rate short preheat time technique was used as for the TLD chips exposed with 6 MV photon beam, the TL signal on the first day of reading (after 24 hours) gave 5.38% higher value to compared with the one that was not treated with preheat technique. The TL signal read after 48, 72 and 96 hours after exposure was also increased by 1.69%, 1.10% and 1.79% respectively. Whereas TLD chips exposed with 10 MV photon and treated with short preheat time technique having the TL signal increased by 3.79% on the first day after exposure (24 hours) but it was decreasing rapidly to 1.89%, 1.47% and 2.94% for 48, 72 and 96 hours delayed time respectively before readout. Therefore, the short preheat time technique seems to be able to reduce the post irradiation fading of the TLD dosimeter, TLD-100.
CONCLUSION
42
ACKNOWLEDGEMENT
Authors would like to express their gratitude to the Oncology, Radiotherapy and Nuclear Medicine Department, Hospital Universiti Sains Malaysia (HUSM) for having provided equipment support for this work.
REFERENCES
Abraham A., Weinstein M., German U., Alfassi Z.B, and Machlev Z. (2008). Reassessment of doses in TLD-100 after long storage times. Radiation Measurements. Vol. 43, 802-804.
Beerten, K., Woda, C., Vanhavere, F., (2009). Thermoluminescence dosimetry of electronic components from personal objects. Radiat. Meas.Vol. 44, 620–625
Ben-Shachar, B., Horowitz, Y.S., (1991). Anomalous thermally induced fading of annealed and unannealed LiF:Mg, Ti (TLD-100, Harshaw) using computerized glow curve deconvolution. J. Phys. D. Vol. 24, 1649–1657.
Biran T.I, Malchi S., Shamai and Alfassi Z. (1996). Low pre and post irradiation fading of LiF:Mg,Ti (TLD-100,TLD-600,TLD-700) using a preheat technique. Radiation Protection Dosimetry. Vol.64, No.4,pp. 269-274.
Bos, A., (2006). Theory of thermoluminescence. Radiat. Meas. 41 (Suppl. 1), S45–S56
Bos A.J.J., Vijverberg R.N.M., Piters T.M., McKeever S.W.S. (1995). Effects of cooling and heating rate on trapping parameters in LiF: Mg, Ti crystals J. Phys. D: Appl. Phys. Vol. 25, 1249-1257.
Doremus, S.W., Higgins, G.A., (1994). Pre-irradiation fade and post-irradiation fade for LiF:Mg, Ti, TLD-600 and TLD-700, as a function of time. Radiat. Prot. Dosim. Vol. 54, 119–125.
Fuksa E., Horowitza Y., Osterb L. (2008). Investigation of the properties of composite glow peak 5 in slow cooled TLD-100. Radiation Measurements 43. 249-253.
Furetta, C., (2010). Handbook of Thermoluminescence second ed. World Scientific, Singapore.
Harvey J.A. and Kearfott K.J. (2011). Effects of high ambient temperature on glow peak fading properties of LiF:Mg,Ti Thermoluminescent dosimeters. Radiation Protection Dosimetry. pp. 1-7.
Horowitz, Y.S., (1990). Fading in LiF:Mg, Ti. Radiat. Prot. Dosim.Vol. 32, 147.
Izewska, J. Dietmar G., Bera, P. Thwaites, D. Arib, M. Saravi, M. Sergieva, K. Li, K. Garcia, F., Kumar, A. Bulski, M.. (2007). A methodology for TLD postal dosimetry audit of high-energy radiotherapy photon beams in non-reference conditions. Radiotherapy and Oncology. Vol. 84, 67– 74.
43
Johnson, T.L., Luersen, R.B., (1980). Fading of unannealed LiF (TLD-600) for thermal neutrons and gamma rays. Health Phys.Vol. 38, 853–856.
Kos H.J., Nink R. (1980). New method for the optimization of thermoluminescence sensitivity in LiF:Mg,Ti. Phys. Stat. Sol. (a) Vol. 57, 203.
Landreth J.L., McKeever S.W.S. (1985). 5.5 eV optical absorption, supralinearity, and sensitization of thermoluminescence in LiF TLD‐100. J. Phys. D: Appl. Phys. Vol 18, 1919.
McKeever, S.W.S (1985). Thermoluminescence of Solids. Cambridge Universiti Press, Cambridge.
Pp. 1-376.
McKeever S.W.S., Moscovitch M., Townsend P.D. (1995). Thermoluminescence Dosimetry Materials: Properties and Uses. Nuclear Technology Publishing.
Mobit P.N., Maylesy P. and Nahum A. E. (1996). The quality dependence of LiF TLD in megavoltage photon beams: Monte Carlo simulation and experiments. Phys.Med. Biol 41, 387-398.
Moscovitch, M., Horowitz, Y., (2006). Thermoluminescent materials for medical applications: LIF:Mg,Ti and LiF:Mg,Cu,P. Radiat. Meas. Vol. 41, S71–S77
Salah N., (2011). Nanocrystalline materials for the dosimetry of heavy charged particles: a review.
Radiat. Phys. Chem. 80, 1–10
Taylor G.C, Lilley E., (1982) Photoluminescence and thermoluminescence of Ti centers in LiF (TLD‐100). J. Phys. D: Appl. Phys. Vol. 15, 1243.
Teixeira M.A., Ferraz G.M., Caldas L.V.A., (2008) b. Descalvado sand for high-dose dosimetry.
Radiat. Meas. Vol. 43, 1163–1165
Straube, U., Berger T.G., Reitz G., Facius R., Fuglesang C., Reiter T., Damann V.,Tognini M., (2010). Operational radiation protection for astronauts and cosmonauts and correlated activities of ESA medical operations. Acta Astronaut. Vol.66, 963–973.
Shachar B.B, and Horowitz Y.S. (1991). Anomalous thermally induced fading of annealed and unannealed LiF:Mg,Ti(TLD-100) using computerized glow curve deconvolution. J Phys. D: Appl. Phys. Vol. 24, 1649.
Stadtmann H., Hranitzky C. and Brasik N. (2006). Study of real time temperature profiles in routine TLD readout-Influences of detector thickness and heating rate on glow curve shape. Radiation Protection Dosimetry. Vol. 119, No. 1-4, pp. 310-313.
Teixeira, I.M., Da Costa, Z., Da Costa, C., Pontuschka, W., Caldas, L., (2008). Study of the gamma radiation response of watch glasses. Radiation Measurements. Vol. 43, 480–482.
Yazici A.N. (2004). The influence of heating rate on the TL response of the main glow peak 5 and 4+5 of sensitized TLD-100 treated by two different annealing protocols. Nuclear Instruments and Methods in Physics Research. B 215 174-180.
44