*Corresponding author: A, Suganthi, E-mail: [email protected]
Asian Journal of Nanoscience and Materials, 2019, 2(2), 228-243.
Development Of Validated Specific Stability-Indicating HPTLC
Method For The Simultaneous Determination Of Ledipasvir And
Sofosbuvir In Fixed Dose Tablet Formulation
a , T K Ravi a
hkumar , S Sathes
a* A Suganthi
a Department of Pharmaceutical Analysis, College of Pharmacy, SRIPMS affiliated to Dr. M.G.R Medical
University, Coimbatore, India.
Received: 11 September 2018, Revised: 24 November 2018 and Accepted: 30 November 2018.
ABSTRACT: A simple, specific, sensitive and rapid stability-indicating high performance thin layer chromatographic method has been developed for the simultaneous estimation of ledipasvir and sofosbuvir in combined dosage form. In this method, the separation was achieved on silica gel 60F254 thin layer chromatography plates using mobile phase comprising of hexane: ethyl acetate: methanol (5:3:2,v/v/v) with 3 drops of ammonia at 288 nm as selected wavelength on a densitometer. The Rf value of sofosbuvir and ledipasvir were observed to be 0.21±0.02 and 0.43±0.02, respectively. The linearity, precision, accuracy, robustness, specificity, limit of detection and limit of quantitation of the method were validated according to the ICH guidelines. The linear regression analysis for calibration plots produced r2=0.9948±0.0005 and r2 = 0.9927±0.0003 for ledipasvir and sofosbuvir, respectively. Percent recovery of the drugs from tablet formulation was carried out by standard addition method and was found to be close to 100 and relative standard deviation was less than 2%, which indicated good accuracy and precision of the method. The factors evaluated in the robustness test were determined to have an insignificant effect on the selected responses. To make the method more specific stress studies were conducted for both drugs individually as well as in the combined form by subjected to acid, alkali and neutral hydrolysis, oxidation, thermal and photolytic degradation. Degradation studies indicated ledipasvir to be susceptible to acid and alkaline hydrolysis, thermal, photolytic and oxidative degradation whereas sofosbuvir was susceptible only to alkaline hydrolysis. The degradation product peaks were well resolved from the pure drug with significant differences in their Rf values. The results indicate that the method is suitable for the routine quality control testing of marketed tablet formulation.
KEYWORDS:Ledipasvir; Sofosbuvir; HPTLC; Stress; ICH guidelines.
GRAPHICAL ABSTRACT:
Suganthi et al. 229
Asian Journal of
Nanoscience and
Materials
Ledipasvir (LPV),chemically methyl N-
[(2S)-1-[(6S)-6-[5-[9,9-difluoro-7-[2-[(1S,2S,4R) -3 -[(2S)
-2-(methoxycarbonylamino)-
3-methylbutanoyl] -3-
azabicyclo[2.2.1]heptan-2-yl]-3H-benz imidazol-5-yl]fluorenyl]-1H-Imidazol -2-yl] -5-azaspiro[2.4]heptan-5--2-yl]-3- methyl-1-oxo butan-2-yl]carbamate (Fig. 1 a), is an orally available inhibitor of the hepatitis C virus (HCV)-non-structural protein 5A (NS5A) replication complex, with potential activity against HCV [1]. Upon oral
administration, and after intracellular
uptake, ledipasvir binds to and blocks the activity of the NS5A protein [2]. This results in the disruption of the viral RNA replication complex, blockage of HCV RNA production, and inhibition of viral replication. NS5A,
a zinc-binding and proline-rich hydrophilic
phosphoprotein, plays a crucial role in HCV RNA replication. HCV is a small, enveloped, single-stranded RNA virus belonging to the family, Flaviviridae; HCV infection is
associated with the development of
hepatocellular carcinoma [3].
Sofosbuvir (SOF), (S)-Isopropyl 2-((S
)-(((2R,3R,4R,5R
)-5-(2,4-dioxo-3,4-dihydropyrimidin-1(2H
)-yl)-4-fluoro-3-
hydroxy-4-methyltetrahydrofuran-2-yl)methoxy)-(phenoxy) phosphoryl amino) propanoate (Fig. 1b), is a prodrug [4]. It is metabolized to the active antiviral agent
GS-461203
(2'-deoxy-2'-α-fluoro-β-C-methyluridine-5'-triphosphate).
GS-461203, serves as a defective substrate for the NS5B protein, which is the viral RNA polymerase, thus acts as an inhibitor of viral
RNA synthesis [3].
LPV is used in combination with SOF for genotype 1 hepatitis C. This LPV-SOF combination is a direct-acting antiviral agent
that interferes with HCV replication, and can be used to treat patients with genotypes 1a or 1b without PEG-interferon or ribavirin [5].
a
b
Fig.1. a) Structure of Ledipasvir , b) Structure of Sofosbuvir
Literature survey revealed that several instrumental methods based on HPLC [6,7], UPESI-MS/MS [8], MS/MS [9], LC-QTOF-MS/MS and NMR[10] were reported for the determination of LPV and SOF as a single component, in bulk formulation, combination with other drugs [11], and human plasma [12,13]. However, for the simultaneous estimation of LPV and SOF, HPLC [14], Chemometric models[15,16], TLC densitometric method [17], LC-MS/MS [18] in plasma and an UV spectroscopy [19] for the analysis of formulation were reported. It is obvious that most of the reported methods for the determination of LPV and
SOF have utilized hyphenated
230 Suganthiet al. Asian Journal of
Nanoscience and
Materials
techniques were considered time consuming and requires high cost as they usually involve several separation steps with the utilization of complex components. On
contrary, the mathematical
spectrophotometric and chemometric
techniques have the ability to overcome the above drawbacks. In addition, they could efficiently resolve complex mixtures of analytes. However, chemometric techniques were less advantageous, as they required the
availability of specific softwares for
performing the manipulation steps.
Except UV spectroscopic method, all the other techniques described, were not cost-effective in terms of solvent consumption and total analysis run time; therefore, the present study was conducted. Moreover, the chemical stability of pharmaceuticals is a matter of great concern, as it affects the safety and efficacy of the drug product. The FDA and ICH guidelines [20, 21] state the requirement of stability testing data to understand how the quality of a drug substance and drug product changes with time under the influence of various environmental factors. Forced degradation was the process that involved degradation of drug products and drug substances at conditions more severe than accelerated conditions and thus generates degradation products that could be studied to determine the stability of the molecule [22]. The aim of the forced degradation is to produce the desired amount of degradation i.e., 5 – 20%. The exhaustive literature survey revealed
that none of the most recognized
pharmacopoeias and journals include these drugs (LPV and SOF) in combination for the simultaneous determination, and information regarding the stability of the drugs is not available in its combination. By keeping this in mind, the effect of hydrolysis (acidic, alkaline and neutral), dry heat, oxidation
using hydrogen peroxide and photolysis were studied on LPV and SOF by developing a validated novel high performance thin layer chromatographic procedure which could effectively separate the drug peaks from those of their degradation products. The advantage of selecting HPTLC technique is that, it is reliable in quantifying analytes at micro and even in nanogram levels. It has proved a very useful technique because of its low operating cost, reduced analysis time, high sample throughput and need for minimum sample clean-up [23]. For the best of our knowledge, no stability indicating
assay method was reported for the
determination of these drugs in formulation. The present investigation was conducted with the goal of establishing a simple, rapid, sensitive and robust stability-indicating HPTLC method for the simultaneous estimation of LPV and SOF and its application to assay of selected drugs in tablet dosage form.
2. Experimental
2.1. Reagents and materials
LPV and SOF (>99.8%) were procured from Analytical Services Laboratory, Sequent Research Limited, Mangalore, India. The
formulation, Cimivir-L tablet (LPV 90/SOF
400) was purchased from local market, Bangalore. Hydrochloric acid (AR grade), hydrogen peroxide (H2O2) (AR grade), hexane (LR grade), ethyl acetate (AR grade), ammonia, methanol (HPLC grade) and sodium hydroxide (NaOH) were purchased from S. D. Fine Chem. Ltd., and Qualigens Fine Chemicals Ltd., Mumbai, India. Precoated silica gel 60F254 on aluminium sheets were procured from Merck, Germany. 2.2. Instrumental and chromatographic condition
The HPTLC analysis was carried out on
Suganthi et al. 231
Asian Journal of
Nanoscience and
Materials
Switzerland) consisting of a TLC Scanner III and a Linomat V auto-application device connected to a nitrogen cylinder. Apart from this, Shimadzu digital electronic balance, hot air oven manufactured by Inlab Equipment, Madras Ltd., and a sonicator manufactured by Leelasonic Ultrasonic sonicator were used for the proposed study.
For the development of chromatogram, pre-washed plates with methanol, after activation at 105°C for 20 min was used. Band width of 6mm with 6mm spacing was applied using a Hamilton microliter syringe and Linomat V sample applicator. The sample application speed was set at 10 mm/sec. The distance from the plate side edge and the bottom of the plate was 10 mm. After the plates were air dried, linear ascending chromatography was carried out using hexane: ethyl acetate : methanol (5:3:2,v/v/v) with 3 drops of ammonia as the mobile phase in a 20 × 10 cm twin-trough glass chamber (CAMAG), which was pre-saturated with mobile phase (for 15 min) at 25 ± 1◦C. The development distance was 8.0 cm, and the development time was 20 min. Densitometric scanning was performed in the absorbance–reflectance mode at 288 nm after scanning between 200 and 400 nm using a deuterium lamp. The slit dimensions were 5 mm in length and 0.45 mm in width, with a scanning rate of 20 mm/sec. Each track was scanned three times, and baseline correction was used. The winCATS software version 1.4.2 (CAMAG) was used to control the operating parameters during the entire experiment.
2.3. Preparation of standard solution
The stock solution of LPV and SOF (1000 μg/ml) were prepared by accurately weighing 100 mg of LPV or SOF, and transferring into two separate 100 ml volumetric flasks. The drugs were dissolved by using an ultrasonic sonicator in 30 ml of methanol for 10 min, and the volume was
made upto the mark using the same solvent. The mixed working standard solution was prepared by accurately transferring 1 ml of LPV and 4 ml of SOF into a 10 ml volumetric flask, and further diluted using methanol to get a final concentration of 100 μg/ml of LPV and 400 μg/ml of SOF.
2.4. Preparation and analysis of sample formulation
To determine the amount of LPV and SOF in tablet dosage form (label claim 90& 400 mg per tablet), 20 tablets were weighed, their average weight was determined, and they were finely powdered. An accurately weighed powder sample equivalent to 9mg of LPV or 40mg of SOF was transferred into a 100ml volumetric flask, and 10ml of methanol was added, followed by sonication for 10 min, and further dilution was made up to the mark with methanol. The resulting solution was filtered through Whatmann filter paper (No.1), and two microliters of the filtered solution (180 ng/spot of LPV and 800 ng/spot of SOF) was applied on the TLC plate, followed by development and scanning
as per optimized chromatographic
conditions.
2.5. Validation [24]
The developed method was validated as per ICH guidelines. The validation of the method was carried out in terms of linearity, accuracy, precision, repeatability, LOD and LOQ.
2.5.1. Linearity
232 Suganthiet al. Asian Journal of
Nanoscience and
Materials
solution, from 1 to 7 µL on TLC plate.
Calibration curves for the different
concentrations versus the peak area were plotted for LPV and SOF, and the obtained data were subjected to regression analysis using the least squares method.
2.5.2. Limit of Detection and Limit of Quantification
The lowest concentration detected (LOD) and the lowest concentration quantified (LOQ) were estimated from a set of six calibration curves, previously used to determine the method linearity. LOD = 3.3×σ/S and LOQ = 10×σ/S, where, σ= the standard deviation of y intercepts of regression lines and S = the slope of the calibration curve.
2.5.3. Precision
The intra-day precision was evaluated by analyzing six sample solutions (n =6), with the final concentration of analyses 200 and 400 ng/spot of LPV and 880 and 1760 ng/spot of SOF. Similarly, the inter-day precision was evaluated in three consecutive days (n =18). Instrumental precision was determined by measuring the repeated scanning for six times, and the repeatability of the developed method was confirmed by applying LPV and SOF (200 and 880 ng/spot) six times on the TLC plate. After scanning, the peak area was measured, and the relative standard deviations (RSD) were calculated.
2.5.4. Accuracy
LPV and SOF reference standards were accurately weighed and added to a commercial formulation of tablet powder, at three different concentration levels (50, 100 and 150 % LPV and SOF respectively). At each level, samples were prepared in triplicate, and the recovery percentage was determined.
2.5.5. Specificity
The peak purity of LPV and SOF was
assessed by comparing its respective spectra at three different levels, that is, peak start (S), peak apex (M) and peak end (E) positions of the spot. In addition, a solution containing a mixture of the tablet excipients was prepared using the sample preparation procedure and applied onto the TLC plate, to evaluate the possible interfering peaks.
2.5.6. Robustness
The effect of small deliberate variations on the method parameters like, the composition of the mobile phase, saturation time, development distance, spot scanning, time interval, wavelength scan time from spotting to chromatography and mobile phase volume, was evaluated for the concentration of 200 and 880 ng/spot of LPV and SOF respectively, and the data obtained was subjected to statistical analysis.
2.5.7. Stability studies of drugs on the plate
When the developed chromatographic plate is exposed to atmosphere, the analytes are likely to decompose. Hence it is necessary to study the stability of the drug on plate, which is done by scanning the plate at different time intervals, and the peak areas obtained were compared with that of a freshly scanned plate. Thus, the developed plate was found to be stable for about 24 hours.
3. Stress studies [22]
For conducting the forced degradation studies, four samples were taken viz., blank solution stored under normal conditions, blank solution subjected to stress conditions similar to that of the drug solution, zero time analyte solution stored under normal conditions and the sample subjected to stress
treatment. The study was conducted
Suganthi et al. 233
Asian Journal of
Nanoscience and
Materials
100 mg of LPV and SOF were weighed accurately and transferred to a 25 ml standard flask or a petri-dish separately.
3.1. Acid, alkaline, neutral hydrolysis
For acid hydrolysis, 10 ml of 0.1M hydrochloric acid was added to the
corresponding sample of LPV and SOF. For
alkaline hydrolysis, 0.1M sodium hydroxide was added, whereas for neutral hydrolysis, 10 ml water was used. After making up the volume to 25 ml in a corresponding standard flask with methanol, each solution was refluxed for 5 hours at 80˚C. From the resultant solution, 2.5 ml was taken, and again made up to 10ml in a standard flask to get 1000µg/ml for LPV and SOF.
3.2. Oxidative Degradation
This study was carried out by using10 ml of
6% hydrogen peroxide, made up to 25ml with methanol. From this, 2.5 ml was withdrawn every 1 hour for about 5 hours and made up to 10ml (1000µg/ml) for LPV and SOF.
3.3. Thermal and photolytic degradation
For thermal degradation, the drugs were placed in hot air oven at 80ºC for 5 hours; whereas for photolysis, the drugs placed in petri-dish were exposed to sunlight for about 5 hours. After exposure, the drugs were dissolved in methanol and made up to 25 ml. Further, 2.5 ml of this solution was transferred to a 10 ml standard flask, and the volume was made up with methanol to get 1000µg/ml for LPV and SOF, respectively.
4. Results and Discussion
4.1. Method development
In this method, methanol was selected as the solvent, because it completely dissolves the drugs, and showed good stability in solution form, with acceptable volatile nature. An ideal wavelength is the one that gives good response with maximum absorbance for both the drugs to be detected. The spectra were recorded for LPV and SOF on TLC scanner and the isobestic point, 288nm was selected for the entire study.
4.1.1. Optimization of chromatographic condition
For chromatographic elution of LPV and SOF, several trials were carried out using
toluene, n-hexane, ethyl acetate, chloroform,
dichloromethane, acetonitrile and methanol, as single mobile phase solvents or their binary and tertiary combinations. Initial experiments with single solvents revealed poor separation or migration along the solvent front or negligible migration of LPV/SOF. In toluene: ethanol (7:3,v/v) and toluene: acetonitrile (6:2,v/v/v), there was no separation; In toluene: ethyl acetate (7:3,v/v), no development of spot; Toluene: butyl
acetate: methanol (7:2:1,v/v/v), poor
separation, while good separation occurs when hexane: ethyl acetate: methanol (5:3:2v/v/v) was used as mobile phase system. Hence the optimization of the mobile phase was performed using this combination of solvents. After separation, the shape of the peaks were improved using 3 drops of
ammonia solution. The Rf values under the
234 Suganthiet al. Asian Journal of
Nanoscience and
Materials
Fig. 2. Standard chromatogram of Ledipasvir & Sofosbuvir.
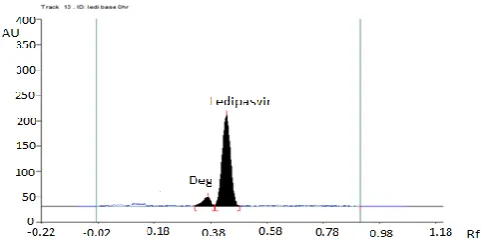
Fig 3a. Chromatogram of acid hydrolysis of Ledipasvir
Suganthi et al. 235
Asian Journal of
Nanoscience and
Materials
Fig. 3c. Chromatogram of neutral hydrolysis of Ledipasvir
Fig. 3d. Chromatogram of oxidative degradation of Ledipasvir
236 Suganthiet al. Asian Journal of
Nanoscience and
Materials
Fig. 3f. Chromatogram of thermal degradation of Ledipasvir.
Fig. 4a. Chromatogram of acid hydrolysis of Sofosbuvir.
Suganthi et al. 237
Asian Journal of
Nanoscience and
Materials
Fig. 4c. Chromatogram of neutral hydrolysis of Sofosbuvir.
Fig. 4d. Chromatogram of oxidative degradation of Sofosbuvir.
238 Suganthiet al. Asian Journal of
Nanoscience and
Materials
Fig. 4f. Chromatogram of thermal degradation of Sofosbuvir.
Fig. 5. Chromatogram of stress treated mixture of Ledipasvir and Sofosbuvir.
4.2. Validation
The high correlation coefficient obtained from linear regression analysis showed good linear relationship over the concentration range of LPV 100-700 ng/spot and SOF 440-
3080 ng/spot for six sets of data. The results are given in table 1. The LOD and LOQ for the analytes were calculated from the slope of the calibration line and the standard deviation of the intercept and were found to be 0.13 and 0.40 ng/spot (LPV) and 0.4345 and 1.316 ng/spot (SOF), respectively.
Suganthi et al. 239
Asian Journal of
Nanoscience and
Materials
Table 1. Calibration graph data for LPV and SOF
*Relative Standard Deviation (n=6), LPV=Ledipasvir, SOF=Sofosbuvir
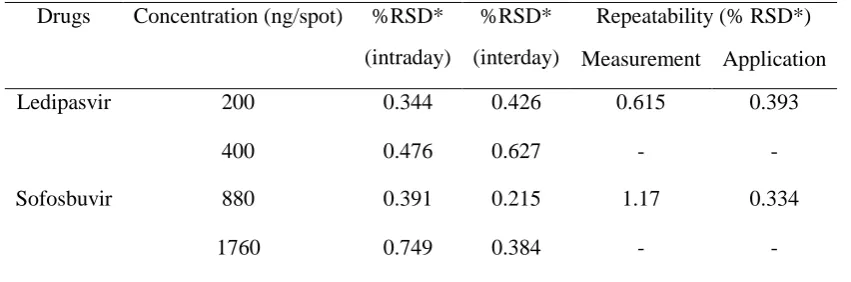
The precision parameters expressed as %RSD for method precision of intra-day, interday, repeatability of sample application and measurement are presented in Table 2. The accuracy was determined by a standard addition technique, and the detailed results are shown in Table 3. The peak purity index at the peak start, peak apex and peak end was determined, and was found to be about 0.9997 and 0.9999 for LPV and 0.9995 and 0.9998 for SOF respectively. This proves high specificity of the developed method.
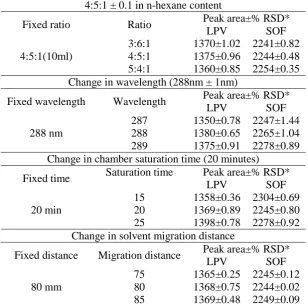
Method robustness was tested under four
different conditions by changing the
composition and volume of the mobile phase components of hexane (±0.1 mL for each), by changing the chamber saturation time
(±5.0 min) and solvent migration distance (±5.0 mm) to chromatography. The results present in Table 4 established that, alteration of the analytical conditions does not affect the performance of the method significantly, as evident from the precision values in the measurement of peak area of the analytes. This confirms the robustness of the developed method.
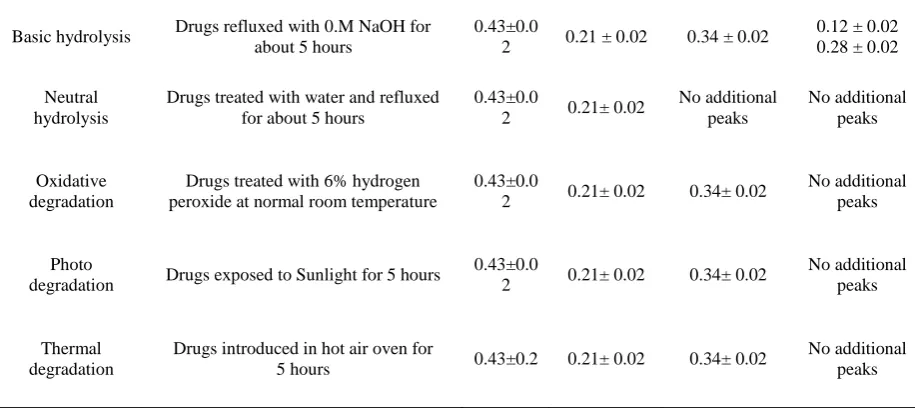
The Table 5 demonstrates the results of forced degradation studies of LPV and SOF combination. On conducting stress studies, the peak area of LPV did not change for neutral hydrolysis, whereas considerable reduction in peak area occurs with the appearance of an additional peak at the retention time 0.34 min apart from drug peak at 0.43 for other stress studies. This confirmed that LPV was more susceptible to acid, alkaline, oxidative, dry heat and photolytic degradation conditions; whereas for SOF, there was a considerable reduction in peak area with the appearance of additional peaks at 0.12 and 0.28 min. apart from the drug peak at 0.21min by base treatment. This indicated that SOF was highly susceptible to alkaline hydrolysis only.
Table 2. Precision data of intra-day, inter-day and repeatability studies for simultaneous determination of LPV and SOF by HPTLC method.
Drugs Concentration (ng/spot) %RSD* (intraday)
%RSD* (interday)
Repeatability (% RSD*) Measurement Application
Ledipasvir 200 0.344 0.426 0.615 0.393
400 0.476 0.627 - -
Sofosbuvir 880 0.391 0.215 1.17 0.334
1760 0.749 0.384 - -
*Relative standard deviation (n=6), LPV=Ledipasvir, SOF=Sofosbuvir. Linear
regression Parameters
LPV±%RSD* SOF±%RSD*
Slope 4.847±0.0004 1.461±0.0016 Intercept 349.9±0.1941 870.4±0.1924 Correlation
coefficient 0.9948±0.0010 0.992±0.0003 Number of
240 Suganthiet al. Asian Journal of
Nanoscience and
Materials
Table 3. Recovery data for standard solutions added to the samples analyzed by HPTLC method
Level %Recovery (LPV)
%Recovery (SOF)
%RSD* (LPV)
%RSD* (SOF)
50% 99.41 100.25 0.25 0.45
100% 98.25 101.85 0.52 0.89 150% 101.84 100.89 1.24 0.21
*Relative standard deviation (n=6), LPV=Ledipasvir, SOF=Sofosbuvir
Table 4. Robustness evaluation ( LPV 200 ng/spot and SOF 440 ng/spot) by HPTLC.
Change in the mobile phase ratio (n-hexane:ethylacetate:methanol) 4:5:1 ± 0.1 in n-hexane content
Fixed ratio Ratio Peak area±% RSD*
LPV SOF
4:5:1(10ml)
3:6:1 1370±1.02 2241±0.82 4:5:1 1375±0.96 2244±0.48 5:4:1 1360±0.85 2254±0.35 Change in wavelength (288nm ± 1nm)
Fixed wavelength Wavelength Peak area±% RSD*
LPV SOF
288 nm
287 1350±0.78 2247±1.44 288 1380±0.65 2265±1.04 289 1375±0.91 2278±0.89 Change in chamber saturation time (20 minutes)
Fixed time Saturation time Peak area±% RSD*
LPV SOF
20 min
15 1358±0.36 2304±0.69 20 1369±0.89 2245±0.80 25 1398±0.78 2278±0.92 Change in solvent migration distance
Fixed distance Migration distance Peak area±% RSD*
LPV SOF
80 mm
75 1365±0.25 2245±0.12 80 1368±0.75 2244±0.02 85 1369±0.48 2249±0.09
*Relative standard deviation (n=6), LPV=Ledipasvir, SOF=Sofosbuvir
Table 5. Conditions and results of forced degradation studies
Type of stress Stress condition
Rf value
Ledipas
vir Sofosbuvir LPV DP* SOF DP**
Acid hydrolysis Drugs refluxed with 0.1M HCl for about 5 hours
0.43±0.0
2 0.21 ± 0.02 0.34 ± 0.02
Suganthi et al. 241
Asian Journal of
Nanoscience and
Materials
Basic hydrolysis Drugs refluxed with 0.M NaOH for about 5 hours
0.43±0.0
2 0.21 ± 0.02 0.34 ± 0.02
0.12 ± 0.02 0.28 ± 0.02
Neutral hydrolysis
Drugs treated with water and refluxed for about 5 hours
0.43±0.0
2 0.21± 0.02
No additional peaks No additional peaks Oxidative degradation
Drugs treated with 6% hydrogen peroxide at normal room temperature
0.43±0.0
2 0.21± 0.02 0.34± 0.02
No additional peaks
Photo
degradation Drugs exposed to Sunlight for 5 hours
0.43±0.0
2 0.21± 0.02 0.34± 0.02
No additional peaks
Thermal degradation
Drugs introduced in hot air oven for
5 hours 0.43±0.2 0.21± 0.02 0.34± 0.02
No additional peaks
*DP=Degradation product.
Table 6. Results of commercial formulation analysis
*Relative standard deviation (n=6), Cimivir-L is the brand name for ledipasvir and sofosbuvir combination in tablet form. LPV = ledipasvir and SOF = sofosbuvir, respectively.
The corresponding chromatograms were
given in Fig. 3a-f and 4a-f and
Chromatogram of stress treated mixture of LPV and SOF are shown in Fig. 5 which proved that the stability indicating power of the developed HPTLC method.
Finally, the method was applied to analyze a commercially available tablet formulation. The results are tabulated in Table 6. The result of analysis proves that the developed stability indicating method is suitable for the analysis of LPV and SOF, without any interference from the excipients.
5. Conclusion
A specific, sensitive and robust
stability-indicating HPTLC method has been
developed for the simultaneous
determination of LPV and SOF in tablet formulation, and their stress studies were established by following ICH guidelines. This is possibly the first stability-indicating method for the simultaneous estimation of the selected drug combination in tablet dosage form using HPTLC technique. Further, the statistical analysis proved that the method could be suitable for analyzing LPV and SOF in their pure form and in pharmaceutical preparations, without any interference from the excipients. The validation data suggested that the proposed densitometric HPTLC method is accurate, precise, less time consuming and cost effective. Hence it could be readily applied for routine quality control analysis of these drugs in combination.
Acknowledgement
The authors are thankful to the SNR Sons charitable trust for providing adequate facilities to carry out this work.
References
1. National Center for Biotechnology
Information. PubChem Compound
Database; CID=67505836,https://pubchem.ncbi.n Drug Name (Cimivir-L)
Amount found (mg/tab)
% Label claim ±RSD* Labelled Estimated
LPV 90 91.45 101.61±0.25
242 Suganthiet al. Asian Journal of
Nanoscience and
Materials
lm.nih.gov/compound/67505836 (accessed Apr. 10, 2018). Ledipasvir structure
2. Pol, S., Vallet-Pichard, A., and
Corouge, M. (2016)
Daclatasvir-sofosbuvir combination therapy with or without ribavirin for hepatitis C virus infection: from the clinical trials
to real life. Hepatic Medicine:
Evidence and Research. 8: 21–26. 3. Fung, A., Jin, Z., Dyatkina, N., Wang,
G., Beigelman, L., and Deval, J.
(2014). Antimicrobial Agents and
Chemotherapy. 58: 3636-3645.
4. National Center for Biotechnology
Information. PubChem Compound
Database;CID=45375808,https://pubch em.ncbi.nlm.nih.gov/compound/45375
808 (accessed Apr. 10, 2018).
Sofosbuvir structure
5. Afdhal, N., Zeuzem, S., Kwo, P., Chojkier, M., Gitlin, N., Puoti, M., Romero-Gomez, M., Zarski, J. P., Agarwal, K., Buggisch, P., Foster, G.R., Bräu, N., Buti, M., Jacobson, I. M., Subramanian, G.M., Ding, X., Mo, H., Yang, J.C., Pang, P.S., Symonds, W. T., McHutchison, J. G., Muir, A. J., Mangia, A., and Marcellin, P. (2014). N Engl J Med. 370: 1889–1898.
6. Mohan Vikas, P., Satyanarayana, T., Vinod Kumar, D., Mounika, E., Sri Latha, M., Anusha, R., and Sathish, Y.
(2016) J. Global Trends Pharm. Sci. 7:
3013-3015.
7. Devilal, J., Durgaprasad, B., Pal, N.,
and Avanapu, S. R. (2016) WJPPS. 6:
1312-1321.
8. Rezk, M., Basalious, E., and Karim, A.
I. (2015) J. Pharmaceut. Biomed. Anal.
DOI: 10.1016/j.jpba.2015.05.006.
9. Nebsen, M., and Eman, S. E. (2016) J.
Chromatogra. Sci. 54: 1631–1640.
10.Debasish, S., and Gananadhamu, S.
(2017) J. Pharmaceut. Biomed. Anal.
138: 29-42.
11.Amira, S., Eldin, S. M., Azab, A. S.,
and Magda El-Maamly. (2017)
Antiviral drugs. J. Pharm. Pharmacol. Res. 1: 028-042.
12.Nehal, F. F., and Nada, A.W.S. (2017).
J of liquid chromatography and related technologies. 327-332.
13.Madhavi, S., and Prameela R. A.
(2017). Int. J. Pharm. Pharmaceut. Sci. 9: 35-41.
14.Bakht, Z., Faisal, S., and Waseem,
Hassan. (2016). Chromatographia. 79:
1605–1613.
15.Mahsa, K., Mahmoud, R. S., Vahid,
M., and Nahid, T. Z. (2018).
Spectrochimica Acta Part A: Molecular and Biomolecular Spectroscopy. 194: 141-151.
16.Fathy, M. S., Khalid, A. A., Ahmed, A.
A., Ahmed El-Olemy., and Ebrahim,
A. (2017). J. Adv. Pharmacy Res. 1:
185-192.
17.Fathy, M. S., Khalid, A. A., Ahmed, A.
A., Ahmed El-Olemy., and Ebrahim,
A. (2017). Anal. Che. Lett. 7: 241-247.
18.Elkady, E. F., and Aboelwafa, A. A.
(2016). Int. J. AOAC. 99: 1252-1259.
19.Sherif Abdel‐ Naby Abdel‐ Gawad.
(2017). Eur. J. Chem. 8: 8‐ 12.
20.Guidance for Industry, Analytical
Procedures and Methods Validation,
Chemistry, Manufacturing, and
Controls Documentation, Draft
Guidance, U.S. Department of Health and Human Services, Food and Drug
Administration, Center for Drug
Suganthi et al. 243
Asian Journal of
Nanoscience and
Materials
21.ICH Harmonised Tripartite Guideline
Stability Testing of New Drug
Substances and Products Q1A(R2), Current Step 4 version, dated 6 February 2003.
22.Monika. B., and Singh, S. J., (2002). Biomed. Anal. 28: 1011–1040.
23.Sethi, P. D., 1997. HPTLC Quantitative
Analysis of drug in pharmaceutical
formulation, third ed. New Delhi: CBS Publishers and Distributors, pp. 1-56.
24.ICH Harmonised Tripartite Guideline,
Validation Of Analytical Procedures:
Text and Methodology, Q2(R1),
Current Step 4 version, Parent
Guideline dated 27 October 1994,
(Complementary Guideline on
Methodology dated 6 November 1996 incorporated in November 2005).
How to cite this manuscript:A Suganthi*, S Satheshkumar, T K Ravi.Development Of Validated Specific Stability-Indicating HPTLC Method For The Simultaneous Determination Of Ledipasvir And Sofosbuvir In Fixed Dose Tablet Formulation. Asian
Journal of Nanoscience and Materials, 2019, 2(2), 228-243. DOI: