© Penerbit UTHM
DOI: https://doi.org/10.30880/ijie.2018.10.03.016
*Corresponding author : [email protected] 2018 UTHM Publisher : All right reserved.
Penerbit.uthm.edu.my/ojs/index.php/ijie
Optimization of EMI shielding effectiveness plaster mortar
containing POFA using Taguchi design and Flower Pollination
algorithm method
O L C Narong
1, *, C K Sia
1, S K Yee
3, P Ong
2, A Zainudin
1, N H M Nor
1and M F Hassan
11
Department of Engineering Design and Materials, University of Tun Hussein Onn Malaysia, Parit Raja 86400, Batu Pahat, Johor, Malaysia
2Department of Mechanic Engineering, University of Tun Hussein Onn Malaysia, Parit Raja 86400, Batu Pahat, Johor,
Malaysia
3Research Centre for Applied Electromagnetic, Faculty of Electrical and Electronic Engineering, University Tun
Hussein Onn Malaysia, Parit Raja 86400, Batu Pahat, Johor, Malaysia
Received 7 January 2018; accepted 23 January 2018, available online 3 July 2018
1.
Introduction
In recent times, most of the advance technologies in electrical and electronic devices, especially the wireless and communication systems are polluted by electromagnetic wave (EMW) radiation, which can be harmful to health and may cause of death [1–3]. In order to deal with EMW radiation issue, POFA was used as cement replacement for mitigate the EMW in plastering work. Cement-based composite electromagnetic (EM) absorbing materials, with the advantage of rich resources, with good environmental adaptability and low cost, have being one of the famed research focuses [4–7]. The conventional plaster cement-based composite is containing three main components; Ordinary Portland cement (OPC), sand and water. Usually, the mortar for plastering work was prepared with 1:3 fixed binder-to-sand ratio [8].
The current study stated that EMI shielding in building have been shielded by carbon filling cement materials and metal filling cement composite [9]. The
carbon filling materials consist of graphite, carbon black, coke and carbon fiber. These carbon materials have comparatively high conductivity and EMI shielding [10]. The metal based fillers consist of metal powder, metal fiber and metal alloys, which are used in cement matrix composites [9]. The metals such as silver, copper, and nickel was used for long time as conductive components in polymer due to their high conductivity [9].
Nowadays, Malaysia is one of the largest palm oil industry in the world. Furthermore, as the second largest global palm oil producer, Malaysia has the highest daily wastage [11] from burning of empty fruit bunch, fibre and palm oil shell in the boiler as fuel. This wastage was called as POFA and classified as Class-F fly ash as per ASTM C618 [12]. Currently, POFA usage is very limited and uncontrollable, and most of it is disposed of towards landfills. Consequently, it has caused numerous environmental harms [13, 14]. Earlier, POFA was applied for variety of application and typically used in concrete application. In concrete, POFA was used as filler to increase the strength of concrete [15, 16]. Besides, POFA Abstract: A waste material which is collected from palm oil mill called POFA is used as cement replacement in plastering work to overcome electromagnetic interference issue. In the experiment, variables involved POFA admixture percentage (weight %), topcoat powder-to-binder ratio, water-to-binder ratio, latex agent content (weight%), particle size of POFA (µm) and curing conditions. The EMI shielding effectiveness (SE) is mainly dependent on all variables, especially POFA admixture percentage and particle size of POFA. A hybrid Taguchi design and flower pollination algorithm (FPA) method was used to optimize the best approaching high EMI SE based on experimental data. The experimental results found that plaster mortar can shield -23dB of electromagnetic wave (EMW) while using FPA method was shielded -24.68dB. The interaction model of EMI SE was derived from regression analysis and the truth found that the EMI SE is dependent on the water-to-binder ratio followed by latex agent content, particle size of POFA and curing conditions. From the FPA process, targeted EMI SE were suggested 30.012% of POFA admixture percentage, 0.3 of topcoat powder-to-binder ratio, 1.03 of water-to-binder ratio, 10% of latex agent content, 45µm particle size of POFA and air curing condition were optimal variables.
O.L.C Narong et al., Int. J. of Integrated Engineering, Vol.10 No 3 (2018) p. 93 - 101
94
was used as pozzolanic material which can improve the durability of the concrete [17].
There are also many other high conductive fillers like silver, copper, and nickel can be use. However, these metal fillers are not only high in cost but very complicated in processing so they are not commonly used in cement matrix composite [9], therefore the POFA was choose to use as filler to mitigate against the EMI. The motivation of using POFA in EMI shielding is to reduce the agricultural waste that is uncontrollably dumped in landfills. Besides that, POFA is containing high carbon and iron III oxide which can be used to prevent the EMW radiation.
There is various type of design-of-experiment (DOE) was applied to optimize the optimal parameter of cement-based application. The Taguchi DOE is one of the familiar method was applied in cement-based application especially in designing the high strength concrete [18– 23]. The Taguchi DOE functional need fixed other processing parameters like mineral admixture, water-to-binder ratio, water content, plasticizer content, curing regime and curing condition [18–24]. Taguchi DOE was used for evaluating more influencing factors with fewer experiments [25]. Besides, the Taguchi DOE also was compared with other DOE or statistical tools for validation purpose [26].
To design the new parameter for plaster cement-based composite for EMI shielding-effectiveness, a mix level L16 orthogonal array table with six different
parameter Taguchi DOE was used. The parameter involved are POFA admixture percentage, topcoat to binder ratio, water-to-binder ratio, latex agent ratio, POFA particle size and curing condition. These parameters involved four and two level respectively. Therefore, mix level L16 orthogonal array table with six
different parameter Taguchi DOE was selected for this study. Taguchi design usually involve signal to noise ratio (S/N) analysis. The S/N ratio limited to recognize the optimum parameter directly from the list of variable in Taguchi design table. So, the researchers tried a lot of alternatives to develop the result precisely such as cuckoo search algorithm, FPA, swarm algorithm, genetic algorithm, moth search algorithm and others. FPA is proposed to this paper to solve the problem of optimal EMI shielding-effectiveness (SE) parameter. It has only one key parameter p (switch probability) which makes the algorithm easier to implement and faster to reach optimal solution. FPA originally created by Yang [3, 16, 27]. Nowadays, FPA is well-known for researchers to optimize several application problems.
This paper presents the data obtained from a study into the use of POFA in plastering cement-based composite. The data presented include EMI shielding-effectiveness which is design by Taguchi DOE and applied FPA to determine the optimal variable of parameter to accomplish the desired EMI shielding-effectiveness. The application for this research is mainly focus in plastering wall of building which is the wall can absorb the EMW radiation to least the EMI problem.
2.
Experimental methods
2.1
Materials
Five main materials were prepared including ordinary Portland cement (OPC), a local river sand, latex agent for plaster cement (LA), topcoat powder (TP) and POFA. The OPC and sand were supplied by Advance Engineering Material Laboratory from University Tun Hussein Onn Malaysia, Johor, Malaysia. TP and LA was supplied by Nas Sutera Engineering Sdn. Bhd. OPC and TP were coming with powder form from supplier. Meanwhile, POFA was supplied from Genting Ayer Hitam Oil Mill, Johor, Malaysia. The fresh POFA was originally supplied in large particles and impurities. POFA was refined by using water-immersion method [28] to wash up the dust. The POFA was dried in oven for 24 hours at 100 ± ºC and grinded became fine powder. POFA was sieve by 160 µm and 45 µm sieves to create the fine POFA (FPOFA) and ultra-fine POFA (UPOFA) respectively. Based on the XRF results, the total of silicon dioxide (SiO2) + aluminium oxide (Al2O3)+ Iron(III)
oxide (Fe2O3) of this POFA is greater than 70% with
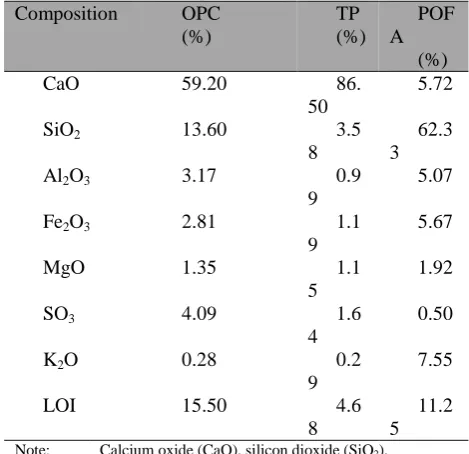
satisfies the chemical composition required for Class-F fly ash as accomplish to ASTM C618 [12]. The chemical composition of OPC, TP and POFA are given in Table 1. The local river sand was used with the grading given in Table 2. This gradation of sand is accordance with the requirement in ASTM C144[29].
Table 1 Chemical composition of OPC, TP and POFA Composition OPC
(%)
TP (%)
POF A
(%)
CaO 59.20 86.
50
5.72
SiO2 13.60 3.5
8
62.3 3
Al2O3 3.17 0.9
9
5.07
Fe2O3 2.81 1.1
9
5.67
MgO 1.35 1.1
5
1.92
SO3 4.09 1.6
4
0.50
K2O 0.28 0.2
9
7.55
LOI 15.50 4.6
8
11.2 5 Note: Calcium oxide (CaO), silicon dioxide (SiO2),
aluminium oxide (Al2O3), iron(III) oxide (Fe2O3), magnesium oxide (MgO), sulfur trioxide, (SO3), potassium oxide (K2O) and Lost of ignition (LOI)
Table 2 Gradation of sand Sieve
size ASTM
No. 4
No. 8
No. 16
No. 30
No. 50
No. 100
No. 200
Passing (%)
95
2.2
Plastering mortar compositions
All samples were prepared accordance to previous study [8], which is especially for plastering work. The plaster mortar was prepared with 1:3 fixed binder (OPC+POFA)-to-sand ratio according to the P. Chindaprasirt [8] plastering work. All samples were prepared based on mix level L16 orthogonal array table of
Taguchi design as Table 3 and Table 4 show. All samples were left for 28 days for curing. Based on ASTM C91[30] and real construction industry practice, the mortar was takes 28 days to cure and reach 100% of its strength. FPOFA (160 µm) and UPOFA (45 µm) were used to determine the contribution of particle size in EMI SE. LA for plaster mortar was used to mixed for mortar strengthening. The recommend dosage of this agent is provided by supplier, it is 0 to 10% by weight of cement. TP was containing mainly limestone powder for used as additives to enhance workability, water retention and adhesion as per provided in the usage catalogue technical data sheet. The TP-to-binder ratio is between 0 to 0.3 by weight of binder as per provided in usage manual. The water-to-binder (W/B) ratio was applied based on the previous study[8], it is between 0.6 to 1.2 by weight of binder. Finally, all samples were prepared with a 20×20×120mm prism mould. The curing conditions of the sample are water immersion and air exposed at below 23ºC.
Table 3 Parameter and level
No. Parameter Level
1 2 3 4
P1 POFA admixture
percentage(wt%) 10 20 30 40
P2 Topcoat powder-to-binder
ratio 0.00 0.10 0.20 0.30
P3 Water-to-binder ratio 0.6 0.8 1 1.2
P4 Latex agent content (wt%) 0 1 5 10
P5 Particle size of POFA (µm) 140 45
P6 Curing condition Air Water
2.3
EMI
shielding
effectiveness
measurement
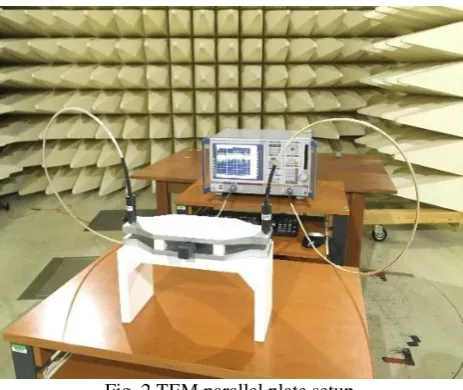
In this work, a Transverse Electric and Magnetic (TEM) parallel plate was connected to a network analyser (NA), through an N-type coaxial port. This device was used to measure the dielectric constant and loss factor of sample to obtain the SE. This device was custom made especially for this project [31–33]. In order to connect this TEM parallel plate with the NA, a 60º taper was used. The tapers connect one of the aluminium plates to the inner conductor of the N-type port. The SMA connector is an interface for coaxial cable with a screw N-type coupling mechanism. The outer conductor of the N-type port is connected to another aluminium plate, this can be illustrated in Fig. 1.
Fig. 1 TEM parallel plate (a) full assembly (b) disamsbling
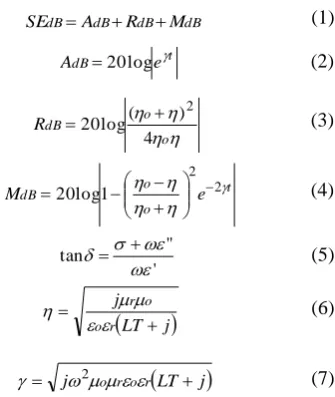
Based on the measured dielectric constant and loss factor of the specimen, its absorption loss (AdB), reflection loss (RdB), multiple reflection loss(MdB) and shielding
effectiveness (SE) were calculated based on equation (1)-(7)[34]. During the measurement, the sample was place between the plates at the slot.
Where,
Fig. 2 shows the setup of the dielectric measurement. The frequency applied is between 0.1 to 1.4 GHz accordance to the daily life EMW exposes.
a
b
LT j
jr o
o r
LT j
j o r o r
2
t
dB e
A 20log
o o dB
R
4 ) ( log 20
2
t
o o
dB e
M
2
2
1 log
20
dB dB dB
dB A R M
SE
(2) (1)
(3)
(5)
(6) (4)
(7)
' " tan
O.L.C Narong et al., Int. J. of Integrated Engineering, Vol.10 No 3 (2018) p. 93 - 101
96
Fig. 2 TEM parallel plate setup
2.4
Taguchi design and FPA optimization
method
In this study, the Taguchi design method was used to study a large number of variables with minor of experiments number. Taguchi design was chosen to optimize the preparation condition of EMI SE plaster mortar containing POFA. The six parameter that mainly use in Taguchi design are POFA admixture percentage
(wt.%), topcoat powder-to-binder ratio, water-to-binder ratio, latex agent content (wt.%), particle size of POFA (µm) and curing condition, which is chosen as factors with appropriate mix factor levels L16 orthogonal array
table as Table 4 shown. All variables are selected based on literature and previous study [3, 8, 28, 35, 36] as well as suitability of local raw material (POFA). The normal full factorial design would require 22× 44= 1024 experiment runs. Clearly, it is very impossible to do these experimental runs and will take high in cost but while using Taguchi design can simplify only 16 runs (Table 4). In order to ascertain the direct comparison with different scales of observation, the variables were normalized between (-1, 1) by using equation (8) to explore the individual influence of each variable in determine the output response.
Where 𝑋𝑛 is the normalized value of the parameter variables which are POFA admixture percentage (wt%), topcoat powder-to-binder ratio, water-to-binder ratio, latex agent content (wt.%), particle size of POFA (µm) and curing condition. 𝑋 is the absolute value of the actual response, 𝑋̅ is the mean value of 𝑋𝑚𝑎𝑥 and 𝑋𝑚𝑖𝑛 whereas 𝑋𝑚𝑎𝑥 and 𝑋𝑚𝑖𝑛 is the maximum and minimum value for a
particular parameter variable, respectively. The normalized result was shown in Table 7.
Table 4 L16 mix level Taguchi Design and Experimental Results
Run Parameters
Experiment al values of EMI SE (dB)
Actual value Coded value
POFA admixture (%)
TP /B ratio
W/B ratio
LA content (%)
POFA Size (µm)
Curing condition
𝑋1 𝑋2 𝑋3 𝑋4 𝑋5 𝑋6
1 10 0 0.6 0 140 Air -1 -1 -1 -1 -1 -1 -8 2 10 0.1 0.8 1 140 Water -1 -0.33 -0.33 -0.33 -1 1 -5 3 10 0.2 1 5 45 Air -1 0.33 0.33 0.33 1 -1 -5 4 10 0.3 1.2 10 45 Water -1 1 1 1 1 1 -6 5 20 0 0.8 5 45 Water -0.33 -1 -0.33 0.33 1 1 -6
6 20 0.1 0.6 10 45 Air -0.33 -0.33 -1 1 1 -1 -23
7 20 0.2 1.2 0 140 Water -0.33 0.33 1 -1 -1 1 -8 8 20 0.3 1 1 140 Air -0.33 1 0.33 -0.33 -1 -1 -4 9 30 0 1 10 140 Water 0.33 -1 0.33 1 -1 1 -9 10 30 0.1 1.2 5 140 Air 0.33 -0.33 1 0.33 -1 -1 -7 11 30 0.2 0.6 1 45 Water 0.33 0.33 -1 -0.33 1 1 -9 12 30 0.3 0.8 0 45 Air 0.33 1 -0.33 -1 1 -1 -7 13 40 0 1.2 1 45 Air 1 -1 1 -0.33 1 -1 -7 14 40 0.1 1 0 45 Water 1 -0.33 0.33 -1 1 1 -7 15 40 0.2 0.8 10 140 Air 1 0.33 -0.33 1 -1 -1 -7 16 40 0.3 0.6 5 140 Water 1 1 -1 0.33 -1 1 -8
2.5
Flower pollination algorithm (FPA)
FPA was developed by Xin-She Yang in 2012 [37]. This algorithm method is a new nature-inspired algorithm, based on the characteristics of flowering plants [27, 37]. Flower pollination algorithm (FPA) uses the following four rules in optimization [37]: Biotic and cross-pollination can be considered as a process of global pollination process, and pollen-carrying pollinators move in a way which obeys Lévy flights (Rule 1).
For local pollination, abiotic and self-pollination are used (Rule 2).
Pollinators such as insects can develop flower constancy, which is equivalent to a reproduction probability that is proportional to the similarity of two flowers involved (Rule 3).
97
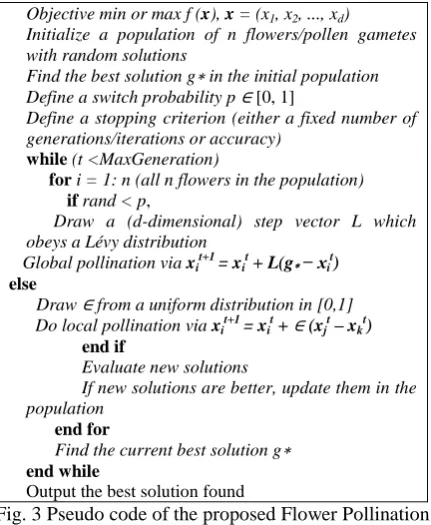
The population size is 25 and 1000 of iterationnumber, the coding was run to develop the best result of targeted EMI SE. The pseudo code of the proposed Flower Pollination Algorithm (FPA) can represent as follows [37]:
Objective min or max f (x), x = (x1, x2, ..., xd)
Initialize a population of n flowers/pollen gametes with random solutions
Find the best solution g∗ in the initial population Define a switch probability p ∈[0, 1]
Define a stopping criterion (either a fixed number of generations/iterations or accuracy)
while(t <MaxGeneration)
fori = 1: n (all n flowers in the population) ifrand < p,
Draw a (d-dimensional) step vector L which obeys a Lévy distribution
Global pollination via xi t+1
= xi t
+ L(g∗− xi t
) else
Draw ∈ from a uniform distribution in [0,1] Do local pollination via xit+1 = xit + ∈ (xjt – xkt)
end if
Evaluate new solutions
If new solutions are better, update them in the population
end for
Find the current best solution g∗ end while
Output the best solution found
Fig. 3 Pseudo code of the proposed Flower Pollination Algorithm (FPA) (X.-S. Yang, 2012)
To run the FPA, a set of objective function equation must develop before running the optimization in MATLAB software. The objective function equation was developed by coded values of the experimental results using the interaction model equation as equation (9) shown.
𝑌 = 𝛽0+ ∑ 𝛽𝑖𝑋𝑖+ ∑ 𝛽𝑖𝑗𝑋𝑖𝑋𝑗 𝑘
𝑖<𝑗 𝑘
𝑖=1 (9)
where 𝑌 is the dependent variable or estimation for the response variables of the designed experiment (EMI shielding effectiveness), and b is the estimation for the regression coefficient computed by least squares approach. Finally, the complete objective function with interaction equation is as equation (10) shown.
SE= b(1) + b(2)X1 + b(3)X2 + b(4)X3 + b(5)X4 + b(6)X5 + b(7)X6 + b(8) X1X2X3X4 + b(9) X5X6X1X2 + b(10) X3X4X5X6
3.
Results and Discussion
3.1
Experimental result
The experimental dielectric measurement was successfully done by using TEM parallel plate. The calculation was done based on equation (1) to equation
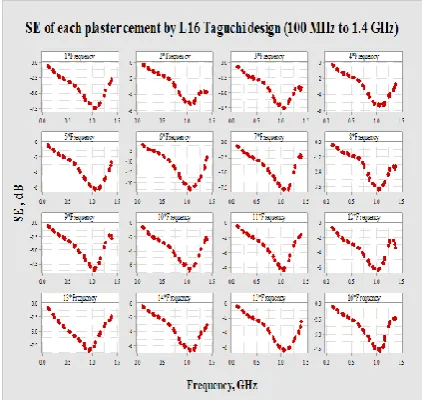
(7) via Microsoft excel. Based on the Taguchi design, the results were fluctuated from number 1 to number 16 of experiment run. The best EMI shielding effectiveness (SE) was shows on number 6 of L16
Taguchi design which is achieved -23dB SE (Fig. 4 and Fig. 5). In run number 6, the POFA admixture percentage (wt.%) is 20%, topcoat powder-to-binder ratio is 0.1, water-to-binder ratio is 0.6, with latex agent content (wt.%) of 10%, the particle size of POFA (µm) is 45µm and with air curing condition. The EMI SE is dependent on POFA admixture (X1) and the
particle size of POFA (X5) as shown in Table 7. Based
on P. Chindaprasirt [8] work, the ideal water-to-binder ration is in between 0.6 to 0.75, while in this study the experimentally data shows that 0.6 is the best water-to-binder ratio.
Fig. 4 SE of plaster cement by L16 Taguchi design (100 MHz to 1.4 GHz)
O.L.C Narong et al., Int. J. of Integrated Engineering, Vol.10 No 3 (2018) p. 93 - 101
98
Fig. 5 SE of each plaster cement by L16 Taguchi design (100 MHz to 1.4 GHz)
3.2
Interaction Modelling
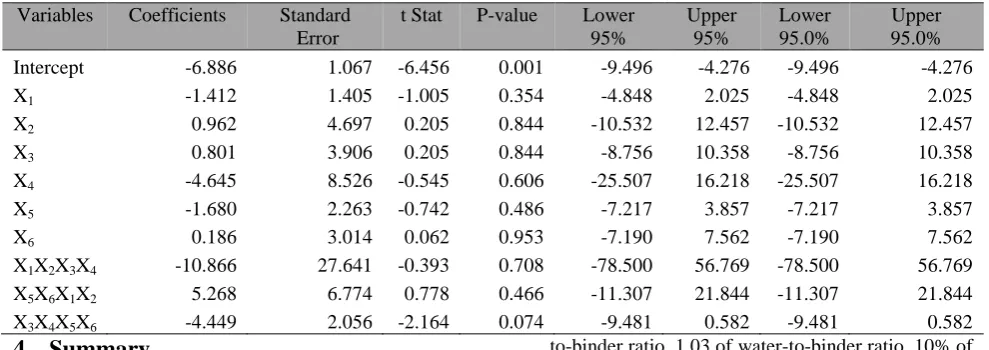
The FPA was used to obtain the best solution to approaching the higher EMI SE. At the same time, Table 5 shows the regression statistics result which is R square is equal to 0.674192542. The closer to 1 of R square is consider as a very good fit. To verify the reliable of parameter variables, the significant F must equal or less than 0.05. In Table 6, the analysis of variance (ANOVA) are statistically insignificant due to significant F value greater than 0.05. But in this case, the investigations on EMI SE of plaster mortar still consider all variables in modelling equation. Base on the Table 7, the sign and magnitude of regression coefficient signify the relative influence of each parameter of the output response (EMI SE) with a negative sign indicating an antagonistic effect whilst a positive one signifies a synergistic effect. The mathematical interaction model of EMI SE of POFA layer 1 was developed based on the sign and magnitude of regression coefficient as shown in equation (11).
The FPA can improve the prediction SE at 6.86% compare to experimental result. The summary of comparison is shows in Table 7. Based on P-value coefficient of mathematical interaction model in Table 8, EMI SE is mainly dependent on the four interaction
between X3X4X5X6 (water-to-binder ratio, latex agent
content, particle size of POFA, curing condition) followed by POFA admixture percentage (X1),
X5X6X1X2 (POFA admixture percentage, topcoat
powder-to-binder ratio, particle size of POFA, curing
condition), particle size of POFA (X5), latex agent
content (X4), X1X2X3X4 (POFA admixture percentage,
topcoat powder-to-binder ratio, water-to-binder ratio, latex agent content), topcoat powder-to-binder ratio (X2), water-to-binder ratio (X3) and curing condition
(X6).
Table 5 Regression statistic
Regression Statistics
Multiple R 0.821092286
R Square 0.674192542
Adjusted R Square 0.185481354 Standard Error 3.855511028 Observations 16
Table 6: ANOVA
df SS MS F
Significance F
Regression 9 184.56 20.51 1.38 0.36 Residual 6 89.19 14.86
Total 15 273.75
SE = (-6.886) + (-1.412) X1 + (0.962) X2 + (0.801) X3 + (-4.645) X4 +
(-1.680) X5+ (0.186) X6 +
(-10.866) X1X2X3X4+(5.268) X5X6X1X2
+ (-4.449) X3X4X5X6
Finally, the FPA gives the best solution for approaching the higher EMI SE as follow: 30.012% of POFA admixture percentage, 0.3 of topcoat powder-to-binder ratio, 1.03 of water-to-powder-to-binder ratio, 10% of latex agent content, 45µm particle size of POFA and air curing condition. The FPA can obtain up to -24.68 dB of EMI SE while the experimental results can obtain only -23dB.
Table 7: Comparison of SE between FPA Optimization and experimental data
Method POFA admixture (%)
TP /B ratio
W/B ratio
LA content (%)
POFA Size (µm)
Curing condition
EMI SE (dB)
Improvement (%)
Taguchi 20 0.1 0.6 10 45 Air -23
6.86
FPA 30.012 0.3 1.03 10% 45 Air -24.68
99
Table 8: Coefficient of mathematical interaction modelVariables Coefficients Standard Error
t Stat P-value Lower 95%
Upper 95%
Lower 95.0%
Upper 95.0%
Intercept -6.886 1.067 -6.456 0.001 -9.496 -4.276 -9.496 -4.276
X1 -1.412 1.405 -1.005 0.354 -4.848 2.025 -4.848 2.025
X2 0.962 4.697 0.205 0.844 -10.532 12.457 -10.532 12.457
X3 0.801 3.906 0.205 0.844 -8.756 10.358 -8.756 10.358
X4 -4.645 8.526 -0.545 0.606 -25.507 16.218 -25.507 16.218
X5 -1.680 2.263 -0.742 0.486 -7.217 3.857 -7.217 3.857
X6 0.186 3.014 0.062 0.953 -7.190 7.562 -7.190 7.562
X1X2X3X4 -10.866 27.641 -0.393 0.708 -78.500 56.769 -78.500 56.769
X5X6X1X2 5.268 6.774 0.778 0.466 -11.307 21.844 -11.307 21.844
X3X4X5X6 -4.449 2.056 -2.164 0.074 -9.481 0.582 -9.481 0.582
4.
Summary
This study mainly deals with Taguchi design of experimental investigation and FPA optimization in EMI shielding effectiveness of plaster mortar. However, the use of L16 Taguchi design can minimize hundreds of
experiment runs and at the same time the use of FPA also can obtain the optimum solution. Mathematical interaction model of EMI SE in terms of all parameter variables have been developed using regression analysis and checked for its adequacy. By using Matlab software, the model developed was inserted into FPA command to develop the optimal parameter variable for targeted EMI SE. The following conclusions were drawn from the results of this investigation.
The used of Taguchi design can be conclude that is very satisfactory for this experiment. It is highly recommended for other researcher to use the Taguchi method for design their experiment for more efficiency of research work.
The Taguchi method provided appropriate design for this experiment even though the level of control factor is various and mixed.
From the experimental results, the mixing 20% of POFA can be shield the EMW at -23dB while FPA can predicted up to -24.68dB.
From mathematical intersection model, the EMI SE is mainly dependent on POFA admixture percentage (X1) followed by particle size of POFA (X5), latex
agent content (X4), topcoat powder-to-binder ratio
(X3), water-to-binder ratio and curing condition
(X6).
In terms of interaction between four parameters, the EMI SE is mainly dependent on X3X4X5X6
(water-to-binder ratio, latex agent content, particle size of POFA, curing condition) followed by, X5X6X1X2
(POFA admixture percentage, topcoat powder-to-binder ratio, particle size of POFA, curing condition)
and X1X2X3X4 (POFA admixture percentage,
topcoat powder-to-binder ratio, water-to-binder ratio, latex agent content).
FPA suggested optimum parameter variables to approaching higher EMI SE as follow: 30.012% of POFA admixture percentage, 0.3 of topcoat
powder-to-binder ratio, 1.03 of water-powder-to-binder ratio, 10% of latex agent content, 45µm particle size of POFA and air curing condition.
The optimal variables obtained from FPA listed limited for the single objective only which is approaching higher EMI SE.
The FPA can obtain 6.68% higher EMI SE based the suggested optimal parameter variables.
Acknowledgement
This paper was partly sponsored by the Centre for Graduate Studies University Tun Hussein Onn Malaysia.
References
[1] Beall, C. et al. Brain tumors among electronics industry workers. Epidemiology, Volume 7(2), (1996), pp. 125–130.
[2] Xie, S. et al. Development of layer structured wave absorbing mineral wool boards for indoor electromagnetic radiation protection. Journal of Building Engineering, Volume 5, (2016), pp. 79–85. [3] Narong, L.C. et al. Optimization of the EMI shielding effectiveness of fine and ultrafine POFA powder mix with OPC powder using Flower Pollination Algorithm. IOP Conference Series: Materials Science and Engineering. IOP Publishing, Volume 165(1), (2017), pp. 12035-12047.
[4] Baoyi, L. et al. The electromagnetic characteristics of fly ash and absorbing properties of cement-based composites using fly ash as cement replacement.
Construction and Building Materials, Volume 27(1), (2012), pp. 184–188.
[5] Cao, J., Chung, D.D.L. Coke powder as an admixture in cement for electromagnetic interference shielding. Carbon, Volume 41(12), (2003), pp. 2433–2436.
[6] Kimura, K., Hashimoto, O. Three-layer wave absorber using common building material for wireless LAN. Electronics Letters, Volume 40 (21), (2004), pp. 1323-1324.
O.L.C Narong et al., Int. J. of Integrated Engineering, Vol.10 No 3 (2018) p. 93 - 101
100
absorbing concrete. In: Computational Science and Optimization (CSO), 2010 Third International Joint Conference on. IEEE, Volume 1, (2010), pp. 335– 338.
[8] Chindaprasirt, P. Mixed cement containing fly ash for masonry and plastering work. Volume 19, (2005), pp. 612–618.
[9] Guan, H. et al. Cement based electromagnetic shielding and absorbing building materials. Cement and Concrete Composites, Volume 28 (5), (2006), pp. 468–474.
[10] Chung, D.D.L. Materials for electromagnetic interference shielding. Journal of Materials Engineering and Performance, Volume 9 (3), (2000), pp. 350–354.
[11] Khalid, N.H.A. et al. Palm oil fuel ash as potential green micro-filler in polymer concrete. Construction and Building Materials, Volume 102, (2016), pp. 950–960.
[12] ASTM C618. Standard specification for coal fly ash and raw or calcined natural pozzolan for use in
concrete. American society for testing and
materials. West Conshohocken, PA, USA: ASTM International, Volume 12, (2012), pp. 1-3.
[13] Khankhaje, E. et al. On blended cement and geopolymer concretes containing palm oil fuel ash.
Materials & Design, Volume 89, (2015), pp. 385– 398.
[14] Sia, C.K. et al. Optimum preparation and thermal conductivity of novel glossy paint prepared from waste of palm oil fly ash composite. International Journal of Automotive & Mechanical Engineering, Volume 12, (2015), pp. 3058-3064.
[15] Lim, S.K. et al. Fresh and hardened properties of lightweight foamed concrete with palm oil fuel ash as filler. Construction and Building Materials, Volume 46, (2013), pp. 39–47.
[16] Zainudin, A. et al. Taguchi design and flower pollination algorithm application to optimize the shrinkage of triaxial porcelain containing palm oil fuel ash. In: IOP Conference Series: Materials Science and Engineering. IOP Publishing, Volume 165, (2017), pp. 12036-12043.
[17] Kroehong, W. et al. Effect of palm oil fuel ash fineness on packing effect and pozzolanic reaction of blended cement paste. Procedia Engineering, Volume 14, (2011), pp. 361–369.
[18] Tanyildizi, H., Şahin, M. Application of Taguchi method for optimization of concrete strengthened with polymer after high temperature. Construction and Building materials, Volume 79, (2015), pp. 97– 103.
[19] Hınıslıoğlu, S., Bayrak, O.Ü. Optimization of early flexural strength of pavement concrete with silica fume and fly ash by the taguchi method. Civil Engineering and Environmental Systems, Volume 21(2), (2004), pp. 79–90.
[20] Türkmen, İ.m et al. Determination by the Taguchi method of optimum conditions for mechanical properties of high strength concrete with admixtures
of silica fume and blast furnace slag. Civil Engineering and Environmental Systems, Volume 20(2), (2003), pp. 105–118.
[21] Ozbay, E. et al. Investigating mix proportions of high strength self-compacting concrete by using Taguchi method. Construction and Building materials, Volume23 (2), (2009), pp. 694–702. [22] Türkmen, İ. et al. A Taguchi approach for
investigation of some physical properties of concrete produced from mineral admixtures.
Building and Environment, Volume 43(6), (2008), pp. 1127–1137.
[23] Olivia, M., Nikraz, H. Properties of fly ash geopolymer concrete designed by Taguchi method.
Materials & Design, Volume 36, (2012), pp. 191– 198.
[24] Chang, C.Y. et al. Application of a weighted Grey-Taguchi method for optimizing recycled aggregate concrete mixtures. Cement and concrete composites, Volume 33(10), (2011), pp. 1038–1049.
[25] Bagheri, A., Nazari, A. Compressive strength of high strength class C fly ash-based geopolymers with reactive granulated blast furnace slag aggregates designed by Taguchi method. Materials & Design, Volume 54, (2014), pp. 483–490. [26] Huang, M.-L. et al.Validation of a method using
Taguchi, response surface, neural network, and genetic algorithm. Measurement, Volume 94, (2016), pp. 284–294.
[27] Yang, X. S. Flower pollination algorithm for global optimization. In: International Conference on Unconventional Computing and Natural Computation. Springer, Volume 7445, (2012), pp. 240–249.
[28] Ching, N.O.L. et al. Exploring the Potential of Palm Oil Fuel Ash (POFA) in EMI Shielding Effectiveness. International Journal of Mechanical Engineering, Volume 2(1), (2017), pp. 101-111. [29] ASTM C144. Standard Specification for Aggregate
for Masonry Mortar 1. American society for testing and materials. West Conshohocken, PA, USA:
ASTM International,Volume 70, (2014), pp. 53–54.
[30] ASTM C91. Masonry Cement 1. American society for testing and materials. West Conshohocken, PA,
USA: ASTM International,Volume 4, (2003), pp. 1–
6.
[31] Yee, S.K. et al. Prediction of Shielding Effectiveness of Cement-Graphite Powder Using Artificial Neural Network. Jurnal Teknologi, Volume 78(6-2), (2016), pp. 33-38.
[32] Yee, S.K. et al. Design and calibration of a wideband TEM-cell for material characterization.
In: Electromagnetic Compatibility (APEMC), 2012 Asia-Pacific Symposium on. IEEE, Volume 10, (2012), pp. 749–752.
[33] Wilson, P.F., Ma, M.T. Techniques for Measuring the Electromagnetic Shielding Effectiveness of Materials: Part II-Near-Field Source Simulation.
101
[34] Paul, C.R. Introduction to electromagneticcompatibility. John Wiley & Sons, Volume 184, (2006), pp. 1-48.
[35] Sinsiri, T. et al. Assessing the effect of biomass ashes with different finenesses on the compressive strength of blended cement paste. Materials and Design, Volume 42, (2012), pp. 424–433.
[36] Tangchirapat, W. et al. Use of palm oil fuel ash as a supplementary cementitious material for producing high-strength concrete. Construction and Building Materials, Volume 23(7), (2009), pp. 2641–2646. [37] Yang, X.S. et al. Multi-objective flower algorithm