ISSN: 1394-7990 Malaysian Journal of Soil Science Vol. 20: 135-145 (2016) Malaysian Society of Soil Science
Assessment of Soil Enzyme Activities Based on Soil
Samples from the Beas River Bed, India Using Multivariate
Techniques
Kumar, V.
a, A. Sharma
a, A.K. Thukral
aand R. Bhardwaj
a*aDepartment of Botanical and Environmental Sciences, Guru Nanak Dev University, Amritsar, Punjab 143005, India
ABSTRACT
This study was aimed at assessing soil enzyme activities in the Beas River bed for the pre-monsoon, post-monsoon and winter seasons. Soil samples were collected in triplicates from four sites for each season and analysed for 21 soil characteristics. The soil enzymes assessed were urease, catalase, polyphenol oxidase (PPO) and invertase. The hypothesis tested was that the enzyme activities are determined by soil characteristics and other environmental variables. Data were analysed using analysis of variance, multiple comparison test, cluster analysis, principal component analysis, stepwise multiple linear regression analysis and artificial neural networks. It was concluded from the study that maximum soil urease, PPO and invertase activities occurred during the winter season. There were two factors underlying the enzyme activities: factor-1 for urease and catalase, and factor-2 for PPO and invertase. Urease activity was increased to a maximum by the phosphate content of the soil, an important component of animal excreta. Nickel and Cu are the prosthetic groups of urease and PPO which contributed a maximum to the activities of the respective enzymes.
Keywords: River Beas, soil enzyme activities, multivariate techniques, artificial neural networks
___________________
*Corresponding author : E-mail: [email protected] INTRODUCTION
Malaysian Journal of Soil Science Vol. 20, 2016
136
Kumar et al.
to soil management practices, nutrient cycling, organic matter decomposition and bioremediation activities. Invertase enzyme is important because it releases sugars used by microorganisms (Shi et al., 2008; Rahmansyah and Sudiana, 2010). Gu et al. (2009) studied the soil enzymes activities of urease, invertase and polyphenol oxidase (PPO) from China. Mondal et al., (2015) studied the seasonal variation of soil enzyme activities such as urease and invertase in fluoride stressed areas of West Bengal, India. Zhang et al., (2015) studied urease, invertase and PPO activities from Gurbantunggut desert, Xinjiang. The present study was aimed at assessing soil enzyme activities in the river bed of the River Beas for pre-monsoon, post-monsoon and winter seasons respectively.
MATERIALS AND METHODS
Study Area
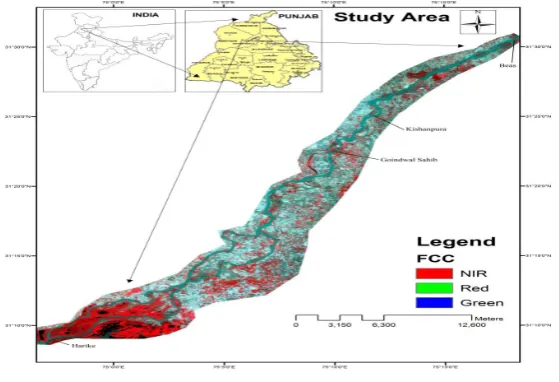
The River Beas originates in central Himachal Pradesh, India, 32.21′N lat., 77°05′E at an altitude of 2050 m above sea level, and merges with the river Sutlej at Harike, Punjab, after traversing a distance of about 470 km. Soil samples were collected from the river bed of the River Beas between the towns of Beas and Harike over a stretch of 63 km at the following sites (Figure 1):
1. Beas (31.510’ N and 75.305’ E ) 2. Kishanpura (31.409’ N and 75.189’ E) 3. Goindwal Sahib (31.376’ N and 75.162’ E) 4. Harike (31.150’ N and 74.951’ E)
Soil Sampling and Enzyme Activities
Landsat (TM) data were obtained from the United States Geological Survey (USGS) (http://glovis.usgs.gov/). Map of the study area was prepared by using Erdas Imagine ‘11’ and Arc GIS 9.3 software. Soil samples were collected on 7th
June 2013 (pre-monsoon season), 14th October 2013 (post-monsoon season) and
26th February 26, 2014 (winter season)in triplicates at a depth of 0-5 cm and stored
at 4oC in a refrigerator. All the soil samples were ground and sieved with a
0.6-mm sieve in order to remove any effect of particle size before analysis. Standard methods for soil analysis were followed as described earlier (Kumar et al., 2015).
Catalase activity was measured following the method of Guan et al., (1986). To 2 g of soil, 40 ml of distilled water and 5 ml of 0.3% H2O2 were added. The
mixture was shaken at 25oC for 20 min. Then, 5 ml of 1.5 M H
2SO4 was added and
the contents were titrated with 0.1 M KMnO4.
The activities of urease and PPO were estimated by following the method of Guan (1986). For urease, 5 g of moist soil was incubated at 37oC for 2 h in 20 ml
of borate buffer. After incubation, 50 ml of 1 M KCl solution was added and the mixture was shaken for 30 min. Absorbance was determined using the uv-visible spectrophotometer at 690 nm.
Malaysian Journal of Soil Science Vol. 20, 2016 137
Analysis of Soil Enzyme Activities
suspension was incubated in a water bath for 2 min at 30oC. Subsequently 3 ml of
10% phosphoric acid was added and the filtrate was titrated with 0.005 M iodine. Invertase activity was measured by using the method of Guan et al. (1986). To 5 g of dried soil, 0.2 ml of methylbenzene was added and allowed to stand for 15 min. Then, 15 ml of 18% sucrose solution and 5 ml of phosphate buffer were added, and incubated for 24 h at 37oC. After incubation, 3 ml of 3,
5-dinitrosalicyclic acid solution and 5 ml of deionized water were added to 0.5 ml of the filtrate. All tubes were placed in the boiling water bath for 5 min and then cooled to room temperature. Finally the solution was diluted to 50 ml, and absorbance was determined using the uv-visible spectrophotometer at 508 nm.
Statistical Analysis
Data was statistically analysed by using one way ANOVA, cluster analysis (CA), principal component analysis (PCA), factor analysis (FA), stepwise multiple linear regression analysis (SMLR) and artificial neural network analysis (ANN). MS-Excel-2007, PAST, Minitab-14, Statistica-12 and self-coded software were used for the analysis.
RESULTS AND DISCUSSION
Table 1 shows the soil characteristics of the sampled soils from the river bed of the Beas for different seasons. Table 2 summarises the statistics of the enzyme activities in the soil samples collected from the river beds of Beas for different seasons. Differences in soil enzyme activities were found to be significant as given in Table 2. Urease, PPO and invertase activities were found to be at a maximum during the winter season. Activity of catalase is sensitive to biological factors and is closely related with major soil nutrient elements (Asmar et al.,
6
Metal analysis
Urease activity K (-1.01) Ni(0.86) Zn (0.74) Mn(0.54) Fe(-0.53) Na(0.43)
Catalase activity Ni(0.53) Na(-0.51)
PPO activity Ca (-0.84) Fe (-0.59) Cu(0.56)
Invertase activity Ni(0.87) Ca (-0.26)
Malaysian Journal of Soil Science Vol. 20, 2016
138
4
Table 1 Chemical characteristic of soils from pre-monsoon, post-monsoon and winter seasons of Beas river bed.
Characteristics Pre-monsoon season
Mean±SD
Post-monsoon season
Mean±SD
Winter season
Mean±SD F-Ratio *(p<0.05) HSD (p<0.05)
pH 8.26±0.096 8.16±0.074 6.65±0.09 406.50* 0.176
Conductivity (µS/cm)
281.00±72.88 357.85±121.44 156.65±26.63 5.95* 164.34
WHC (%) 35.36±2.76 39.30±4.95 38.78±6.82 0.69 ns
H (%) 0.32±0.07 0.31±0.08 1.05±0.68 4.45* 0.794
C (%) 0.16±0.02 0.17±0.02 0.15±0.02 0.25 ns
N (%) 0.084±0.02 0.094±0.01 0.135±0.04 3.21 ns
P (mg/g) 0.013±0.010 0.006±0.005 0.093±0.043 13.97* 0.051
Na (mg/g) 4.19±1.23 1.91±0.26 4.39±1.12 7.91* 1.93
K (mg/g) 2.70±0.42 1.75±0.23 2.13±0.70 3.77 ns
Ca (mg/g) 15.80±1.11 17.20±3.18 11.85±2.18 5.71* 4.58
Mg (mg/g) 4.61±1.01 5.73±2.99 3.09±1.01 1.91 ns
Fe (mg/g) 37.48±12.42 28.67±2.94 30.29±6.62 1.273 ns
Zn (mg/g) 0.031±0.006 0.030±0.006 0.031±0.002 0.033 ns
Mn (mg/g) 1.20±0.39 0.985±0.22 0.385±0.11 9.93* 0.531
Ni (mg/g) 0.142±0.11 0.34±0.32 0.074±0.056 1.91 ns
Cr (mg/g) 0.023±0.004 0.022±0.003 0.022±0.004 0.088 ns
Cu (mg/g) 0.020±0.007 0.016±0.004 0.016±0.003 0.981 ns
ns = not significantand ‘*’= significant at p< 0.05.
Table 2 Soil enzyme activities of Beas river bed for pre-monsoon, post-monsoon and winter seasons.
Characteristics Pre-monsoon season
Mean±SD
Post-monsoon season
Mean±SD
Winter Season
Mean±SD
F-Ratio
*(p<0.05) HSD (p<0.05)
Urease mg N-NH4+ 100 g-1 soil24 h-1 7.34
ab±0.94 7.09b±0.96 11.51a±3.32 3.99* 4.31
Catalase 0.1 M KMnO4 g-1 soil
0.154b±0.028 0.25a±0.036 0.167b±0.023 18.22* 0.042
TABLE 1
Chemical characteristic of soils from pre-monsoon, post-monsoon and winter seasons of Beas river bed.
TABLE 2
Soil enzyme activities of Beas river bed for pre-monsoon, post-monsoon and winter seasons.
Kumar et al.
5
Table 2 Soil enzyme activities of Beas river bed for pre-monsoon, post-monsoon and winter seasons.
Characteristics Pre-monsoon season
Mean±SD
Post-monsoon season
Mean±SD
Winter Season
Mean±SD
F-Ratio
*(p<0.05) HSD (p<0.05)
Urease mg N-NH4+ 100 g-1 soil24 h-1 7.34
ab±0.94 7.09b±0.96 11.51a±3.32 3.99* 4.31
Catalase 0.1 M KMnO4 g-1 soil
0.154b±0.028 0.25a±0.036 0.167b±0.023 18.22* 0.042
PPO 0.005 M I2 g-1
soil h-1 22.25
ab±2.18 20.35b±3.52 25.40a±1.97 5.91* 3.44
Invertase glucose
mg g-1 soil 24 h-1 2.82
c±0.67 3.75a±0.52 4.37a±2.23 8.33* 0.82
Values with same superscript or no superscript in the same row imply that the values are not
significantly different from each other at p>0.05.
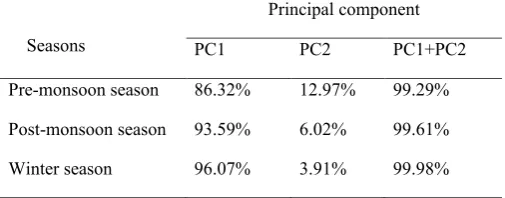
Table 3 Percent variance explained of soil enzyme activities for different seasons from Beas river bed.
Seasons
Principal component
Malaysian Journal of Soil Science Vol. 20, 2016 139
1992; Rodriguez-kabana and Truelove, 1982). Mondal et al. (2015) reported the range of invertase (activity to be 0.41 to 3.97 glucose mg g-1 soil 24 h-1 in fluoride
stressed areas of Birbhum district, West Bengal. Trasar-Cepeda et al., (2008) also studied urease activity (in agricultural and forest soils from Spain and found it to range from1.9 to 17.7 µmol NH3 g-1 h-1. Our results showed slight variations from
their work.
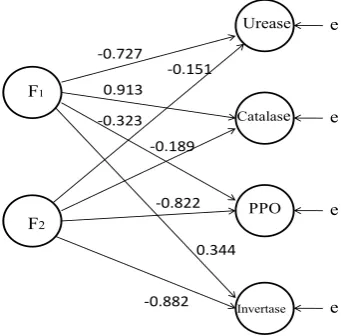
Cluster analysis was applied to the enzyme activities for different seasons (Figure 2). The enzyme activities were similar during the pre-monsoon and post-monsoon seasons, but different during the winter season. The difference in soil enzyme activities may be attributed to differences in temperature during the seasons, winter being the coldest month. PCA was also applied to the enzyme activities (Table 3). The first two components of PCA explained more than 99% of the total variance for the pre-monsoon (86.32% and 12.97%), post-monsoon (93.59% and 6.02%) and winter seasons (96.07% and 3.91%), respectively. In factor analysis, two factors were mainly responsible for soil enzyme activities (Figure 3). Factor-1 accounted for 39% of the total variance and had negative loading on urease, but positive loading on catalase, with communalities 0.551 and 0.869. This factor indicates the fertility of the soil. Invertase and PPO had 7
Figure 2Cluster analysis of enzyme activities for different seasons
F1
F2
e
e
e
e Urease
Catalase
PPO
Invertase
-0.727
0.913 -0.323
0.344 -0.151
-0.189
-0.822
-0.882
Figure 3 Factor analysis of soil enzymes in the different seasons
7
Figure 2Cluster analysis of enzyme activities for different seasons
F1
F2
e
e
e
e Urease
Catalase
PPO
Invertase
-0.727
0.913 -0.323
0.344 -0.151
-0.189
-0.822
-0.882
Figure 3 Factor analysis of soil enzymes in the different seasons
Figure 2: Cluster analysis of enzyme activities for different seasons
Figure 3: Factor analysis of soil enzymes in the different seasons
Malaysian Journal of Soil Science Vol. 20, 2016
140
negative loadings on factor-2 which accounted for 37% of the total variance with communalities 0.896 and 0.780. This factor accounts for decomposition of soil matter.
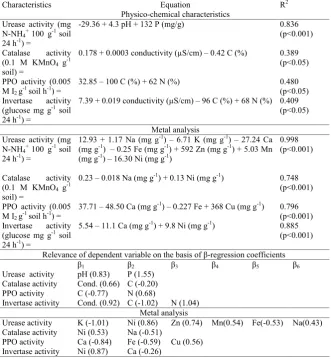
In stepwise MLR analysis (Table 4), 83.6% of urease activity was accounted for by pH and P, and in metal analysis, 99.8% of urease activity was accounted for by Na, K, Ca, Fe, Zn, Mn and Ni. Urease activity is largely dependent on P, and P is the most important component of animal and human excreta. Ni is the prosthetic group of urease, and Ni contributes maximum to urease activity. Dependence of catalase activity on conductivity and C was explained to the extent of 38.9% of the variation, and in metal analysis, 74.8% of catalase activity was accounted for by Na and Ni. Conductivity explained maximum variability in catalase activity, and in metal analysis, Ni was found to contribute maximum to the catalase activity. For PPO activity, 48% was accounted for by C and N, and in metal analysis 79.6% of the PPO activity was explained by Ca, Fe and Cu. N contributed maximum to the PPO activity. Cu is the prosthetic group of PPO, and contributed maximum to the activity of PPO. Dependence of invertase activity on conductivity, C and N was explained to the extent of 40.9%. In metal analysis, 88.5% of invertase activity was accounted for by Ca and Ni. Nitrogen explained the maximum variability in invertase activity, and in metal analysis, maximum variability was explained by Ni. Nayak et al., (2007) reported that the activities of soil enzymes are enhanced to different degrees by organic manure incorporation and noted significant and positive relationships of the enzyme activities with C and N. Sucrose, the substrate of soil invertase, is partially responsible for the breakdown of plant litter in the soil (Frankenberger and Johanson,1983). Urease enzyme is responsible for the hydrolysis of urea into NH3 and CO2. Urease activity indicates the N supply to the plants. Variations in the activity of urease enzyme are due to variations in the physcio-chemical characteristics of the soil, organic matter and N accumulation, considered as substrates for soil urease. PPO has a very important function in the cycling of aromatic compounds. Soil catalase is considered to be a potential indicator of aerobic microbial activity and has been related to the number of micro-organisms and soil fertility (Trasar-Cepeda et al., 1999). Heavy metals inhibit enzyme reactions by forming complexes
4
Cr (mg/g) 0.023±0.004 0.022±0.003 0.022±0.004 0.088 ns
Cu (mg/g) 0.020±0.007 0.016±0.004 0.016±0.003 0.981 ns
ns = not significantand ‘*’= significant at p< 0.05.
Table 2 Soil enzyme activities of Beas river bed for pre-monsoon, post-monsoon and winter seasons.
Characteristics Pre-monsoon season
Mean±SD
Post-monsoon season
Mean±SD
Winter Season
Mean±SD
F-Ratio
*(p<0.05) HSD (p<0.05)
Urease mg N-NH4+ 100 g-1 soil24 h-1 7.34
ab±0.94 7.09b±0.96 11.51a±3.32 3.99* 4.31
Catalase 0.1 M KMnO4 g-1 soil
0.154b±0.028 0.25a±0.036 0.167b±0.023 18.22* 0.042
PPO 0.005 M I2 g-1
soil h-1 22.25
ab±2.18 20.35b±3.52 25.40a±1.97 5.91* 3.44
Invertase glucose
mg g-1 soil 24 h-1 2.82
c±0.67 3.75a±0.52 4.37a±2.23 8.33* 0.82
Values with same superscript or no superscript in the same row imply that the values are not significantly different from each other at p<0.05.
Table 3 Percent variance explained of soil enzyme activities for different seasons from Beas river bed.
Seasons
Principal component
PC1 PC2 PC1+PC2
Pre-monsoon season 86.32% 12.97% 99.29%
Post-monsoon season 93.59% 6.02% 99.61%
Winter season 96.07% 3.91% 99.98%
Table 4 Stepwise multiple regression of soil enzyme activities with soil characteristics TABLE 3
Percent variance explained of soil enzyme activities for different seasons from Beas river bed.
Malaysian Journal of Soil Science Vol. 20, 2016 141
with their substrates or blocking functional groups of the enzymes (Speir et al., 1995). A negative relationship of metals, i.e., Fe, Na, K and Ca with enzyme activities, indicates that microbes secreting these enzymes are sensitive to the metal concentration in the soil. Compared to the pre-monsoon and post-monsoon seasons, enzyme activities were found to be higher during the winter season. This may be due to high nitrogen and phosphorus contents in the soil, and slow litter decomposition during this season. Boerner et al., (2005) and Mukhopadhyay and Joy (2010) studied the variations in soil enzyme activities with respect to seasons. High soil organic content was responsible for higher enzyme activities in the upper layer of soil (Hu et al., 2005). ANN models fitted well with the observed and the simulated data (Figures 4 a, b, c and d). The correlations between target and output values from ANN for catalase, urease, PPO and invertase were highly
TABLE 4
Stepwise multiple regression of soil enzyme activities with soil characteristics 5
Post-monsoon season 93.59% 6.02% 99.61%
Winter season 96.07% 3.91% 99.98%
Table 4 Stepwise multiple regression of soil enzyme activities with soil characteristics
Characteristics Equation R2
Physico-chemical characteristics
Urease activity (mg
N-NH4+ 100 g-1 soil
24 h-1) =
-29.36 + 4.3 pH + 132 P (mg/g) 0.836
(p<0.001)
Catalase activity
(0.1 M KMnO4 g-1 soil) =
0.178 + 0.0003 conductivity (µS/cm) –0.42 C (%) 0.389
(p<0.05)
PPO activity (0.005 M I2 g-1 soil h-1) =
32.85 –100 C (%) + 62 N (%) 0.480
(p<0.05)
Invertase activity
(glucose mg g-1 soil
24 h-1) =
7.39 + 0.019 conductivity (µS/cm) –96 C (%) + 68 N (%) 0.409 (p<0.05)
Metal analysis Urease activity (mg
N-NH4+ 100 g-1 soil
24 h-1) =
12.93 + 1.17 Na (mg g-1) –6.71 K (mg g-1) – 27.24 Ca (mg g-1) –0.25 Fe (mg g-1) + 592 Zn (mg g-1) + 5.03 Mn (mg g-1) –16.30 Ni (mg g-1)
0.998 (p<0.001)
Catalase activity
(0.1 M KMnO4 g-1 soil) =
0.23 –0.018 Na (mg g-1) + 0.13 Ni (mg g-1) 0.748 (p<0.001)
PPO activity (0.005 M I2 g-1 soil h-1) =
37.71 –48.50 Ca (mg g-1)–0.227 Fe + 368 Cu (mg g-1) 0.796 (p<0.001)
Invertase activity
(glucose mg g-1 soil
24 h-1) =
5.54 –11.1 Ca (mg g-1) + 9.8 Ni (mg g-1) 0.885
(p<0.001)
Relevance of dependent variable on the basis of β-regression coefficients
β1 β2 β3 β4 β5 β6
Urease activity pH (0.83) P (1.55)
Catalase activity Cond. (0.66) C (-0.20)
PPO activity C (-0.77) N(0.68)
Invertase activity Cond. (0.92) C (-1.02) N(1.04)
Metal analysis
Urease activity K (-1.01) Ni(0.86) Zn (0.74) Mn(0.54) Fe(-0.53) Na(0.43)
Catalase activity Ni(0.53) Na(-0.51)
PPO activity Ca (-0.84) Fe (-0.59) Cu(0.56)
Invertase activity Ni(0.87) Ca (-0.26)
Malaysian Journal of Soil Science Vol. 20, 2016
142
8
Catalase (Target) vs. Catalase (Output) Train(r=0.983), Test(r=0.894), Validation(r=0.823)
0.06
0.080.100.120.140.160.180.200.220.240.260.280.300.320.340.360.38 Catalase (Target) 0.06 0.08 0.10 0.12 0.14 0.16 0.18 0.20 0.22 0.24 0.26 0.28 0.30 0.32 0.34 0.36 C at al as e ( O ut pu t)
Urease (Target) vs. Urease (Output) Train(r=0.978), Test(r=0.690), Validation(r=0.946)
2 4 6 8 10 12 14 16 18 20 22 24 26 28 30 Urease (Target) 0 2 4 6 8 10 12 14 16 18 20 22 24 26 28 U reas e ( O ut put )
PPO (Target) vs. PPO (Output) Train(r=0.989), Test(r=0.908), Validation(r=0.947)
16 17 18 19 20 21 22 23 24 25 26 27 28 29 30 31 32 PPO (Target) 15 16 17 18 19 20 21 22 23 24 25 26 27 28 29 30 31 32 PP O (O ut put )
Invertase (Target) vs. Invertase (Output) Train(r=0.983), Test(r=0.887), Validation(r=0.820)
1.0 1.5 2.0 2.5 3.0 3.5 4.0 4.5 5.0 5.5 6.0 Invertase (Target) 1.0 1.5 2.0 2.5 3.0 3.5 4.0 4.5 5.0 5.5 6.0 Inv er tas e ( O ut put ) 8
Catalase (Target) vs. Catalase (Output) Train(r=0.983), Test(r=0.894), Validation(r=0.823)
0.06
0.080.100.120.140.160.180.200.220.240.260.280.300.320.340.360.38 Catalase (Target) 0.06 0.08 0.10 0.12 0.14 0.16 0.18 0.20 0.22 0.24 0.26 0.28 0.30 0.32 0.34 0.36 C at al as e ( O ut pu t)
Urease (Target) vs. Urease (Output) Train(r=0.978), Test(r=0.690), Validation(r=0.946)
2 4 6 8 10 12 14 16 18 20 22 24 26 28 30 Urease (Target) 0 2 4 6 8 10 12 14 16 18 20 22 24 26 28 U reas e ( O ut put )
PPO (Target) vs. PPO (Output) Train(r=0.989), Test(r=0.908), Validation(r=0.947)
16 17 18 19 20 21 22 23 24 25 26 27 28 29 30 31 32 PPO (Target) 15 16 17 18 19 20 21 22 23 24 25 26 27 28 29 30 31 32 PP O (O ut put )
Invertase (Target) vs. Invertase (Output) Train(r=0.983), Test(r=0.887), Validation(r=0.820)
1.0 1.5 2.0 2.5 3.0 3.5 4.0 4.5 5.0 5.5 6.0 Invertase (Target) 1.0 1.5 2.0 2.5 3.0 3.5 4.0 4.5 5.0 5.5 6.0 Inv er tas e ( O ut put )
significant, implying that ANN can simulate enzyme activities based on soil characteristics.
CONCLUSION
From the present study, it was established that maximum activities of enzymes occur in the winter season. Cluster analysis revealed that enzyme activities were similar during the pre-monsoon and post-monsoon seasons. Factor analysis showed that factor-1 influences the fertility of the soil, whereas factor-2 is responsible for the decomposition of soil organic matter. In SMLR analysis, phosphorus explained maximum variability in urease activity and it to be noted that P is the most important component of human and animal excreta. Nickel is the prosthetic group of urease and contributes maximum to the activity of urease. Similarly Cu is the prosthetic group of polyphenol oxidase enzyme which contributes to the activity of this enzyme.
Figure 4(b): Correlation between target and output urease enzyme using ANN
model
Figure 4(c): Correlation between target
and output PPO enzyme using ANN model Figure 4(d): Correlation between target and output invertase enzyme using ANN model
Figure 4(a): Correlation between target and output catalase enzyme using ANN
model
Malaysian Journal of Soil Science Vol. 20, 2016 143 ACKNOWLEDGEMENTS
The authors are thankful to the Head, Department of Botanical & Environmental Sciences, for providing research facilities. VK is also thankful to the University Grants Commission, New Delhi, for providing financial assistance under the Programme on University with Potential for Excellence.
REFERENCES
Asmar, F., F. Eiland and N.E. Nielson. 1992. Interrelationship between extracellular enzyme activity, ATP content, total counts of bacteria and CO2 evolution. Biol.
Fertil. Soils. 14: 288–292.
Boerner, R.E.J., J.A. Brinkman and A. Smith. 2005. Seasonal variations in enzyme activity and organic carbon in soil of a burned and unburned hardwood forest. Soil Biol. Biochem. 37: 1419–1426.
Burns, R.G. 1982. Enzyme activity in soil: Location and a possible role in microbial ecology. Soil Biol. Biochem. 14: 423-427.
Burns, R.G. 1983. Extracellular enzyme-substrate interactions in soil. In: J. H. Slater, R. Whitten bury, J. W. T Winpenny (eds.) Microbes in Their Natural Environment. p. 249-298. Cambridge University Press, Cambridge, UK.
Burns, R.G. 1986. Interaction of enzymes with soil mineral and organic colloids, in: P.M. Huang, M. Schnitzer (eds.) Interactions of Soil Minerals with Natural Organics and Microbes., p. 429-452. Soil Science Society of America Inc., Madison.
Frankenberger, T.W. and J.B. Johanson. 1983. Factors affecting invertase activity in soils. Plant Soil. 74: 313–323.
Gu, Y., P. Wang and C.H. Kong. 2009. Urease, invertase, dehydrogenase and polyphenol oxidase activities in paddy soil influenced by allelopathic rice variety. Eur. J. Soil Biol. 45: 436–441.
Guan, S., D. Zhang and Z. Zhang. 1986. Soil Enzyme and its Research Methods. Agriculture Press, Beijing.
Guan, S.Y. 1986. Soil Enzymes and Its Methodology., p. 274–340. Agricultural Press, Beijing.
Hu, Y. L., S.L. Wang, S.K. Yan and H. Gao. 2005. Effects of replacing natural secondary broadleaved forest with Cunninghamia lanceolata plantation on soil biological activities (in Chinese). Chin. J. Appl. Ecol. 16: 1411–1416.
Malaysian Journal of Soil Science Vol. 20, 2016
144
Kumar, V., A. Sharma, R. Bhardwaj and A. K. Thukral. 2016. Monitoring and characterization of soils from river bed of Beas, India, using multivariate and remote sensing techniques. Br. J. Appl. Sci. Technol. 12(2): 1-12.
Marinari, S. and L.V. Antisari. 2010. Effect of lithological substrate on microbial biomass and enzyme activity in brown soil profiles in the northern Apennines (Italy). Pedobiologia. 53: 313–320.
Mobley, H.L.T. and R.P. Hausinger. 1989. Microbial urease: significance regulation and molecular characterization. Microbiol. Rev. 53: 85–108.
Mondal, K.N., C.K. Pal, M. Dey, S. Ghosh, C. Das and K.J. Datta. 2015. Seasonal variation of soil enzymes in areas of fluoride stress in Birbhum District, West Bengal, India. J. Taibah Uni. Sci. 9:133-142.
Mukhopadhyay, S. and V.C. Joy. 2010. Influnence of leaf types on microbial functions and nutrient status of soil: ecological suitability of forest trees for afforestation in tropical laterite wastelands. Soil Biol. Biochem. 42: 2306–2315.
Nayak, D.R., B.Y. Jagadeesh and T.K. Adhya. 2007. Long-term application of compost influences microbial biomass and enzyme activities in a tropical Aeric Endoaquept planted to rice under flooded condition. Soil Biol. Biochem. 39: 1897–1906.
Rahmansyah, M. and I.M. Sudiana. 2010. Soil microbial enzymatic activity relate to role of methanotrophic bacteria in tropical forest soil, Gunung Salak National Park. Agr. Biol. Sci. 5(2): 51-57.
Rodriguez-Kabana, R. and B. Truelove. 1982. Effects of crop rotation and fertilization on catalase activity in a soil of the southeastern United States. Plant Soil. 69: 97–104.
Schoenholtz, S.H., H. Van Miegroet and J.A. Burger. 2000. A review of chemical and physical properties as indicators of forest soil quality: Challenges and opportunities. Forest Ecol. Manag. 138: 335-356.
Shi, J.Z., Y. Lu, Z.G. Xu and S.L. Fu. 2008. Enzyme activities of urban soils under different land use in the Shenzhen city, China. Plant Soil Environ. 54(8): 341-346.
Sinsabaugh, R.L., R.K. Antibus and A.E. Linkins. 1991. An enzymic approach to the analysis of microbial activity during plant litter decomposition. Agric. Ecosyst. Environ. 34: 43–54.
Malaysian Journal of Soil Science Vol. 20, 2016 145
Speir, T.V., H.A. Kettles, A. Parshotam, P.L. Searle and L.N.C. Vlaar. 1995. A simple kinetic approach to derive the ecological dose value ED 50, for the assessment of Cr (VI) toxicity to soil biological properties. Soil Biol. Biochem. 27: 801-811.
Trasar-Cepeda, C., M.C. Leirós and F. Gil-Sotres. 2008. Hydrolityc enzyme activities in agricultural and forest soils. Some implications for their use as indicators of soil quality. Soil Biol. Biochem. 40: 2146-2155.
Trasar-Cepeda, F.C., M.C., Camina, F. Leiros and G. Sotres. 1999. An improved method to measure catalase activity in soils. Soil Biol. Biochem. 31: 483–485.
Zhang, B.C., X.B. Zhou and Y.M. Zhang. 2015. Responses of microbial activities and soil physio-chemical properties to the successional process of biological soil crusts in the Gurbantunggut Desert, Xinjiang. J. Arid Land. 7(1): 101-109.