Sensitivity analysis of weight
reduction results of an
obser-vational cohort study in
over-weight and obese children and
adolescents in Germany: the
EvAKuJ Study
Thomas Böhler,1Cornelia Goldapp,2 Reinhard Mann,2Thomas Reinehr,3 Monika Bullinger,4Reinhard Holl,5 Ulrike Hoffmeister,5 Andreas van Egmond-Fröhlich,6
Ulrike Ravens-Sieberer,7Nora Wille7 Joachim Westenhöfer,8Jürgen Bengel9 1Medical Service of Statutory Health Insurance Baden-Württemberg, Karlsruhe, Germany; 2Federal Centre for Health Education, Köln, Germany; 3Vestische Kinder- und Jugendklinik, University of Witten-Herdecke, Datteln, Germany; 4Department of Medical Psychology, University Clinic Hamburg-Eppendorf, Hamburg, Germany; 5Institute of Epidemiology and Medical Biometry, University of Ulm, Germany; 6SMZ Ost, Department of Pediatrics, Donauspital, Vienna, Austria; 7Research Section Child Public Health, Department of
Psychosomatics in Children and Adolescents, University Clinic Hamburg-Eppendorf, Hamburg, Germany; 8Department for Health Sciences, University of Applied Sciences, Hamburg, Germany; 9Department of Rehabilitation Psychology and Psychotherapy, Institute of Psychology, University of Freiburg, Germany
Abstract
In the German EvAKuJ observational cohort study, changes in the body mass index stan-dard deviation score (BMI-SDS) of overweight and obese children and adolescents as primary outcome of multimodal (short, inpatient or long, outpatient) weight-loss interventions are difficult to interpret. Published intention-to-treat(ITT) and per protocoldata obtained at the end of the intervention (T1), one year (T2), and two years (T3) after its end were used for
sensitivity analysis of treatment success rates. The odds ratio and the number needed to treat (NNT) for BMI-SDS reduction of at least −0.2 (successful treatment) and at least −0.5 (good treatment success) were related to sponta-neous BMI-SDS reduction rates in a hypothet-ical control group (control event rate, CER). At
T1, treatment seems to be effective up to a CER
of 10% in inpatients and of 5% in outpatients. ITT analysis, compromised by a loss to follow-up of 81 to 90% (inpatients) and 57 to 66% (outpatients), indicated that treatment may become less effective at a CER above 1% in inpatients (e.g., successful treatment at T2: NNT=106, at T3: NNT=51), and above 5% in outpatients (successful treatment at T2:
NNT=7, at T3: NNT=8; good treatment success
at T2 and T3: NNT=25). Positive short-term effects of inpatient treatment of overweight and obese children and adolescents may not be maintained in the long term. Long-term effec-tiveness of outpatient treatment may depend on age and the degree of overweight.
Introduction
According to the German KiGGS study,18.7%
of children and adolescents with an age between 3 and 17 years are overweight, and an additional 6.3% are obese. Thus, approximate-ly 1.1 million overweight and 800,000 obese children and adolescents are actually living in Germany. Several different interventions of obesity treatment and secondary and tertiary prevention of obesity-related diseases are rou-tinely applied to these patients.2 In recent
years several studies on elements of care of overweight and obese children and adoles-cents have been performed and results of these trials have recently been summarised.3,4
Despite the considerable differences found in the level of available external evidence between these elements, the reviews recom-mend multimodal interventions which include parents and members of the family or the com-munity (such as schoolmates, teachers and caterers in schools). The interventions should simultaneously address aspects of nutrition (including food quality) and physical activity (aiming at a change from a sedentary to a more active lifestyle including sports). To reach these aims, the interventions should use behavior management principles and tech-niques and rely upon parents and school teach-ers as agents of change.5Before the
interven-tion begins, motivainterven-tion of the child, adoles-cent, and the family should be assessed and eventually enhanced.
In Germany, inpatient treatment of 4 to 6 weeks’ duration is offered in pediatric rehabil-itation clinics and is financed by the German Pension Funds (Deutsche Rentenversicherung) and by the German Statutory Health Insurance Funds (Gesetzliche Krankenversicherung, GKV). Allocation to inpatient treatment of overweight and obese children and adoles-cents follows criteria based on the bio-psycho-social model of overweight and obesity in
youth.6The GKV additionally offer structured
patient education and training programs of 6 to 12 months duration as part of outpatient treatment for overweight and obese children.7
Access to such a program is usually granted according to a national consensus statement of representatives of GKV, health care providers, and federal health authorities in the following circumstances:8 i) for extremely obese patients
with a BMI above the 99.5thpercentile; ii) for
obese patients with a BMI above the 97thand
up to the 99.5th percentile, if additional risk
factors (insulin resistance, hypercholes-terolemia, family disposition for diabetes mel-litus type 2, myocardial infarction, or stroke) or illnesses related to increased body weight (arterial hypertension, diabetes mellitus type Correspondence: Thomas Böhler, MDK BadenWürttemberg BBZ Karlsruhe, Steinhäuser -strasse 7a, D-76135 Karlsruhe, Germany. Tel. +49.0721.91261.4500 - Fax: +49.0721.91261.4554. E-mail: [email protected]
Key words: patient education, rehabilitation, body-mass-index, STROBE statement.
Acknowledgments: the EvAKuJ Study was funded by the BZgA. Its results were obtained by the members of the study group in collaboration with providers of treatment programs listed in the Appendix (Study Group and Treatment Centers). Interim results of the study have been presented in yearly intervals at the meeting of the German Obesity Society (Deutsche Adipositas-Gesellschaft) and were published as shown in the Appendix (Publications of the Study Group). A glossary lists definitions of frequently used terms and abbreviations in the Appendix. Components of the interventions for inpatients and outpa-tients are shown in the Appendix.
Contributions: the authors contributed equally.
Conflicts of interests: TB has been involved in accreditation of providers of ambulatory patient education and training programs for obese chil-dren and adolescents by German Statutory Health Care Funds. CG and RM were involved in design-ing the EvAKuJ study and provided its financial frame; they were advised by TB and JB. TR, AvEF and JW offered inpatient or outpatient weight-reduction programs for children and adolescents.
Received for publication: 9 June 2013. Accepted for publication: 30 September 2013.
This work is licensed under a Creative Commons Attribution NonCommercial 3.0 License (CC BY-NC 3.0).
©Copyright T. Böhler et al., 2013 Licensee PAGEPress, Italy Pediatric Reports 2013; 5:e16 doi:10.4081/pr.2013.e16
Non-commercial
2, disturbed glucose tolerance, premature onset of puberty, polycystic ovary syndrome, orthopedic symptoms) are involved; iii) for overweight patients with a BMI above the 90th
and up to the 97thpercentile with one or more
of the previously listed illnesses if they require specific treatment.
The Federal Centre of Health Education in Germany (Bundeszentrale für gesundheitliche Aufklärung, BZgA) had calculated in 2004 and 2005 that each year an estimated number of 44,000 children, adolescents, and their care-givers participated in more than 700 interven-tion programs for inpatients and/or outpa-tients.2 These programs are complex health
interventions,9whose long-term effectiveness
has not yet been convincingly demonstrated.3,4
In 2005, the BZgA therefore initiated a project for evaluation of obesity treatment in children and adolescents in Germany (Evaluation der
Adipositastherapie bei Kindern und
Jugendlichen in Deutschland; EvAKuJ). The study project was aiming at longitudinal obser-vation of a cohort of overweight and obese chil-dren and adolescents receiving therapeutic interventions by randomly selected providers (see Appendix for the complete list of publica-tions).10The study was planned and organized by the EvAKuJ Study Group (Appendix), who performed analysis and published reports of all available data in yearly intervals. The study was solicited, financed, registered, and moni-tored by the BZgA. Study protocol and results as well as contact data of the participating health care providers (Appendix) had been made available to the public (http://www.bzga-kinderuebergewicht.de).
The study recruited patients from July 2005 until September 2006 with the intention to fol-low them up for 2 years thereafter. The base-line characteristics of the study cohort have been extensively described (Appendix) and outcome data at the end of the intervention (Appendix) and at least one year after the com-pletion of the intervention (Appendix) have been published by the EvAKuJ study group.10
Concentrating on the primary outcome vari-able, we present a detailed analysis of short-term, mid-term and long-term changes of body-mass-index (BMI) standard deviation scores (SDS) from baseline until approximately two years after the end of the intervention, in the inpatient and the outpatient treatment setting. Sensitivity analysis of the data collected by the EvAKuJ Study group allowed us to present these results according to criteria of evidence-based reporting of observational studies and to discuss them using a model for implementa-tion of complex health intervenimplementa-tions that has recently been refined.9-14
Materials and Methods
The EvAKuJ study was conducted by a multi-disciplinary research team (EvAKuJ Study Group, Appendix) as an observational multi-center cohort study. Out of 477 providers of multimodal weight reduction interventions, who had in part been identified during a pre-ceding study and who were contacted by the research team,2135 declared their interest to
participate in the study and to recruit patients without any financial benefit or other incen-tives. Of these, 52 providers were chosen by chance. These providers were classified as
belonging to one out of six clusters of treat-ment (see glossary in the Appendix). It was initially estimated that at least 300 patients had to be recruited into interventions in each cluster. Thus, a sample size of 1800 was assumed to be sufficient for assessment of treatment success rates and their comparative analysis between clusters.
Each provider independently included patients into the study if they were between 8 and 16 years old and had a BMI above the 90th
percentile for sex and age at baseline.15
Furthermore, at least data from one of the psy-chometric questionnaires (Appendix) − assessing aspects of health-related quality of
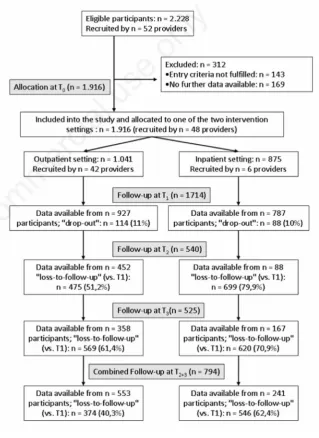
Figure 1. Flow diagram showing patient recruitment and follow-up in the EvAKuJ study. Data on combined follow-up at any time point after the end of the intervention (T2+3)
are not reported here but were used in a previous publication of the EvAKuJ Study Group (Appendix).
Non-commercial
life, eating behavior and food frequency, phys-ical behavior and leisure activity − had to be provided at baseline, i.e.before entering the study. At baseline (time point T0), at the end of the intervention (time point T1), and
approxi-mately one year after the end (time point T2)
and two years after the end (time point T3),
each patient’s actual body height and weight were either measured or obtained from files together with information on blood pressure, blood glucose, and lipid status. In addition, psy-chometric questionnaires had to be completed as described (Appendix).
Recruitment was oriented at 300 patients per cluster and was open for all clusters between July 2005 and September 2006. However, the estimated sample size of 300 patients was reached only in two clusters. In retrospect, the short half-lifeof providers of weight-loss interventions for children and ado-lescents in Germany was identified as one potential cause of this observation: each year, approximately 10% of the providers included in the assessment of the BZgA in 2004 and 2005 had ceased their activities mostly due to eco-nomic reasons (Appendix).2,10Thus,
compara-tive cluster analysis was not possible. Therefore, during post hoc analysis, those 48 providers who actively participated in the study were allocated to either the inpatient or the outpatient treatment setting, using the dura-tion of the intervendura-tion as denominator. A duration of less than 3 months (shorttherapy) indicated inpatient treatment in a rehabilita-tion clinic, while durarehabilita-tion of more than 3 months (longtherapy) corresponded to outpa-tient treatment usually by a multidisciplinary team.
The timeline of the study and the typical interventions and processes in both treatment settings are described in the Appendix. Since data on structures and processes in the differ-ent treatmdiffer-ent cdiffer-enters were lacking, in the Appendix we used a published blueprint for standard treatment schemes in order to describe the two treatment modalities which were compared post hoc.6According to Perera
et al.,16components of complex interventions
are regarded either as objects of fixed nature (Appendix, squared brackets), or as activities with a certain flexibility (represented by parentheses). As further specified in the Appendix, a behavioral weight control program corresponding to current national guidelines was offered in both settings.17 The general
aims were to reduce energy intake, diminish sedentary behavior, and increase physical activity of overweight and obese children and adolescents. Intervention methods included behavior modification techniques such as self-monitoring with food and activity diaries, goal setting, stimulus control and positive rein-forcement. In the outpatient setting, children, adolescents, and their families were targeted,
while in the inpatient setting the instruction of parents in behavior management principles was not the main focus of the interventions.
As reported before (Appendix),10 1916 patients had finally been recruited into the EvAKuJ study and had been allocated to one of the two treatment settings. Comparison of baseline data had shown significant
differ-ences between both patient groups: outpa-tients were slightly younger and had lower BMI-SDS values than inpatients (Appendix).10
Patient allocation and follow-up is summarized in Figure 1. The number of patients who did not complete the assigned treatment or who did not participate in the final assessment (or whose data were not transmitted to the study
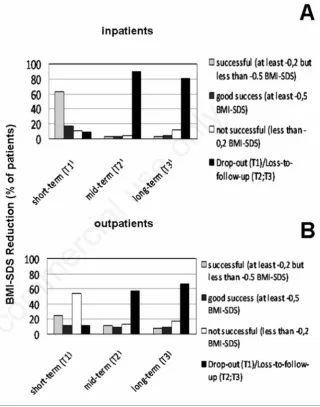
Figure 2. Short-term, mid-term, and long-term effects of obesity treatment on body-mass-index standard deviation scores (BMI-SDS) in an inpatient setting (A) or an outpatient setting (B) as reported by the EvAKuJ Study Group (Appendix). Treatment was classified as successful if a patient reduced his or her BMI-SDS of at least -0.2 but less than -0.5. BMI-SDS reduction of at least -0.5 was classified as good treatment success. Patients with BMI-SDS reduction of less than -0.2, no reduction at all, or an increase in BMI-SDS were grouped as not successful. The percentages of patients achieving these predefined changes in BMI-SDS were calculated using an Intention-to-Treat (ITT)-approach (i.e., counting patients who dropped out or were lost to follow-up as not successful). Short-term outcome data stem from measurements at the end of treatment (time point T1) in 787 patients in
the inpatient setting (91% of 875 participants who were initially recruited) and 927 patients in the outpatient setting (89% of 1041 participants who were initially recruited). Mid-term outcome data stem from measurements one year after the end of treatment (time point T2) in 88 patients in the inpatient setting (10% of 875 participants who were initially recruited) and 452 patients in the outpatient setting (43% of 1041 participants who were initially recruited). Long-term outcome data stem from measurements two years after the end of treatment (time point T3) in 167 patients in the inpatient setting (19% of
875 participants who were initially recruited) and 358 patients in the outpatient setting (34% of 1041 participants who were initially recruited).
Non-commercial
center) at the end of the intervention (T1) is
labeled as drop-out. The number of patients who did not participate in the assessments one (T2) or two (T3) years after the end of the intervention − or whose data were not trans-mitted to the study center − is labeled as loss-to-follow-up. At the end of the intervention there were no significant differences in age, gender distribution, and BMI-SDS at baseline (T0) between patients who completed the intervention and those who dropped out, whereas patients who completed the interven-tion and participated in the follow-up assess-ments were slightly younger and had a signifi-cantly lower BMI-SDS at baseline than those lost to follow-up (Appendix).10
In the EvAKuJ Study, treatment success had been defined according to the national consen-sus statement as a reduction in the body-mass-index standard deviation score (BMI-SDS) of at least −0.2;8 good treatment success had
been defined as a reduction in BMI-SDS of at least −0.5. Treatment success rates in both set-tings at different time points have been pub-lished by the EvAKuJ Study Group10 (Appendix)
both per protocol(pP; complete-case analysis) and as intention-to-treat (ITT) analysis (Appendix for definitions); these data are summarized in Figure 2. The following calcula-tions had been performed separately for both treatment settings: i) short-term treatment success at the end of the intervention as the difference between the measurements at time points T0and T1; ii) mid-term treatment suc-cess approximately one year after the end of the intervention as the difference between the measurements at time points T0and T2; iii) long-term treatment success approximately two years after the end of the intervention as the difference between the measurements at time points T0and T3.
All ITT calculations included patients who either dropped out(and did not complete the assigned intervention) or did not respond to the request for data communication and were thus lost to follow-up. All pP calculations included only completers, i.e., patients whose baseline and follow-up data at a defined time point were available. Due to a high loss to fol-low-up of patients at T2and T3 the results of both calculations indicated different success rates:10when analyzed pP, 60% of the patients
were successful at the end of the intervention (T1), 45% one year later (T2), and 50% after two years (T3). In the corresponding ITT
analy-sis, 56% of the originally recruited 1.916 patients successfully completed the assigned intervention with a BMI-SDS reduction of at least −0.2 at T1, but only 13% and 14% contin-ued to show this reduction one (T2) or two (T3)
years later, respectively. In addition, the design of the EvAKuJ Study did not allow to document the spontaneous development of BMI-SDS over
time in untreated overweight and obese chil-dren and adolescents − a fact which renders interpretation of study results by both ITT and pP analysis difficult.
In order to compensate for the large propor-tion of patients with missing data (drop-out and loss to follow-up at mid-term: 90% of the inpatients and 57% of the outpatients; drop-out and loss to follow-up at long-term: 81% of the inpatients and 66% of the outpatients) and to overcome the lack of an appropriate control group, we performed sensitivity analysis to
describe possible health policy implications of the study results published by the EvAKuJ Study Group. To this purpose we calculated the odds ratio (OR) for successful treatment (BMI-SDS reduction of at least -0.2 and -0.5, respec-tively) using the odds ratio calculator available at http://www.hutchon.net/ConfidORnulhypo. html, under the following assumptions: i) crude numbers of successful and unsuccessful participants at T1, T2and T3were given
sepa-rately for inpatients and outpatients and for the two modes of calculation (ITT and pP); ii)
Figure 3. Odds ratios (OR) and upper and lower limits of 95% confidence intervals (CI) for successful obesity treatment [reduction of body-mass-index standard deviation scores (BMI-SDS) of at least -0.2] as a function of different categories of control event rates (CER) in a hypothetical group of untreated children and adolescents in the inpatient set-ting (A, C, and E) and the outpatient setset-ting (B, D, and F) of the EvAKuJ study. OR cal-culated using the Intention-to-Treat (ITT)-approach (i.e., counting patients who dropped out or were lost to follow-up as not successful) are indicated by black dots and solid lines, those calculated by the per protocol (pP)-approach (i.e., omitting patients who dropped out or were lost to follow-up from the calculation of treatment success rates) as grey circles and punctuated lines. T1, T2, and T3 indicate different time points
of follow-up: T1means approximately 6 weeks of follow-up in inpatients (A) and
approx-imately 12 months of follow-up in outpatients (B), T1 indicates data obtained about one year after the end of the intervention in both treatment settings (C and D), and T3 stands for data obtained about two years after the end of the intervention in both treatment set-tings (E and F).
Non-commercial
a hypothetical control group with identical numbers of observations as the treatment groups was included; iii) in the hypothetical control group of untreated patients, a reduc-tion of BMI-SDS of at least -0.2 or -0.5 was thought to occur spontaneously in 0.1%, 0.5%, 1%, 5%, 10% and 20% at T1, T2and T3(control
event rate, CER).
This method allowed us to depict the OR for successful treatment together with its 95% confidence interval − obtained from data pub-lished by the EvAKuJ Study Group − as a func-tion of the CER in the hypothetical control group. Calculations were performed using Microsoft Excel 2003 for Windows.
The number of patients who had to be exposed to the intervention in order to see a reduction in BMI-SDS of at least –0.2 or –0.5 in one additional patient (number needed to ben-efit from treatment; NNT) was calculated as described,18,19using the same crude numbers
of successful and unsuccessful participants and hypothetical control event rates for BMI-SDS reduction of at least −0.2 or −0.5 which were used for calculation of the OR for each time point and setting. The absolute risk of not reducing BMI-SDS was calculated for the treat-ment group and the respective hypothetical control group (for example, 20% for inpatients at T1, using the ITT approach for successful treatment = RT; 95% for the hypothetical con-trols without treatment at a CER of 5% = Rw/oT). The absolute risk reduction (ARR) due to treatment was calculated as the difference between Rw/oTand RT(in our example: 75) and
the NNT was calculated as 100/ARR (in our example: 1.33). The number needed to benefit from treatment is depicted as a function of the CER in the hypothetical control group. Calculations were performed using Microsoft Excel 2003 for Windows.
Results
Sensitivity analysis of published outcome data of the EvAKuJ study is summarized sepa-rately for inpatients and outpatients in Figure 3 (OR for BMI-SDS reduction of at least −0.2,
successful treatment), Figure 4 (OR for BMI-SDS reduction of at least −0.5, good treatment success), and in Figure 5 (the respective NNT), each variable as a function of the CER in the hypothetical control group (0.1%, 0.5%, 1%, 5%, 10%, and 20%) at the different time points of follow-up (T1, T2and T3).
At the end of the intervention (T1), only few
patients had dropped-out (88 inpatients and 114 outpatients) and ITT and pP analysis gave similar results in both treatment settings. OR for successful treatment are considerably higher in inpatients than in outpatients over
the whole CER range (Figure 3A, B). OR for good treatment success, however, are nearly identical (Figure 4A, B), indicating that short inpatient treatment of overweight and obese children and adolescents is more effective than longer outpatient treatment in reducing BMI-SDS of at least −0.2 but does not lead to a higher proportion of patients with a BMI-SDS reduction of at least −0.5 (good treatment suc-cess). As shown in Figure 5, this translates into similar NNT for good treatment success both in inpatients (Figure 5A) and outpatients
(Figure 5B), while NNT for BMI-SDS reduction of at least −0.2 were lower in inpatients.
OR decrease and NNT increase with CER above 1% in the hypothetical control group. This reflects the interdependency between the calculated treatment success rate and the background risk in the population.18At the end
of the intervention (T1) the lower estimate of the 95% confidence interval (lower 95% CI) of the calculated OR for a BMI-SDS reduction of at least −0.5 (Figure 4A, B) falls below 1.0 (indicating absence of effectiveness) at a CER
Figure 4. Odds ratios (OR) and upper and lower limits of 95% confidence intervals (CI) for good success in obesity treatment [reduction of body-mass-index standard deviation scores (BMI-SDS) of at least -0.5] as a function of different categories of control event rates (CER) in a hypothetical group of untreated children and adolescents in the inpa-tient setting (A, C, and E) and the outpainpa-tient setting (B, D, and F) of the EvAKuJ study. OR calculated using the Intention-to-Treat (ITT)-approach (i.e., counting patients who dropped out or were lost to follow-up as not successful) are indicated by black dots and solid lines, those calculated by the per protocol (pP)-approach (i.e., omitting patients who dropped out or were lost to follow-up from the calculation of treatment success rates) as grey circles and punctuated lines. T1, T2, and T3indicate different time points
of follow-up: T1means approximately 6 weeks of follow-up in inpatients (A) and
approx-imately 12 months of follow-up in outpatients (B), T1 indicates data obtained about one year after the end of the intervention in both treatment settings (C and D), and T3stands
for data obtained about two years after the end of the intervention in both treatment set-tings (E and F).
Non-commercial
of 20% (which seems to be a rather unrealistic estimation of the CER in the real life situa-tion). Under the assumption of a CER of 10% in inpatients (another unrealistic estimation in the real life situation of an intervention of 4 to 6 weeks’ duration), the calculated NNT for successful treatment is still considerably low (ITT: 14, pP: 12; Figure 5A). In outpatients after approximately one year of treatment a CER of 10% would, however, cause a steep increase of the NNT for a BMI-SDS reduction of at least −0.2 (Figure 5B). The NNT resulting from ITT analysis (n=96) would be rather high and the NNT resulting from pP analysis (n=41) would at least cast doubts on the effec-tiveness of such a treatment.19
Sensitivity analysis of mid-term (T2) and
long-term (T3) treatment success rates shows
much larger differences between ITT and pP results than the short-term success rates. One and two years after the end of the interven-tions, the majority of patients was lost to fol-low-up or had dropped-out (Figure 1). While ITT analysis was based on 875 inpatients and 1041 outpatients, pP analysis relied on 88 inpa-tients and 452 outpainpa-tients at T2, and 167
inpa-tients and 358 outpainpa-tients at T3. Thus, both
methods of data analysis give different results in sensitivity analysis, either in terms of OR for successful treatment or good treatment success (which are considerably lower using ITT analysis, Figures 3 and 4), or in terms of NNT (which are much higher in ITT analysis and increase steeply or even loose statistical significance at a CER above 1%; Figure 5). Data analysis pP yields significant positive OR for successful treatment (lower 95% CI above 1.0) over the whole CER range in both treat-ment settings (with the exception of BMI-SDS reduction of at least -0.5 in inpatients at T2,
assuming a CER of 20%; Figure 4C). ITT analy-sis at T2reveals that the lower 95% CI of the calculated OR for a BMI-SDS reduction of at least −0.2 (Figure 3C, D) decreases below 1.0 (indicating absence of effectiveness) at a CER of 5% in inpatients and of 20% in outpatients; for a BMI-SDS reduction of at least -0.5 they decrease below 1.0 at a CER of 5% in inpatients and of 10% in outpatients (Figure 4C, D). Similar results are obtained at T3(Figures 3
and 4).
Discussion
The EvAKuJ study aimed at longitudinal observation of overweight and obese children and adolescents in Germany for at least two years after exposure either to a hospital-based (short, inpatient) treatment for less than 3 months, or to an extended ambulatory (long, outpatient) education and training program
for approximately 12 months. Assessment of the patients directly after the end of the inter-vention suggested that especially inpatient treatment has the potential to effectively influ-ence body weight leading to a clinically signif-icant decrease in BMI-SDS. Yet, 11% of
inpa-tients and 54% of outpainpa-tients had either no rel-evant decrease or even an increase in BMI-SDS at the end of the intervention.16
According to the EvAKuJ Study Group (Appendix), the study provides data on short term changes after lifestyle interventions for
Figure 5. The number needed to treat (NNT) in order to achieve a reduction of body-mass-index standard deviation scores [BMI-SDS] of at least -0.2 (dots and circles) or -0.5 (filled and empty diamonds) in one additional patient as a function of different cate-gories of control event rates (CER) in a hypothetical group of untreated children and adolescents in the inpatient setting (A, C, and E) and the outpatient setting (B, D, and F) of the EvAKuJ study. NNT calculated using the Intention-to-Treat (ITT)-approach (i.e., counting patients who dropped out or were lost to follow-up as not successful) are indicated by black dots or filled diamonds and solid lines, those calculated by the per protocol (pP)-approach (i.e., omitting patients who dropped out or were lost to follow-up from the calculation of treatment success rates) as circles or empty diamonds and punctuated lines. The calculated NNT are shown in the tables below the x-axis of each plot. Empty cells in the tables indicate negative NNT, the corresponding symbols were omitted from the respective graph. T1, T2, and T3indicate different time points of
fol-low-up: T1means approximately 6 weeks of follow-up in inpatients (A) and
approxi-mately 12 months of follow-up in outpatients (B), T2 indicates data obtained about one year after the end of the intervention in both treatment settings (C and D), and T3stands
for data obtained about two years after the end of the intervention in both treatment set-tings (E and F). While NNT calculations using the ITT approach are based on 875 inpa-tients and 1041 outpainpa-tients, those based on the pP approach rely upon data from 787 inpatients and 927 outpatients at T1, 88 inpatients and 452 outpatients at T2, and 167
inpatients and 358 outpatients at T3.
Non-commercial
overweight and obese children and adoles-cents in Germany under real-life conditions, but long term outcomes cannot be examined because of the high loss to follow-up. The EvAKuJ Study Group concluded that: i) single overweight or obese children or adolescents may benefit in terms of weight loss from cur-rent lifestyle interventions in both treatment settings; ii) single interventions, which differ considerably in the way they are organized and financed, may yield distinct patterns of out-come; iii) differences in results between sin-gle providers may be influenced by available resources (e.g., personnel, space, equipment), therapeutic processes (e.g., frequency and intensity of treatment sessions, skills and pref-erences of specific providers), and patient case mix (different age, degree of overweight, socioeconomic background of the family, and general motivation for treatment); iv) reliable conclusions regarding the importance of inpa-tient and outpainpa-tient interventions (or ele-ments thereof) and the different treatment modalities outlined above cannot be drawn, due to the design of the EvAKuJ study.
A major problem is that 80% of the inpa-tients and 51% of the outpainpa-tients had dropped out or were lost to follow-up approximately one year after the end of the intervention. Another year later (i.e.,two years after the end of the intervention), combined drop-out and loss to follow-up were 71% among inpatients and 61% among outpatients. Such a loss of information on individual outcomes after treatment seri-ously jeopardizes any conclusion, including ITT analysis of treatment success rates. The fact that missing data in clinical trials on over-weight and obese subjects make analysis of trial results unreliable has been repeatedly dis-cussed in the literature.20,21Whenever
possi-ble, outcome data should be analyzed using the intention-to-treat (ITT) approach. The alterna-tive statistical approach, using complete case or per protocol(pP) analysis, does not allow a scientifically sound conclusion from the EvAKuJ trial. Imputation of missing values in longitudinal data analysis is not an option either. Lack of data precludes researchers to complete empty cells in the data matrix by model-driven plausible values, because they cannot be predicted from empirical evidence.22
However, neither the assumptions of the model nor the mechanism leading to missing values can be verified in real life data or field study settings. All statistical approaches for post-hoc handling of missing data in clinical trials leave uncertainties about the scientific soundness of the conclusions.23Given the very
high rate of drop-out and loss-to-follow-up in both treatment settings, the EvAKuJ Study Group therefore refrained from using any model based imputation method for data analy-sis. Employing sensitivity analysis with stan-dard methods of clinical epidemiology,18,19we
were able to assess the relevance of the treat-ment success rates previously reported by the EvAKuJ Study Group and to assess robustness of the conclusions drawn from the study despite high proportions of missing data at mid-term and long-term follow-up. Calculation of hypothetical OR in favor of successful treat-ment and the respective NNT in each setting also helped to compensate for the lack of an untreated control group in the design of the EvAKuJ study. Precise data on BMI-tracking in German youth are not available and the natu-ral course of overweight and obesity in chil-dren and adolescents aged 8 to 16 years has not been assessed in detail. Indirect evidence for spontaneous resolution of overweight in children below 12 years of age is available in the literature. As reported by Oude Luttikhuis
et al.3 in untreated (waiting list) controls
observed for 12 months, a mean ±1 SD reduc-tion of BMI-SDS was seen in the range of −0.15±0.47,24 −0.18±0.28,25 or −0.1±0.3.26
Due to possible differences in the methodology of BMI-SDS calculations (the LMS method used by German research groups may yield lower age-related changes than other meth-ods)15it is difficult to estimate how many
chil-dren may reduce BMI-SDS spontaneously by more than −0.2 in one year. In a randomized controlled trial of family-based behavioral treatment of childhood obesity in the United Kingdom it was not possible to identify a spe-cific treatment effect after 6 months due to similar reductions of BMI-SDS both in the treatment group and in waiting-list controls.27
On the other side, Reinehr et al.28,29showed
that the lifestyle intervention Obeldicks light, based on 6 months of physical activity training, nutrition education, and behavior counseling for children and their parents, caused a signif-icant mean reduction of BMI-SDS by −0.26±0.22 in a group of 34 overweight chil-dren (mean age, 11.6±1.6 years), while BMI-SDS increased by 0.05±0.19 in the control group of 32 overweight children (mean age, 11.4±1.7 years). Thus, it remains unclear which CER most accurately reflects sponta-neous changes in BMI-SDS with age in German children and could therefore be used in sensitivity analysis for BMI-SDS reduction of at least −0.2 in this age group.
Nevertheless, the chance that older children and adolescents with higher BMI-SDS may spontaneously loose their overweight seems to be low.30,31 Studies analyzed by Oude
Luttikhuis et al.3 in untreated (waiting list)
controls above 12 years of age who were observed for 12 months revealed a mean ±1 SD change in BMI-SDS in the range of 0.0±0.1129
or −0.02±0.10.32,33 Assuming that BMI-SDS
values are normally distributed, these data indicate that less than 5% of older children and adolescents may reduce BMI-SDS sponta-neously by at least −0.2 in one year. Obese
ado-lescents may remain obese without specific treatment and seem to benefit less from behav-ioural treatment.31A significant proportion of
overweight children and adolescents may spontaneously loose overweight when getting older (approximately 6% in 6 months during the study of Reinehr et al.;28,29 unpublished data) or may increase BMI-SDS over time (approximately 22% in 6 months during the study of Reinehr et al.;28,29unpublished data).
The observation that younger and less over-weight participants of the EvAKuJ study seem to benefit most from treatment in the short term (Appendix) may actually reflect both the spontaneous reduction of BMI-SDS which occurs over time in a subgroup of patients as well as better results of behavioural treatment using parents as agents of changein this age group.34 Especially pP analyses of these data
are therefore difficult to interpret. Because the EvAKuJ study did not assess spontaneous changes of BMI-SDS in a control group of over-weight and obese children and adolescents over time, the observed reductions in BMI-SDS (which were attributed to treatment effects in previous publications of the study group) may have occurred also due to age-specific physio-logic development or by chance and may not completely be related to treatment.
One must admit weaknesses in study design (no control group), data analysis (the unit of analysis, i.e., the individual patient, differed from the unit of assignment, i.e., the health care provider – but no statistical method was used to account for a potential cluster effect;
post-hocchange in the plan for data analysis switching from 6 clusters to 2 settings), as well as study performance (uncontrolled allocation of patients to the different clusters, no process control of the interventions, no screening whether the assigned intervention was deliv-ered as planned, and − most importantly − a very high proportion of patients who were lost to follow-up).35Yet, the methods used to collect
data represent validated instruments, content and time course of the interventions have been described, and recruitment and charac-terization of patients in the treatment settings as well as drop-out and follow-up rates have been provided in a transparent manner (Appendix).10 Patients’ baseline data have
been extensively presented and the main out-come (BMI-SDS reduction at time points T1, T2, and T3) as well as the secondary outcomes
have been calculated and reported using an intention-to-treat approach.
According to the model of stepwise imple-mentation of complex health interventions into an existing health care system proposed by Campbell et al.,9an evaluation study should
provide information on constant and variable elements of obesity treatment offered in Germany at that time (phase III). As outlined by Pfaff et al.,13during such a study
acceptabil-Non-commercial
ity and feasibility of the intervention should be assessed, its design adapted, and the relevant outcome parameters and treatment in the con-trol group should be determined − in order to prepare phase IV, the definitive randomized controlled effectiveness study. Should such a study be initiated now? The EvAKuJ study was initiated after analysis of the published evi-dence for effectiveness of interventions to treat obesity in children in the year 2004,8,36
and after the available treatment options in Germany had been assessed in 2005.2Given
the limited evidence about success of treat-ment from the EvAKuJ study and taking into account the low reliability of its outcome data due to the known but accepted problems with study design and performance, the BZgA came to the conclusion that the necessary prerequi-sites for such a confirmative study are lacking − at least in the context of the German health care system.10As Campbell et al.12pointed out,
the implementation process of complex health interventions into such a system has to be viewed as an iterative process of develop-ments, appraisals, and re-appraisals in paral-lel. In retrospect, refraining from accurately organizing and appropriately financing long-term patient follow-up appears as the main pit-fall in study design, being a probable cause of extensive loss to follow-up and impeding reli-able long-term analysis of treatment success rates. Another aspect of the study which has been discussed in a previous publication of the EvAKuJ Study Group is the apparent hetero-geneity of treatment results between single providers – at least in the outpatient setting (Appendix).10One might speculate about the
reasons of this variability and might try to find out how to learn from the best. However, before analyzing what is done differently in the most successful treatment centers, it is necessary to precisely identify those centers through benchmarking using outcome data which are adjusted for the existing baseline risk for treat-ment failure. Treattreat-ment success rates of differ-ent providers cannot be appropriately com-pared if confounders such as age and BMI-SDS before treatment are not taken into considera-tion.
Before a new study is planned, the following open questions should be answered: i) how is BMI-SDS in untreated overweight and obese children and adolescents tracking forward?; ii) how are effectiveness-related treatment processes put into clinical practice by each provider?; iii) how can appropriate indicators of long-term success of any treatment be ascer-tained and reliably assessed?
In the meantime, German pediatricians will continue to offer weight-reduction interven-tions to each child or adolescent with a rele-vant burden of disease due to obesity as out-lined in the national consensus statement.8
Statutory Health Insurance Funds or Pension
Funds in Germany will continue to pay for inpatient rehabilitation of these children or offer outpatient education and training pro-grams as outlined 8 years ago.8,36 However,
there will be a closer look on how to individu-alize obesity treatment in German youth. Is it still reasonable to deliver a standardized com-plex intervention to every child or adolescent above a certain BMI-SDS limit? Both age and degree of overweight and obesity seem to influence results of lifestyle interventions in the long term,3,37 and the benefit of such a
treatment seems to be rather limited especial-ly in extremeespecial-ly obese adolescents.30 Certain elements of outpatient education and training programs may be sufficient for reaching indi-vidual treatment aims in younger children and less overweight patients. The interventions may become shorter or could be used in a mod-ular way − which might help to increase moti-vation of the patients and their families. It should be investigated which treatment approaches yield the best outcome for certain patient subgroups and what characterizes effective delivery of care. Most importantly, documentation of treatment outcomes, espe-cially of long-term results, should be required and budgeted appropriately at least in clinical studies − in order to avoid extensive loss to fol-low-up which is typical for obesity studies all over the world.20
Conclusions
In sum: while outpatient treatment of over-weight children and adolescents might fit the needs of many families, intensive inpatient treatment of obese children and adolescents could be seen as a powerful tool helping these patients to effectively reduce BMI-SDS in a rel-atively short period. This tool, however, has to be used carefully: the patients should be pre-pared for this treatment phase, and follow-up must be organized in the family and communi-ty setting in order to include all stakeholders. The discussion, how to implement such an even more complex health intervention into the existing health care system in Germany is ongoing.38-40
References
1. Kurth BM, Schaffrath Rosario A. Die Verbreitung von Übergewicht und Adipositas bei Kindern und Jugendlichen in Deutschland. Ergebnisse des bun-desweiten Kinder- und Jugendgesundheitssurveys (KiGGS). Bundesgesundheitsblatt Gesundheits -forschung Gesundheitsschutz 2007;50:
736-43.
2. Bundeszentrale für gesundheitliche Aufklärung (BZgA). Die Versorgung übergewichtiger und adipöser Kinder -Quantität und Qualität von Hilfsangeboten im Zeitraum 20042005. Gesundheitsför -derung konkret, Band 8. Köln: BZgA; 2007. 3. Oude Luttikhuis H, Baur L, Jansen H, et al.
Interventions for treating obesity in chil-dren. Cochrane Database Syst Rev 2009;CD001872.
4. Whitlock EP, O'Connor EA, Williams SB, et al. Effectiveness of weight management interventions in children: a targeted sys-tematic review for the USPSTF. Pediatrics 2010;125:e396-418.
5. Golan M. Parents as agents of change in childhood obesity--from research to prac-tice. Int J Pediatr Obes 2006;1:66-76. 6. Konsensusgruppe Adipositasschulung
(KgAS). Trainermanual Leichter, aktiver, gesünder. Interdisziplinäres Konzept für die Schulung übergewichtiger oder adipöser Kinder und Jugendlicher. 2nd ed. AID infodienst Verbraucherschutz, Ernährung, Landwirtschaft e.V. and Deutsche Gesellschaft für Ernährung (DGE) e.V. (eds.). Bonn: AID infodienst; 2007.
7. Bundesarbeitsgemeinschaft für Rehabi litation (BAR). Gemeinsames Rahmenko -nzept der Gesetzlichen Krankenkassen und der Gesetzlichen Rentenversicherung für die Durchführung stationärer medi-zinischer Leistungen der Vorsorge und Rehabilitation für Kinder und Jugendlichen. Frankfurt am Main, 2008. Available from: http://www.bar-frankfurt. de/fileadmin/dateiliste/publikationen/arbe itsmaterialien/downloads/Gemeinsames_ Rahmenkonzept.pdf.
8. Böhler T, Wabitsch M, Winkler U. Consensus paper: patient training pro-grammes for obese children and adoles-cents. In: Federal Centre for Health Education (BZgA). Quality criteria for pro-grammes to prevent and treat overweight and obesity in children and adolescents. Methods of Health Promotion Vol. 4. Köln: BZgA; 2006. pp 37-55.
9. Campbell M, Fitzpatrick R, Haines A, et al. Framework for design and evaluation of complex interventions to improve health. Br Med J 2000;321:694-6.
10. Böhler T, Bengel J, Goldapp C, et al. Abschlussbericht im Rahmen des Qualitätssicherungsprozesses der BZgA zur Prävention und Therapie von Übergewicht bei Kindern und Jugendlichen. Köln: Bundeszentrale für gesundheitliche Aufklärung (BZgA); 2012. Available from: http://www.bzga-kinderue-bergewicht.de/adipo_mtp/pdf/Bericht_EvA KuJ-Studie.pdf.
Non-commercial
11. von Elm E, Altman DG, Egger M, et al. The strengthening the reporting of observa-tional studies in epidemiology (STROBE) statement: guidelines for reporting obser-vational studies. PLoS Med 2007;4:e296. 12. Campbell NC, Murray E, Darbyshire J, et
al. Designing and evaluating complex interventions to improve health care. Br Med J 2007;334:455-9.
13. Pfaff H, Albert US, Bornemann R, et al. Methoden für die organisationsbezogene Versorgungsforschung. Memorandum des Deutschen Netzwerks Versorgungsfor -schung. Gesundheitswesen 2009;71:777-90.
14. Mühlhauser I, Lenz M, Meyer G. Entwicklung, Bewertung und Synthese von komplexen Interventionen - eine methodische Herausforderung. Z Evid Fortbild Qual Gesundh wesen (ZEFQ) 2011;105:751-61.
15. Kromeyer-Hauschild K, Wabitsch M, Kunze D, et al. Perzentile für den Body-Mass-Index für das Kindes- und Jugendalter unter Heranziehung ver-schiedener deutscher Stichproben. Monatsschr Kinderheilkd 2001;149:807-18. 16. Perera R, Heneghan C, Yudkin P. A graph-ical method for depicting randomised tri-als of complex interventions. Br Med J 2007;334:127-9.
17. Wabitsch M, Kunze D. Leitlinien der Arbeitsgemeinschaft Adipositas im Kindes- und Jugendalter (AGA). Available from: http://www.dge.de/pdf/ll/LeitlinieA G http://www.dge.de/pdf/ll/LeitlinieA http://www.dge.de/pdf/ll/LeitlinieA d i p o s i t a s i m K i n d e s u n d -Jugendalter-2006.pdf.
18. Anlauf M. Assessing the efficacy of treat-ments using number needed to treat. Dtsch Arztebl 2006;103:A3254-8.
19. Sackett DL, Straus SE, Richardson WS, et al, eds. Evidence-based medicine. 2nd ed. Edinburgh: Churchill Livingstone; 2000. pp 113-117.
20. Ware JH. Interpreting incomplete data in studies of diet and weight loss. N Engl J Med 2003;348:2136-7.
21. Little RJ, D'Agostino R, Cohen ML, et al. The prevention and treatment of missing
data in clinical trials. N Engl J Med 2012;367:1355-60.
22. Yang X, Li J, Shoptaw S. Imputation-based strategies for clinical trial longitudinal data with nonignorable missing values. Stat Med 2008;27:2826-49.
23. DeSouza CM, Legedza AT, Sankoh AJ. An overview of practical approaches for han-dling missing data in clinical trials. J Biopharm Stat 2009;19:1055-73.
24. Golley RK, Magarey AM, Baur LA, et al. Twelve-month effectiveness of a parent-led, family-focused weight management program for prepubertal children: a ran-domized, controlled trial. Pediatrics 2007;119:517-25.
25. Hughes AR, Stewart L, Chapple J, et al. Randomized, controlled trial of a best-practice individualized behavioral pro-gram for treatment of childhood over-weight: Scottish Childhood Overweight Treatment Trial (SCOTT). Pediatrics 2008;121:e539-46.
26. Kalavainen MP, Korppi MO, Nuutinen OM. Clinical efficacy of group-based treatment for childhood obesity compared with rou-tinely given individual counseling. Int J Obes (Lond) 2007;31:1500-8.
27. Croker H, Viner RM, Nicholls D, et al. Family-based behavioural treatment of childhood obesity in a UK National Health Service setting: randomised controlled trial. Int J Obes (Lond) 2012;36:16-26. 28. Reinehr T, Schaefer A, Winkel K, et al. An
effective lifestyle intervention in over-weight children: findings from a random-ized controlled trial on Obeldicks light. Clin Nutr 2010;29:331-6.
29. Schaefer A, Winkel K, Finne E, et al. An effective lifestyle intervention in over-weight children: one-year follow-up after the randomized controlled trial on Obeldicks light. Clin Nutr 2011;30:629-33. 30. Danielsson P, Kowalski J, Ekblom Ö,
Marcus C. Response of severely obese chil-dren and adolescents to behavioral treat-ment. Arch Pediatr Adolesc Med 2012;166: 1103-8.
31. Whitaker RC, Wright JA, Pepe MS, et al.
Predicting obesity in young adulthood from childhood and parental obesity. N Engl J Med 1997;337:869-73.
32. Savoye M, Shaw M, Dziura J, et al. Effects of a weight management program on body composition and metabolic parameters in overweight children: a randomized con-trolled trial. JAMA 2007;297:2697-704. 33. Williamson DA, Martin PD, White MA, et
al. Efficacy of an internet-based behavioral weight loss program for overweight ado-lescent African-American girls. EWD 2005;10:193-203.
34. Golan M. Parents as agents of change in childhood obesity - from research to prac-tice. Int J Pediatr Obes 2006;1:66-76. 35. Oakley A, Strange V, Bonell C, et al.
Process evaluation in randomised con-trolled trials of complex interventions. Br Med J 2006;332:413-6.
36. Böhler T, Alex C, Becker E, et al. Qualitätskriterien für ambulante Schulungsprogramme für übergewichtige und adipöse Kinder und Jugendliche. Gesundheitswesen 2004;66:748-53. 37. Reinehr T. Effectiveness of lifestyle
inter-vention in overweight children. Proc Nutr Soc 2011;70:494-505.
38. Van Egmond-Fröhlich A, Brauer W, Goldschmidt H, et al. Effects of a pro-gramme for structured outpatient follow-up care after inpatient rehabilitation of obese children and adolescents -- a multi-centre, randomized study. Die Rehabilitation (Stuttgart) 2006;45:40-51. 39. Stachow R, Sievers-Böckel B,
Büssenschütt A, et al. Evidenzbasiertes Konzept zur Nachsorge für Kinder und Jugendliche mit Adipositas nach ambu-lanter oder stationärer Rehabilitation. Prävention Rehab 2012;24:110-20. 40. Adam S, Westenhöfer J, Rudolphi B,
Kraaibeek HK. Effects of a Combined Inpatient-Outpatient Treatment of Obese Children and Adolescents. Obes Facts 2009;2:286-93.
![Figure 3. Odds ratios (OR) and upper and lower limits of 95% confidence intervals (CI)for successful obesity treatment [reduction of body-mass-index standard deviation scores(BMI-SDS) of at least -0.2] as a function of different categories of control event](https://thumb-us.123doks.com/thumbv2/123dok_us/8369023.1674534/4.595.235.548.208.588/confidence-intervals-successful-treatment-reduction-deviation-different-categories.webp)
![Figure 4. Odds ratios (OR) and upper and lower limits of 95% confidence intervals (CI)for good success in obesity treatment [reduction of body-mass-index standard deviationscores (BMI-SDS) of at least -0.5] as a function of different categories of control](https://thumb-us.123doks.com/thumbv2/123dok_us/8369023.1674534/5.595.214.536.216.590/confidence-intervals-treatment-reduction-deviationscores-function-different-categories.webp)
![Figure 5. The number needed to treat (NNT) in order to achieve a reduction of body-mass-index standard deviation scores [BMI-SDS] of at least -0.2 (dots and circles) or -0.5(filled and empty diamonds) in one additional patient as a function of different cate-](https://thumb-us.123doks.com/thumbv2/123dok_us/8369023.1674534/6.595.230.555.124.539/figure-reduction-standard-deviation-diamonds-additional-function-different.webp)
