MORPHOLOGICAL BASED GENETIC VARIABILITY ANALYSIS AND CLUSTERING
OF TOMATO
Aina Yadav*1, Neeraj Tandan1 and Rajvir Singh2
1
Department of Biotechnology, Shri Venkateshwara University, Gajraula (U.P.), India.
2
Department of Botany, K.K. Degree College, Etawah (U.P.), India.
Article Received on 03/05/2017 Article Revised on 24/05/2017 Article Acc epted on 13/06/2017
INTRODUCTION
Tomato (Solanum lycopersicum Mill.) is one of the most important vegetable crops around the world either outdoors or indoors and an excellent source of lycopene belongs to Solanaceae family also called Nightshades which includes more than three thousand species. In India, it ranks second among vegetables next to potato in terms of area and production. Tomato universally treated as ‘Protective Food’, is being extensively grown as annual plant. It is a rich source in minerals, vitamins and organic acids. Morphological, agronomic, as well as biochemical parameters have been widely used in the evaluation of tomato cultivars for genetic diversity, breeding value and yield potential (Dharmatti et. al., 2001; Mohanty and Pusti, 2001; Susic et. al., 2002; Parthasarathy et. al., 2002). The characterization will help in the identification of varieties and their future utilization for varietal improvement using conventional techniques of selection and hybridization. Collection, characterization and evaluation of crop germplasm are key steps towards selection of new varieties for direct production or for use in hybridization programmes (Osei et. al., 2009; Osei et. al., 2010; Osei et. al., 2014).
Knowledge of interrelationship between yield and its components is obvious for efficient selection of desirable plant type. Plant breeders are continuously endeavoring to improve the genetic potential of yield and quality traits of tomato crop so as to meet the demands of an ever-increasing population of the world. The approaches to make significant improvement in tomato production require information regarding nature and magnitude of genetic variation in quantitative traits and their interrelationships in the available germplasm, which are important pre-requisites for a systematic breeding
program (Firas et. al., 2012). Researchers have
emphasized on evaluation of genetic components such as coefficient of variation, heritability and expected genetic progress in the prediction of response quantitative characters to selection (Mohanty, 2002; Mohanty, 2003; Saeed et. al., 2007; Dar and Sharma, 2011; Mohamed et. al., 2012). The information obtained through clustering will support tomato breeders in identifying a limited number of extremely differentiated genotypes to be selected for further use in developing suitable variety/hybrids. The objective of this study was to evaluate the genetic variability and relationships of tomato based on morphological traits to improve tomato production.
MATERIALS AND METHOD
*Corresponding Author: Aina Yadav
Department of Biotechnology, Shri Venkateshwara University, Gajraula (U.P.), India.
ABSTRACT
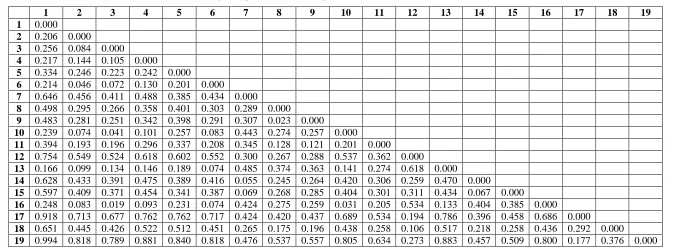
19 tomato genotypes were used in this study and observations were taken for two seasons. Genetic parameters like range, mean, standard error, variance and standard deviation were calculated among 8 quantitative traits of tomato. Among 19 tomato genotypes plant height, days to 50% flowering, number of primary branches/plant, number of fruits/plant, number of locules/fruit, fruit length, fruit diameter and fruit weight ranged from 98.3-143.3 cm, 50.1-62.9 days, 5.9-13.6, 28.3-317.6, 3.3-7.1, 2.2-6.3 cm, 2.6-5.3 cm and 31.6-115.0 gm, respectively. Maximum variability was found in number of fruits/plant. Genetic dissimilarity coefficients for 19 tomato genotypes based on quantitative traits ranged from 0.019-0.994. Maximum dissimilarity coefficient value occured between DVRT-2 vs PB-UPMA was 99.4% and minimum dissimilarity coefficient value occured between EC-538158 vs EC-538423 was 1.9%. Clustering classified the 19 tomato genotypes into 5 distinct clusters i.e. cluster A, B, C, D and E. Therefore, these traits could be considered and exploited for selection purpose. This study was concluded that there is a wide genetic variability in the genotypes and the genotypes could be utilized for genetic improvement of tomato.
KEYWORDS: 19 tomato genotypes, study and observations.
ISSN 2455-3301
WJPMR
AND MEDICAL RESEARCH
Seeds of 19 tomato genotypes were obtained from Department of Horticulture, Sardar Vallabhbhai Patel University of Agriculture & Technology, Meerut (UP) (Table-1). The genetic material was grown in pot for germination and growth at Scientific and Applied Research Centre, Meerut with standard agronomical practices and observations were taken for two seasons viz., 2012-13 and 2013-14.
Morphological data of ten plants for each genotypes were recorded for the different traits as follow:
1. Plant height (cm): Plant height was measured in centimeters from the ground level to the tip of the plant on 70th day after transplanting.
2. Days to 50% flowering: The number of days taken from date of transplanting to the date at which 50% of the total number of plants flowered in each treatment.
3. Number of primary branches: Number of branches per plant was counted at the time of harvest.
4. Number of fruits/plant: Total number of fruits harvested from all the pickings was pooled and average number of fruits per plant was calculated. 5. Number of locules/fruit: Fruits was cut crosswise
and numbers of locules were counted.
6. Fruit length (cm): Randomly selected ten fruits per plant were used to determine fruit length by vernier calipers and expressed in centimeters.
7. Fruit diameter (cm): Randomly selected ten fruits per plant were used to determine fruit diameter by vernier calipers and expressed in centimeters. 8. Fruit weight (gm): Weight of randomly selected
fruit from each genotype was weighed in gram using weighing machine after harvesting.
Two season (2012-13 and 2013-14) pooled quantitative data for plant height (cm), days to 50% flowering, number of primary branches, number of fruits/plant, number of locules/fruit, fruit length (cm), fruit diameter (cm) and fruit weight (gm) were analyzed using simple statistics to calculate the genetic parameters like Range, Mean, Standard error, Variance and Standard deviation for 8 quantitative traits of 19 tomato genotypes using statistical package PAST version 2.03 (Hammer et. al., 2001). The pooled data for quantitative traits were used to construct a dendrogram showing the relationships among 19 tomato genotypes using computer software NTSYS-pc (Numerical Taxonomy and Multivariate Analysis System) version 2.2. Finally, the data were subjected to cluster analysis using the NTSYSpc version 2.2 (Rohlf, 2000).
RESULTS AND DISCUSSION
Morphological traits and their mean performance The mean performance and range for 8 quantitative traits of tomato genotypes is presented in Table-2. Plant height of 19 tomato genotypes ranged from 98.3 cm (Anigoor lata) to 143.3 cm (DVRT-1 and PB-UPMA) and the
mean was 128.34 cm. Days to 50% flowering ranged from 50.1 days (Anigoor lata) to 62.9 days (PB-UPMA) and the mean was 55.89 days. Number of primary branches varied from 5.9 (EC-538423) to 13.6 (PB-UPMA) and the mean was 9.01. Number of fruits per plant of 19 tomato genotypes ranged from 28.3 (DVRT-2) to 317.6 (PB-UPMA) and the mean was 148.67. The number of locules per fruit ranged from 3.3 (EC-538155) to 7.1 (FLA-7421) and the mean was 5.63 locules per fruit. Among the 19 tomato genotypes, the minimum and maximum fruit length was recorded in EC-538155 (2.2 cm) and Anigoor lata (6.3 cm), respectively and mean was 4.41 cm. Fruit diameter ranged from 2.6 cm (EC-538405) to 5.3 cm (Anigoor lata) and the mean was 3.48 cm. The highest fruit weight of 115.0 gm was obtained in PDT-3-1-1 and the lowest was 31.6 gm in BT-12. The mean of fruit weight was 58.54 gm. Among 19 tomato genotypes, PB-UPMA showed maximum values for plant height, days to 50% flowering, number of primary branches and number of fruits per plant. Anigoor lata showed minimum values for plant height and days to 50% flowering. Similar results also reported by Kumar et al. (2013 & 2014), Sharma et al. (2014), Taiana et al. (2015).
The range of variability was highest for number of fruits per plant (28.3-317.6), followed by plant height (98.3-143.3), fruit weight (31.6-115), days to 50% flowering (50.1-62.9), number of primary branches (5.9-13.6), number of locules per fruit (3.3-7.1), fruit length (2.2-6.3) and fruit diameter (2.6-5.3). The highest variance recorded for number of fruits per plant (6316.78), followed by fruit weight (759.84), plant height (180.75), days to 50% flowering (17.19), whereas the lowest variance were estimated for fruit diameter (0.65), followed by number of locules per fruit (1.15), fruit length (1.51), number of primary branches (5.09). High variance was observed for most of the traits indicating more contribution of genetic component for the total variation. Variance revealed the presence of considerable amount of genetic variability for yield and its components studied in all the environments. Therefore, these traits (Table-2) could be considered and exploited for selection purpose. These results were in accordance of the results obtained by Bernousi et al. (2011), Manna and Paul (2012), Naik (2012), Patel et al. (2013), Agrawal et al. (2014), Khapte and jansirani (2014), Prajapati et al. (2015).
of 5, 3, 3, 2 and 2 tomato genotypes, respectively (Table.4).
Cluster A grouped into two subclusters viz; A-1 and A-2. Subcluster A-1 consisted of only 2 genotypes namely PB Chhuhara and EC-538450, which showed the dissimilarity coefficient value of 0.046. Subcluster A-2 consisted of 3 genotypes namely 538158, 538423 and EC-538405. In Subcluster A-2, the maximum dissimilarity coefficient occurred between EC-538158 vs EC-538405 with a value of 0.041 and the minimum dissimilarity coefficient occurred between EC-538158 vs EC-538423 with a value of 0.019. In the clustering, out of 19 tomato genotypes; only one genotypes (DVRT-2) was isolated at the top of clustering and three genotypes were isolated at the end of cluster A (Anigoor lata, EC-538155 and PDT-3-1-1). Cluster B consisted of 3 genotypes namely PB Keshri, IIHR-1 and DVRT-1. In this cluster, the maximum dissimilarity coefficient occurred between PB Keshri vs DVRT-1 with a value of 0.069 and the minimum dissimilarity coefficient occurred between PB Keshri vs IIHR-1 with a value of 0.055. Cluster C
consisted of 3 genotypes namely FED-2, BT-12 and H-86. In this cluster, the maximum dissimilarity coefficient occurred between FED-2 vs H-86 with a value of 0.128 and the minimum dissimilarity coefficient occurred between FED-2 vs BT-12 with a value of 0.023. Cluster D consisted of only two tomato genotypes FLA-7421 and VR-1, which showed the dissimilarity coefficient value of 0.106. Cluster E consisted of only two tomato cultivars/genotypes VRT-2 and PB-UPMA, which showed the disimilarity coefficient value of 0.177.
Dendrogram was prepared to evaluate similarity/ disimilarity between tomato genotypes and all obtained data showed that the collected genotypes have a huge variation. Similar results have also been reported by Shashikanth et al. (2010), Sharma et al. (2013), Chernet et al. (2014), Henareh et al. (2015), Rashid et al. (2016). Based on the present investigation it was recommended that crosses are made in breeding programs between PB Chhuhara and DVRT-1. This evaluation could support breeders to choose and identify genotypes with desirable character for addition in tomato breeding programs.
Figure 1: UPGMA based cluster analysis of 19 tomato using morphological traits.
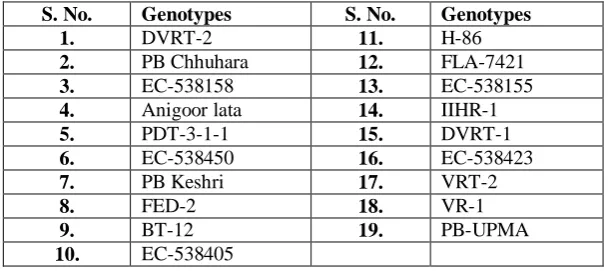
Table 1: List of tomato genotypes.
S. No. Genotypes S. No. Genotypes
1. DVRT-2 11. H-86
2. PB Chhuhara 12. FLA-7421
3. EC-538158 13. EC-538155
4. Anigoor lata 14. IIHR-1
5. PDT-3-1-1 15. DVRT-1
6. EC-538450 16. EC-538423
7. PB Keshri 17. VRT-2
8. FED-2 18. VR-1
9. BT-12 19. PB-UPMA
Table 2: Range, mean, standard error, variance and standard deviation for 8 quantitative traits in 19 tomato genotypes.
Traits Range Mean Std. error Variance Stand. dev
Minimum Maximum
Plant height (cm) 98.3 143.3 128.34 3.08 180.75 13.45
Days to 50% flowering 50.1 62.9 55.89 0.95 17.19 4.14
Number of primary branches 5.9 13.6 9.01 0.52 5.09 2.26
Number of fruits/plant 28.3 317.6 148.67 18.23 6316.78 79.47
Number of locules/fruit 3.3 7.1 5.63 0.25 1.15 1.07
Fruit length (cm) 2.2 6.3 4.41 0.28 1.51 1.23
Fruit diameter (cm) 2.6 5.3 3.48 0.18 0.65 0.81
Fruit weight (gm) 31.6 115.0 58.54 6.32 759.84 27.56
Table 4: Distribution of 19 tomato genotypes into different clusters.
S. No. Cluster number Number of
tomato genotypes Genotypes
1. A 5 PB Chhuhara, 538450,
EC-538158, EC-538423 and EC-538405
2. B 3 PB Keshri, IIHR-1 and DVRT-1
3. C 3 FED-2, BT-12 and H-86
4. D 2 FLA-7421 and VR-1
Table 3: Genetic disimilarity coefficient of 19 Tomato genotypes derived from quantitative traits.
1 2 3 4 5 6 7 8 9 10 11 12 13 14 15 16 17 18 19
1 0.000
2 0.206 0.000
3 0.256 0.084 0.000
4 0.217 0.144 0.105 0.000
5 0.334 0.246 0.223 0.242 0.000
6 0.214 0.046 0.072 0.130 0.201 0.000
7 0.646 0.456 0.411 0.488 0.385 0.434 0.000
8 0.498 0.295 0.266 0.358 0.401 0.303 0.289 0.000
9 0.483 0.281 0.251 0.342 0.398 0.291 0.307 0.023 0.000
10 0.239 0.074 0.041 0.101 0.257 0.083 0.443 0.274 0.257 0.000
11 0.394 0.193 0.196 0.296 0.337 0.208 0.345 0.128 0.121 0.201 0.000
12 0.754 0.549 0.524 0.618 0.602 0.552 0.300 0.267 0.288 0.537 0.362 0.000
13 0.166 0.099 0.134 0.146 0.189 0.074 0.485 0.374 0.363 0.141 0.274 0.618 0.000
14 0.628 0.433 0.391 0.475 0.389 0.416 0.055 0.245 0.264 0.420 0.306 0.259 0.470 0.000
15 0.597 0.409 0.371 0.454 0.341 0.387 0.069 0.268 0.285 0.404 0.301 0.311 0.434 0.067 0.000
16 0.248 0.083 0.019 0.093 0.231 0.074 0.424 0.275 0.259 0.031 0.205 0.534 0.133 0.404 0.385 0.000
17 0.918 0.713 0.677 0.762 0.762 0.717 0.424 0.420 0.437 0.689 0.534 0.194 0.786 0.396 0.458 0.686 0.000
18 0.651 0.445 0.426 0.522 0.512 0.451 0.265 0.175 0.196 0.438 0.258 0.106 0.517 0.218 0.258 0.436 0.292 0.000
REFERENCES
1. Agrawal, A., N. Arya and Z. Ahmed, Genetic
variability studies in tomato (Solanum Lycopersicum Mill.). Progressive Horticulture, 2014; 46(2): 50-52.
2. Bernousi, I., Emami, A. Tajbakhsh, M.
Darvishzadeh and M. Henareh. Studies on genetic variability and correlation among the different
traits in tomato (Solanum Lycopersicum
Mill.). Notulae Botanicae Horti Agrobotanici, Cluz- Napoca, 2011, 39(1): 152-158.
3. Chernet, S., D. Belew and F. Abay. Genetic
diversity studies for quantitative traits of tomato (Solanum lycopersicon L.) genotypes in Western
Tigray, Northern Ethiopia. Journal of Plant
Breeding and Crop Science, 2014; 6(9): 105-113.
4. Dar, R.A. and J.P. Sharma. Genetic variability
studies of yield and quality traits (Solanum lycopersicon L.). Int. J. Plant Breed. Genet., 2011; 5: 168-174.
5. Dharmatti et al. Genetic divergence studies in
summer tomatoes. Karnataka J. Agric. Science., 2001; 14(2): 407-411.
6. Firas, A., K. Hussein, S. Mahmood, A. Abdulla and
A.A. Mohammad. Genetic Analysis and Correlation studies of yield and fruit quality traits in tomato (Solanum lycopersicum L.). NY Sci. J., 2012; 5(10): 142-145.
7. Hammer, Ř., D.A.T. Harper and P.D. Ryan, PAST:
Paleontological statistics software package for
education and data analysis. Palaeontologia
Electronica, 2001; 4(1): 9.
http://palaeo-electronica.org/2001_1/past/issue1_01.htm.
8. Henareh, M., A. Dursun and B.A. Mandoulakani,
Genetic diversity in tomato landraces collected from Turkey and Iran revealed by morphological characters. Acta Sci. Pol. Hortorum Cultus, 2015; 14(2): 87-96.
9. Khapte, P.S. and P. Jansirani, Genetic variability and
performance studies of tomato (Solanum
lycopersicum Mill.) genotypes for fruit quality and yield. Trends in Bioscience, 2014; 7(12): 1246.
10. Kumar, Ashwani, R.S. Yadav and Rajendra Kumar,
Assessment of variability and relationship among some quantitative traits in elite accessions of chickpea (Cicer arietinum L.). Prog. Agric., 2014; 14(1): 63-68.
11. Kumar, Ashwani, R.S. Yadav and Rajendra Kumar,
Estimation of genetic parameters and correlation between morphological traits in selected chickpea (Cicer arietinum L.) Accessions. Plant Archives, 2013; 13(2): 719-723.
12. Manna, M. and A. Paul, Studies on genetic
variability and character association of fruit quality parameter in tomato (Solanum lycopersicum Mill.). Hort Flora Research Spectrum, 2012; 1(2): 110-116.
13. Mohamed, S.M., E.E. Ali and T.Y. Mohamed,
Study of heritability and genetic variability among different plant and fruit characters of tomato (Solanum lycopersicon Mill.). International Journal
of Scientific and Technological Research, 2012; 1(2).
14. Mohanty, B.K. Variability, heritability, correlation and path coefficient studies in tomato. Haryana J. Hort. Sci., 2002; 31(3&4): 230-233.
15. Mohanty, B.K. Genetic variability, correlation and path coefficient studies in tomato. Indian J. Agril. Res., 2003; 37(1): 68-71.
16. Mohanty, B.K. and A.M. Pusti, Analysis of genetic distance in tomato research on crops, 2001; 2(3): 282-285.
17. Naik, A. Characterization of fenugreek (Trigonella
foenumgraecum L.) genotypes through
morphological characters. International Journal of Agriculture, Environment & Biotechnology, 2012; 5(4): 445-449.
18. Osei, M.K., K.O. Bonsu, A. Agyeman and H.S.
Choi, Genetic Diversity of Tomato Germplasm in
Ghana using Morphological Characters.
International Journal of Plant & Soil Science, 2014; 3(3): 220-231.
19. Osei, M.K., K.O. Bonsu, S.O. Ekyem and R.
Akromah, Morphological Characterization of
Tomato (Lycopersicum esculentum) germplasm in Ghana. Agricultural Innovations for Sustainable Development, 2009; 1(1): 41-48.
20. Osei, M.K., R. Akromah, S.L. Shilh and S.K. Green,
Evaluation of some tomato germplasm for resistance to Tomato Yellow Leaf curl Virus disease (TYLCV) in Ghana. Aspects of Applied Biology, 2010; 96: 315-320.
21. Parthasarathy, V.A. and C. Aswath, Genetic
diversity among tomato genotypes. Indian J. Hort., 2002; 59(2): 162-166.
22. Patel, S.A., D.B. Kshirsagar, M.N. Bhalekar and N.S. Khute, Correlation studies in tomato (Solanum
Lycopersicum Mill.). Vegetable Science, 2013;
40(2): 217-218.
23. Prajapati, Sunil, Akhilesh Tiwari, Satish Kadwey and Tarun Jamkar, Genetic Variability, Heritability and Genetic Advance In Tomato (Solanum Lycopersicon Mill.). IJAEB, 2015; 8(2): 245-251. 24. Rashid, S., M. Abbas, Q. Bano, A. Javed and A.
Akram, Genetic Diversity Assessment of Tomato (Solanum lycopersicum L.) Germplasm based on Agro-morphological Traits. Adv. Plants Agric. Res., 2016; 3(3): 00097.
25. Rohlf, F.J. NTSYS-pc Numerical Taxonomy and
Multivariate Analysis System. Version 2.00. Exeter Software, Setauket, New York, 2000.
26. Saeed, A., K. Hayat, A.A. Khan, S. Iqbal and G. Abbas, Assessment of genetic variability and heritability in Lycopersicum esculentum Mill. Int. J. Agri. Bio., 2007; 9(2): 375-377.
27. Sharma, Triveni, Ashwani Kumar, S.C. Dwivedi and
R.P. Vyas, Assessment of genetic diversity of maize inbred lines using morphological traits. Plant Archives, 2013; 13(1): 477-480.
28. Sharma, Triveni, Ashwani Kumar, S.C. Dwivedi and
correlation analysis in maize (Zea mays L.). Plant Archives, 2014; 14(1): 19-21.
29. Shashikanth, N.B., R.M. Hosamani and B.C. Patil, Genetic variability in tomato (Solanum lycopersicon [Mill.] Wettsd.). Karnataka J. Agric. Sci., 2010; 23(3): 536-537.
30. Susic, Z., N. Pavlovic, D. Cvikic, I. Rajicie Sretenovic, G. Paroussic, D. Yoyiatais and Parouesis. Studies of correlation between yield and fruit characteristics of tomato hybrids and their parental genotypes. Proceedings of the second Balken Symposium on the vegetables and Tomatoes. Thessloniki Greece. Acta. Hort., 2002; 579: 163-166.
31. Taiana, Tasnia, Md. Harun-Ur-Rashid, Shahanaz
Parveen, Md. Sarowar Hossain and Md. Azadul Haque, Selection strategies to choose better parents
in tomato using genetic parameters. Plant