Vol. 3 Issue 8, August - 2017
A Hybrid Method for Circle Detection
Circle Detection
Wen-Yen WuDepartment of Industrial Management I-Shou University
Kaohsiung, Taiwan [email protected]
Abstract—We propose a hybrid method for
detecting circles in this paper. In the first stage, dominant point detection is used to classifiy curve into linear and nonlinear segments. In the second stage, the geometric properties are used to estimate the centers and radii for nonlinear segments. In the final procedure, the nonlinear segments are classified into several clusters. The circles are identified if they have small fitting errors. The proposed hybrid method has been evaluated using both of the synthetic and real images. The experimental results show that the proposed method is efficient.
Keywords—circle detection; asymmetry support region; dominant point; curve segmentation; fitting error
I. INTRODUCTION
Recognizing industrial parts is an important task in many applications. Industrial parts with a round shape are seen everywhere. They need to be measured and inspected during the manufacturing or assembling processes. Many methods have been proposed to detect circles in the past years. Most algorithms of them are based on Hough transform (HT) or its variants [3, 9-10, 17, 22]. The HT based methods usually employ a 3D accumulator array to mapping the x-y coordinates of the points to the corresponding parameter space. After all these points have been processed, a peak finding procedure is applied to locate circles. It will detect a circle with center and radius, if it is a peak in the parameter space. However, especially for an image containing noise, they suffer from at least one of the following problems: (1) an algorithm for peak-finding in the 3D accumulator is implicit and complex, (2) an inappropriate structure of accumulator fails to detect such a circle, (3) the precision of the center is low, (4) large storage is required for the 3D accumulator, and (5) much operating time is taken. Therefore, many HT based algorithms tend to solve the above problems by using different data structures or identifying strategies [6-7, 12-15, 18-19]. The modified method may have better effectiveness in identifying circles. However, the HT based algorithms are restricted to pixel accuracy. It is not enough for machine vision system that requires subpixel accuracy. To reach subpixel accuracy requirement, the HT-based algorithms will need much computation effort and memory space.
Due to the drawbacks of the HT based methods, some non-HT based algorithms have been proposed [2, 4-5, 8, 11, 16, 20, 21]. They use either other different
searching strategies or optimization schemes. Ayala-Ramirez et al. [2] proposed a genetic algorithm for circle detection. It uses a three-edge point circle presentation and eliminates unfeasible circle locations to reduce the search space. Chen and Lin [4] used the orthogonal circular detector to estimate the parameters of circles. It consists of five 9x9 masks based on a truncated basis system set. Chen and Lee [5] proposed a circular object detection and location technique. The geometric properties of a circle are used to find some pixels on a circle and then fit these pixels to get the parameters of the circular object. Cuevas et al. [8] proposed an electro-magnetism optimization method to detect circles. The set of encoded candidate circles are evaluated if they can fit into the actual circles. Ho and Chen [11] used the global geometric symmetry to classify points into several sub-images. The parameters of circles are then estimated based on the above geometric symmetry centers. Lim et al. [16] proposed a scale-space filtering to extract curve segments. The segments are evaluated by two measurements to find the circular arcs. Wojcik [20] represented objects as nodes of a graph. The weights to nodes are based on the properties of the objects. A template matching technique is used to recognize the circular objects. It is a simple method, but it fails to detect partially occluded circular object. Yu and Bajaj [21] used the Voronoi diagram and the distance transform to develop a circle detection method. The circles can be detected from searching the distance map. The geometric properties are used to reduce the computation effort. The possible circular points are then applied to a fitting process to find the parameters of circle. The method is simple and it is effective. However, it is not robust for the partially occluded circles.
Vol. 3 Issue 8, August - 2017 II. THE HYBRID METHOD
A. Split Curves
Information about a curve is usually concentrated at the dominant points. As a result, the dominant points are considered as representative features for the object contours, because they reserve the significant features of the digitized curve of the images [1]. Fig. 1 shows a curve with two linear segments and one nonlinear segment.
Fig. 1. Example of a curve has three dominant points
The curve can be divided into three segments by three dominant points. It is seen that the linear segments are not circular arcs. Only the nonlinear segments on a curve may be considered as possible circular arcs. In order to split curve into several segments, we use an adaptive method to find the dominant points. Each segment is then checked if it is linear or nonlinear.
The dominant points are the points with local maximum curvature. For a continuous curve, the curvature at a point is defined as the rate of change of slope as a function of the arc length. However, the above definition of curvature can’t apply to a digital curve. Therefore, the dominant point detection algorithms use the information that can be extracted from the neighbors to estimate the curvatures.
For an asymmetry support region, the forward length and the backward length of support region may be different as shown in Fig. 2. We can define the above estimated curvatures using the asymmetry support regions.
Fig. 2. Asymmetry method for curvature estimation.
The k-cosine for an asymmetry support region of two vectors is defined as:
cosθ𝑖,𝐵𝑖,𝐹𝑖 = 𝑎⃗ 𝑖,𝐵𝑖,𝐹𝑖∙𝑏⃗ 𝑖,𝐵𝑖,𝐹𝑖 |𝑎⃗ 𝑖,𝐵𝑖,𝐹𝑖||𝑏⃗
𝑖,𝐵𝑖,𝐹𝑖|
(1)
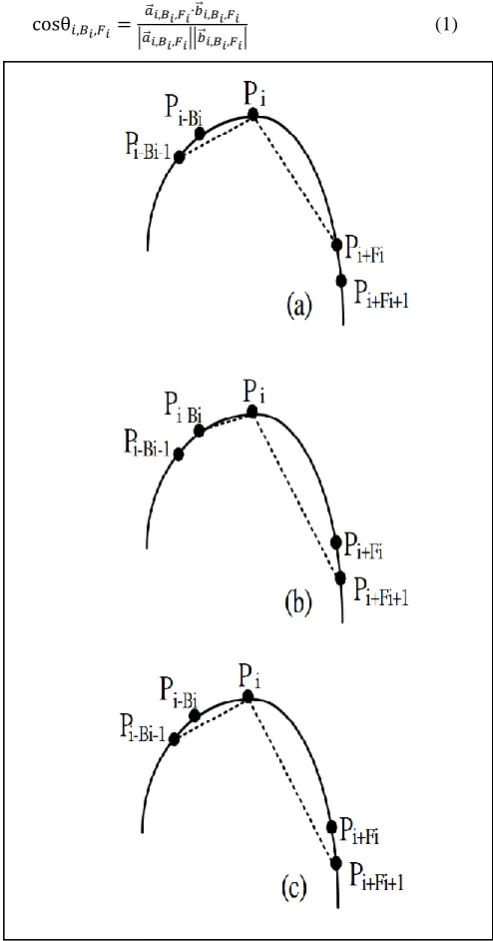
Fig. 3. Three possible methods to extend the length: (a)
backward, (b) forward, (c) both in backward and forward.
Fig.3 shows the three possible methods to extend the length for an asymmetry support region in Fig. 2. It may extend the backward length (Fig. 3(a)), the forward length (Fig. 3(b)), or both in backward and forward length (Fig. 3(c)). In these three methods, we should select the best case with the maximum curvature.
The following algorithm presents the method for determining the asymmetry supporting regions.
Algorithm 1. Determination of the forward and the backward lengths of support region of the i th point. Step 1. Let Bi=1 and Fi =1, initially.
Step 2. Let maxALL max{ci,Bi1,Fi,ci,Bi,Fi1,ci,Bi1,Fi1}. If the following condition is satisfied, then stop.
Vol. 3 Issue 8, August - 2017 where
i iF B i
c, , is computed by (1).
Step 3. Increase Bi or Fi by considering the following three
cases:
(a) Increase Bi by 1, if ci,Bi1,Fi maxALL.
(b) Increase Fi by 1, if ci,Bi,Fi1maxALL.
(c) Increase both of Bi and Fi by 1, if ci,Bi1,Fi1maxALL. Go to step 2.
After the backward and the forward lengths of the support region have been determined. The region of support of the i th point, Pi, is then defined as the set of points:
RS(𝑃𝑖) = {𝑃𝑖−𝐵𝑖, … , 𝑃𝑖, … , 𝑃𝑖+𝐹𝑖} . (3)
Once the asymmetry region of support for each point has been determined, find the estimated curvature by smoothing the Bi×Fi curvatures:
𝑐𝑖= 1
𝐵𝑖𝐹𝑖∑ ∑ 𝑐𝑖𝑗𝑘
𝐵𝑖
𝑗=1 𝐹𝑖
𝑘=1 . (4)
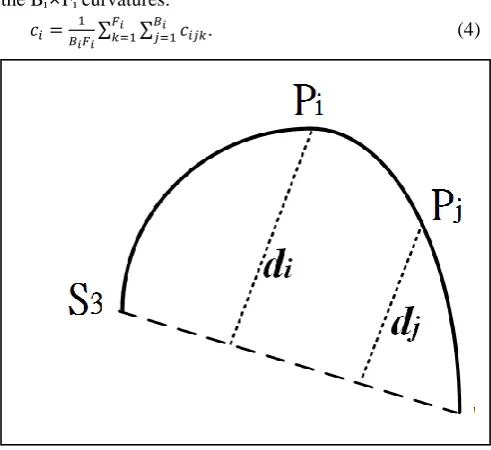
Fig. 4. The distance between a point and the approximated line segment
Since the distance between the point and the approximated line segment represents the distortion of linearity. In this paper, the average distance is used as a linearity criterion to assess the distortions caused by the approximated line segment (see Fig. 4). It is defined as
n d D
n
j i/ 1
(5)
Since the distortion is small for a linear segment. The smaller the average distance is, the better linearity is. Therefore, a segment with a small average distance is considered as a linear segment. Otherwise, it will be considered as a nonlinear segment.
B. Find Centers and Radii
Once the nonlinear segments have been determined, it needs to find the locations of the circular objects. We use the geometric properties of a circle to derive a method for finding center and radius. Suppose that line L is the perpendicular bisector of a chord on a circle as seen in Fig. 5, line L will pass through the center C.
Fig. 5. The two perpendicular bisectors of chords will intersect
at the center.
Since the perpendicular bisectors of any chords will pass through the center, they will have an intersection at the center. From the above geometric properties, we can find the center from three points on a circle. Both of them will pass through the center, so they will intersect at the center (see Fig . 6).
Fig. 6. Two perpendicular bisectors of chords will intersect at
the center.
Vol. 3 Issue 8, August - 2017 a nonlinear segment as seen in Fig. 7. To solve the
problem, we can use the average position of intersections as the estimated center.
Fig. 7. Estimate the center by averaging the intersections.
Suppose that Ci (xci, yci) is the i th intersection, the
estimated center C(xˆc,yˆc) can be defined as:
m x
m
i ci/
c xˆ
1
(6)
m y
m
i ci/
c yˆ
1
(7)
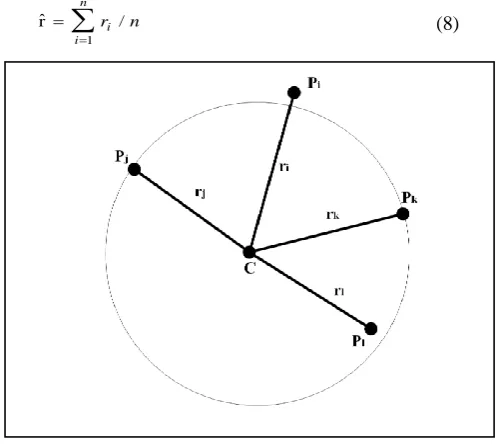
The estimated center has been found by the above equations. The distances between the points and the estimated center are considered as the approximated radii. Since the points may not on the approximated circle exactly as seen in Fig. 7. Therefore, the average of distances is defined as the estimated radiusrˆ, it can be found by (see Fig. 8)
n r
n
i i /
rˆ
1
(8)
Fig. 8. Estimate the radius by averaging the distances.
III. EXPERIMENTAL RESULTS
In order to evaluate the proposed method, it has been tested on 500 synthetic images. Each of the
synthetic images includes nine objects. They are one perfect, four half-broken, and four quartered circular objects with random radii varying from 3 to 50 pixels. One example of the images including nine types of circular objects is presented in Fig. 9. Further, in order to access the ability of the proposed method under noisy condition, noise was added to each of the testing images with signal to noise ratio (S/N) 20, 30, and 40, respectively.
Fig. 9. A synthetic image containing nine types of circular
objects.
All of the circular objects have been correctly detected in the experiments. For noise-free images, it is seen that the average values are very small (not exceed 0.30 pixels) for all the nine types of circular objects. Especially for perfect circular objects, the average xe and ye are very small and they are about 0.01 pixels. In addition, it is seen that the average accuracy level of radius approximates to 0.05 pixels for perfect circular object. For half-broken circular objects under the four directions, the accuracy level can reach 0.15 pixels. The quartered-circles can also be correctly detected. The errors are small too. They are about 0.30 pixels. In addition, the proposed method can also detect very small circular objects. For a synthetic image, it can even detect circular objects with radius in 3 pixels
For the images with S/N=20, the average errors are all smaller than 0.10 pixels for the perfect circular objects. The average errors of x-coordinate and y-coordinate are less than 0.28 for the semi-circles. The average errors are all less than 0.29 for the quartered circles.
Further, for the images with S/N=30, it is seen that the average errors of x-coordinate, y-coordinate, and radius are less than 0.54 pixels for the perfect circles. The errors are less than 0.64 pixels for the broken circular objects. The quartered circles have the errors less than 0.92 pixels.
Vol. 3 Issue 8, August - 2017
Fig. 10. One example of testing image with several types of
circular and non-circular objects: (a) original image, (b) edge image, and (c) superimposed by detected circles.
Another set of testing images that contains various types of objects is shown in Fig. 10. They include some broken, occluded, and perfect circular objects as well as other shaped objects. There are 33 circular arcs in the image. In order to evaluate the proposed method, the image was rotated in 16 different orientations. Fig. 10(a)
is the original image, Fig. 10(b) is the edge image, and Fig. 10(c) shows the detected circles. The detected circles are marked as dotted circles, and the centers are marked by a symbol ‘+’. The experimental results indicate that all of the 33 circular arcs in different orientations can be successfully located. Further it has no false detection, all of the other shaped objects are not detected as circles. It indicates that the proposed method has the ability to detect circles correctly under various orientations. That is, the proposed method is robust for the object orientations.
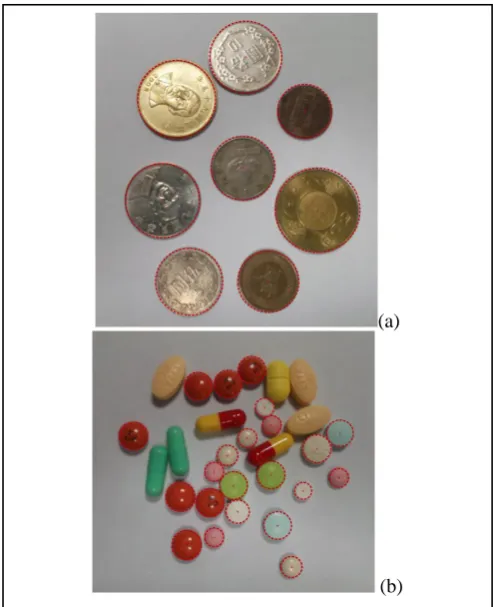
Fig. 11 shows two types of real images evaluated by the proposed method. They are the images of coins and tablet drugs. Both of them contain many circular objects with different sizes. Fig. 12 shows the superimposed images of the detected circles. From the experimental results, it is seen that the proposed method can detect the circular objects of these two types of images correctly. Further, for the cases of occluded coins and tablet drugs, the proposed method can also detect the circular objects correctly without false alarm.
Fig. 11. Two examples of real images contain circular objects:
(a) coins, and (b) tablet drugs.
(a)
(b)
(c)
(a)
Vol. 3 Issue 8, August - 2017
Fig. 12. Superimpose circles on the testing images: (a) coins,
and (b) tablet drugs.
IV. CONCLUSIONS
A hrbrid approach for circle detection is proposed. Instead of transforming pixels into its parameter space by the HT based approaches, a curve is first classify into linear and nonlinear segments. The nonlinear segments are considered as the candidates of circular arcs. The geometric properties are used to estimate the centers and radii of the nonlinear segments. Next, group nonlinear segments into several clusters. A circle will be identified if the cluster of nonlinear segments has a small fitting error. The proposed method has the advantages of requiring rather small storage, high speed, and high accuracy. Both of the synthetic and real images have been tested to evaluate the proposed method. The experimental results indicated that the proposed method is effective in detecting circles.
ACKNOWLEDGMENT
This paper is partially supported by Ministry of Science and Technology, ROC, under grant no. MOST 105-2221-E-214-026.
REFERENCES
[1] F. Attneave, “Some information aspects of visual perception,“ Psychological Review, vol. 61, pp. 183-193, 1954.
[2] V. Ayala-Ramirez, C.H. Garcia-Capulin, A. Perez-Garcia, and R. E. Sanchez-Yanez, “Circle detection on images using genetic algorithms,” Pattern Recognition Letters, vol. 27, pp. 652-657, 2006.
[3] D.H.Ballard, “Generalizing the Hough transform to detect arbitrary shapes,” Pattern Recognition, vol. 13, pp. 111-122, 1981.
[4] F.L. Chen and S. W. Lin, “Subpixel estimation of circle parameters using orthogonal circular detector,” Computer Vision and Image Understanding, vol. 78, pp. 206-221, 2000.
[5] L. H. Chen and K. L. Lee, “A new method for circular object detection and location,” Pattern Recognition Letters, vol. 11, pp. 691-697, 1990.
[6] S.H. Chiu and J. J.Liaw, “An effective voting method for circle detection,” Pattern Recognition Letters, vol. 26, pp. 121-133, 2005.
[7] K. L. Chung, Y. H. Huang, S. M. Shen, A. S. Krylov, D. V. Yurin, E. V. Semeikina, “Efficient sampling strategy and refinement strategy for randomized circle detection,” Pattern Recognition, vol. 45, pp. 252-263, 2012.
[8] E. Cuevas, D. Oliva, D. Zaldivar, M. Pérez-Cisneros, H. Sossa, “Circle detection using electro-magnetism optimization,” Information Sciences, vol. 182, pp. 40–55, 2012.
[9] E. R. Davies, “A modified Hough scheme for general circle location,” Pattern Recognition Letters, vol. 7, pp. 37-43, 1988.
[10] R. O. Duda and P. E. Hart, “Use of Hough transformation to detect lines and curves in pictures,” Communications of the ACM, vol. 15, pp. 11-15, 1972.
[11] C. T. Ho and L. H. Chen, “A fast ellipse/circle detector using geometric symmetry,” Pattern Recognition, vol. 28, pp. 117-124, 1995.
[12] Y. H. Huang, K. L. Chung, W. N. Yang, S. H. Chiu, “Efficient symmetry-based screening strategy to speed up randomized circle-detection,” Pattern Recognition Letters, Vol. 33(16), pp. 2071-2076, 2012.
[13] D. Ioannou, W. Huda, A. F. Laine, “Circle recognition through a 2D Hough transformation and radius histogramming,” Image and Vision Computing, vol. 17, pp. 15-26, 1999.
[14] L. Jiang, “Efficient randomized Hough transform for circle detection using novel probability sampling and feature points,” Optik- Int. J. Light Electron Opt. vol. 123(20), pp. 1834-1840, 2012.
[15] H. S. Kim and J. H. Kim, “A two-step circle detection algorithm from the intersecting chords,” Pattern Recognition Letters, vol. 22, pp. 787-798, 2001. [16] K. B. Lim, K. Xin, G. S. Hong, “Detection and estimation of circular arc segmentations,” Pattern Recognition Letters, vol. 16, pp. 627-636, 1995.
[17] S. C. Pei, J. H. Horng, “Circular arc detection based on Hough transform,” Pattern Recognition Letters, vol. 16, pp. 615-625, 1995.
[18] T. D. Orazioa, C. Guaragnella, M. Leo, A. Distante, “A new algorithm for ball recognition using (a)
Vol. 3 Issue 8, August - 2017 circle Hough transform and neural classifier,” Pattern
Recognition, vol. 37, pp. 393-408, 2004.
[19] A. Torii and A. Imiya, “The randomized-Hough-transform-based method for great-circle detection on sphere,” Pattern Recognition Letters, vol. 28, pp. 1186-1192, 2007.
[20] Z. M. Wojcik, “Quick recognition of circular objects in a black-white picture,” Pattern Recognition Letters, vol. 8, pp. 277-288, 1988.
[21] Z. Yu and C. Bajaj, “Detecting circular and rectangular particles based on geometric feature detection in electron micrographs.” Journal of Structural Biology, vol. 145, pp. 168–180, 2004.