Navninderjit. World Journal of Engineering Research and Technology
UNDERSTANDING USER ACCESS PATTERNS OF WEBSITE VISITS
TO BETTER MARKETING DECISIONS
Dr. Navninderjit Singh*
Assistant Professor, Department of Commerce, Punjabi University, Patiala, India.
Article Received on 01/08/2019 Article Revised on 21/08/2019 Article Accepted on 11/09/2019
ABSTRACT
Analyzing to find how many visitors visited your web site becomes more important, if you are housing business on your web site, to enhance business opportunities and target more potential customers, without disturbing their security and integrity. The graphical results have helped management understand access patterns of the users visiting the web site in a better manner to make marketing decisions, influencing the targeted customers in choosing a good school for their children. After its implementation, some modifications to our business are in pipeline.
INTRODUCTION
The data about the ones who visited the organization’s web site stored as web log on the server.[5] Analyzing the weblogs is the process of evaluating the organization’s web site, analyzing the data, and making alterations in their businesses depending on the analysis.[21] A number of commercial organizations are benefiting by web analysis and have started maximizing their business performance through their web sites.[10] Without good data the organizations cannot do good analysis as analysis is vital for better performance.
Data Collection and Processing
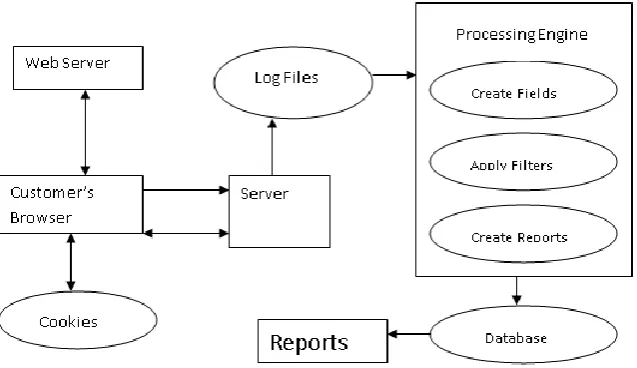
When a visitor browses a page from the web server hosting your web site, the data about that visit is stored in log files. The web server fulfills the visitor’s request by sending the requested page back to the visitor's browser.[3] While the browser is processing the data, the webserver gets in touch with other servers, which might be keeping some portion of the requested page as is shown in figure 1. After the tracking code is received by the browser, the
World Journal of Engineering Research and Technology
WJERT
www.wjert.org
SJIF Impact Factor: 5.218*Corresponding Author
Dr. Navninderjit Singh
Assistant Professor,
Department of Commerce,
Punjabi University, Patiala,
India.
code starts running though the remaining page is loading.[6] While the code executes, it discovers the characteristics of the visitor and the browsing environment he is using.[9] Then it collects the data such as how many times he visited our website and where he is located, etc. One drawback of this process is that it takes more time for the page to display on the browser.
tagged using JavaScript that we want to track for customer information. Without the code on the specific page, that page could not be tracked.
The tracker code written in JavaScript collects the customer’s information, store that data in cookies written in PHP, and the same is forwarded to server.[19] Whenever this tracker code is run after generating a page view, the data is sent to server. Every page view created is identified with a unique name. The tracker dig outs the data from the visitor’s browser.[16] This tracking code could be used for charts and graphs, the on-click attribute of the charts and graphs has been set, and if a user clicks that attribute a page view gets generated.
To track a user for storing his information the server could use to most five first-party cookies.[23] For tracking the user, these cookies are set by the tracking code like for how many times the user visited the site and what is the geographic location of user etc. but these cookies do not store personal data of the user.
RESULTS
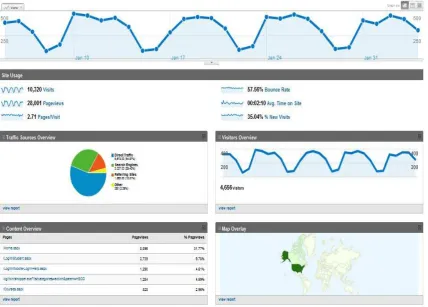
The output is a graphical representation of number of visits of different visitors to our web site.
Figure 3 shows all the traffic sources, like direct traffic, referring sites and search engines. Direct traffic represents, all the visits made directly to www.example.org pages. Referring sites represent, all the web sites which have hyperlink to our web site. Search Engines represent, all the searches made for our web site through Google, Yahoo, MSN, AOL etc. The maximum traffic is due to direct traffic.
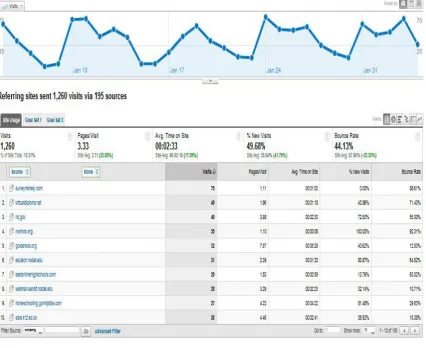
Figure 4 through a line graph shows that all visits made by visitors through referring sites. Referring sites are web pages which have hyperlink to our web site. It also has data displayed in tabular form, describing through which website how many visits to our site have been made. So the management is planning on contacting these websites to accelerate its business.
Figure 4: Visits made to the site through Referring site.
Figure 5: Visits made to our site through Search Engines.
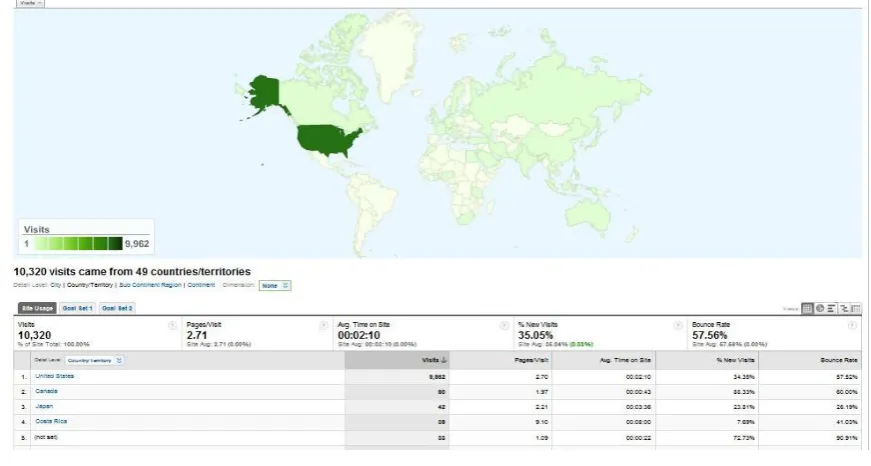
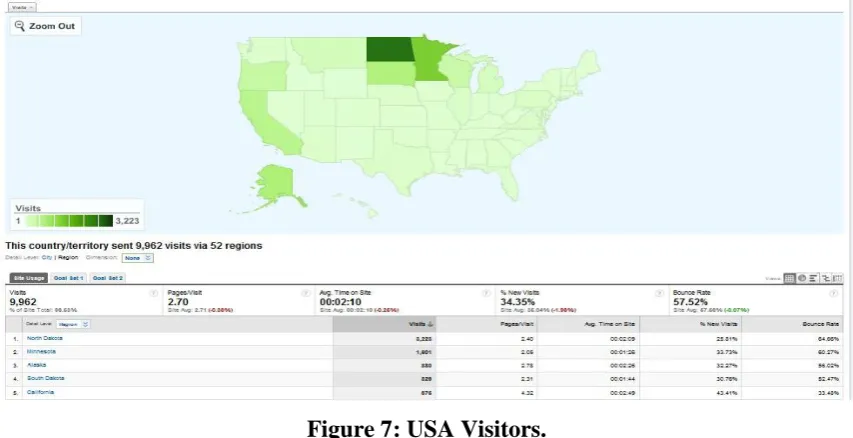
figure, North Dakota has the most visits. Then come Minnesota, Alaska and South Dakota respectively. Light green shows less number of visits. How many visits were made by which state has been represented in the table form also.
Figure 7: USA Visitors.
If we further drill down to states of USA as is shown in Figure 8, we can further see that which city in the state made maximum visits. A random selection of North Dakota state was made. Bigger circles show maximum visits made by that city. As is seen in the figure, Bismarck has the most visits followed by Fargo. Fargo has one small dot within it showing visits made by the West Fargo region. The visits to Bismarck could be attributed to the fact that it is the state capital and our web site is hosted in Fargo city even if we have filtered out all the IP addresses of the employees of our business.
Figure 9 is representing the one-month visit, 1001, of the visitors in the form of a line chart in Fargo city. The maximum visits, 60, took place in one month. The visitors spent about 1 minute and 33 seconds on the web site. Out of total visits about 30.70% visits were made by new customers.
Figure 9: Fargo city Visitors details.
CONCLUSIONS
From the results we found out that during weekdays visits to our web site are more than during weekends. Direct Traffic is because of the enrolled students, but our site is visited through search engines and referred sites too. It is found out that North Dakota has the most visitor, which is our home state, and the neighboring states South Dakota and Minnesota follows the trend.
REFERENCES
5. Gagneja K.K., “Secure Communication Scheme for Wireless Sensor Networks to maintain Anonymity”, IEEE ICNC, Anaheim, California, USA, Feb. 16-19, 2015; 1142-1147. 6. Gagneja K.K., "Pairwise Post Deployment Key Management Scheme for Heterogeneous
Sensor Networks", 13th IEEE WoWMoM 2012, San Francisco, California, USA, 2012; 1-2: 25-28.
7. Gagneja K.K., “Global Perspective of Security Breaches in Facebook”, FECS, Las Vegas, USA, 2014; July 21-24.
8. Gagneja K.K., "Pairwise Key Distribution Scheme for Two-Tier Sensor Networks", IEEE ICNC, Honolulu, Hawaii, USA, 2014; 1081-1086: 3-6.
9. Gagneja K., Nygard K., "Energy Efficient Approach with Integrated Key Management Scheme for Wireless Sensor Networks", ACM MOBIHOC, Bangalore, India, 2013; 13-18: July 29.
10.Gagneja K.K., Nygard K., "A QoS based Heuristics for Clustering in Two-Tier Sensor Networks", IEEE FedCSIS 2012, Wroclaw, Poland, 2012; 779-784: 9-12.
11.K. K. Gagneja, K. E. Nygard and N. Singh, "Tabu-Voronoi Clustering Heuristics with Key Management Scheme for Heterogeneous Sensor Networks", IEEE ICUFN 2012, Phuket, Thailand, 2012; 46-51: July 4-6.
12.Gagneja K.K., Nygard K., "Key Management Scheme for Routing in Clustered Heterogeneous Sensor Networks", IEEE NTMS, Security Track, Istanbul, Turkey, 2012; 1-5: 7-10.
13.Runia Max, Gagneja K.K., “Raspberry Pi Webserver”, ESA, Las Vegas, USA, July 27-30, 2015.
14.S. Gagneja and K. K. Gagneja, "Incident Response through Behavioral Science: An Industrial Approach," 2015 International Conference on Computational Science and Computational Intelligence (CSCI), Las Vegas, NV, 2015, pp. 36-41.
15.Tirado E., Turpin B., Beltz C., Roshon P., Judge R., Gagneja K., “A New Distributed Brute-Force Password Cracking Technique”, Future Network Systems and Security, FNSS Communications in Computer and Information Science, 2018; 878: 117-127.
16.Caleb Riggs, Tanner Douglas and Kanwal Gagneja, "Image Mapping through Metadata," Third International Conference on Security of Smart Cities, Industrial Control System and Communications (SSIC), Shanghai, China, 2018; 1-8.
18.Javier Campos, Slater Colteryahn, Gagneja Kanwal, “IPv6 transmission over BLE Using Raspberry PI 3", International Conference on Computing, Networking and Communications, Wireless Networks (ICNC'18 WN), March, 2018; 200-204.
19.Gagneja K., Jaimes L.G., “Computational Security and the Economics of Password Hacking”, Future Network Systems and Security. FNSS 2017. Communications in Computer and Information Science, 2017; 759: 30-40.
20.Gagneja K.K. Ranganathan P., Boughosn S., Loree P. and Nygard K., "Limiting Transmit Power of Antennas in Heterogeneous Sensor Networks", IEEE EIT2012, IUPUI Indianapolis, IN, USA, 2012; 1-4: 6-8.
21.C. Riggs, J. Patel and K. Gagneja, "IoT Device Discovery for Incidence Response," Fifth Conference on Mobile and Secure Services (MobiSecServ), Miami Beach, FL, USA, 2019; 1-8.
22.S. Godwin, B. Glendenning and K. Gagneja, "Future Security of Smart Speaker and IoT Smart Home Devices," Fifth Conference on Mobile and Secure Services (MobiSecServ), Miami Beach, FL, USA, 2019; 1-6.
23.Keely Hill, Kanwalinderjit Kaur Gagneja, Navninderjit Singh, “LoRa PHY Range Tests and Software Decoding - Physical Layer Security”, 6th IEEE International Conference on Signal Processing and Integrated Networks (SPIN 2019), 7 - 8 March 2019.
24.Alexandro Riuz, Carloas Machdo, Kanwal Gagneja, Navninderjit Singh, “Messaging App uses IRC Servers and any Available Channel”, 6th IEEE International Conference on Signal Processing and Integrated Networks (SPIN 2019), 7 - 8 March 2019.
25.Nica Ameeno, Kalib Sherry, Kanwal Gagneja, “Using Machine Learning to detect the File Compression or Encryption”, AJCS, 2019.