228
INTRODUCTION
Modern agriculture is inseparably linked with information technologies, especially mathemati-cal and statistimathemati-cal modeling, geo-informational technologies (GIS), remote sensing technologies for environmental monitoring, etc. It is neces-sary to develop and apply in production new ap-proaches for the prediction of crop yields through the mathematical estimation of the productivity related indices, especially, an important modern index obtained by the remote sensing – the nor-malized difference vegetation index (NDVI). The use of remotely sensed index provides the possi-bility of making on time predictions of the crops productivity and does not require complicated and prolonged in-field measurements to obtain the in -put data for the forecasting (Kouadio et al., 2014). Moreover, the NDVI screens are mostly provided
in a timely manner and often are free of charge that makes the use of the index more attractive even for the little-scale farmers and scientific institutions with a limited budget (Maas, 1988; Atzberger, 2013). NDVI is obtained through the space sensing and calculated by the Eq (1):
1
1
𝑁𝑁𝑁𝑁𝑁𝑁𝑁𝑁=(𝑎𝑎(𝑎𝑎𝑛𝑛𝑛𝑛𝑛𝑛− 𝑎𝑎𝑣𝑣𝑛𝑛𝑣𝑣)
𝑛𝑛𝑛𝑛𝑛𝑛+𝑎𝑎𝑣𝑣𝑛𝑛𝑣𝑣)
(1)
𝐿𝐿𝐿𝐿𝑁𝑁=𝐿𝐿𝐿𝐿×𝑃𝑃𝑁𝑁 10000
(2) (1)
where: anir is the reflective infrared range of the spectrum, avisis the visible red range of the spectrum (Carlson and Ripley, 1997). It is considered that the NDVI values are strongly dependent on the indices of the crops, namely: leaf area index (LAI), herbage devel-opment, general development of the vegetative cover, etc. (Gamon et al., 1995; Carlson and Ri-pley, 1997). For example, Gamon et al. (1995) determined that the NDVI and LAI provided the
Accepted: 2020.02.15 Available online: 2020.03.16
Volume 21, Issue 3, April 2020, pages 228–236
https://doi.org/10.12911/22998993/118274
Sweet Corn Yield Simulation Using Normalized Difference
Vegetation Index and Leaf Area Index
Pavlo Lykhovyd
11 Department of Scientific and Innovative Activity, Transfer of Technologies and Intellectual Property, Institute of Irrigated Agriculture of NAAS, Naddniprianske, 73483, Kherson, Ukraine
e-mail: [email protected]
ABSTRACT
The authors determined the accuracy and reliability of yielding models by using the values of two differently obtained indices – the leaf area index (LAI) obtained through direct surface measurements, and the normalized difference vegetation index (NDVI) obtained through spatial remote sensing of crops. The study based on the drip-irrigated sweet corn yielded the data obtained in the field experiment held in the semi-arid climate on dark-chestnut soil in the South of Ukraine. The suitability of the LAI and NDVI for the simulation of sweet corn yields
was estimated by the regression analysis of the yielding data by correlation (R) and determination (R2) coefficients.
Additionally, mathematical models for the crop yields estimation based on the regression analysis were developed.
It was determined that LAI is a more suitable index for the crop yield prediction: the R2 value was 0.92 and 0.94
against 0.85 for the NDVI-based models.I It was determined that it is better to use the LAI values obtained at the
stage of flowering, when R2 averaged to 0.94, and the NDVI-based models does not depend on the crop stage (the
R2 was 0.85 both for the flowering and ripening stages of the plant development). The combined NDVI-LAI model
showed that there is no necessity in the complication of the LAI-based model through introduction of the remotely
sensed index because of insignificant improvement in the performance (R2 was 0.94 and 0.92).
229 strong correlation with the coefficients of 0.912
(for total LAI) and 0.949 (for green LAI). Thus, the NDVI could be possibly used as an alternative for the LAI, which is calculated as the ratio of the leaf surface area of plants to the total area of the covered land (Bréda, 2003), to provide a compre-hensive and reliable assessment of the crop con-ditions and projective productivity.The NDVI is believed to be an indicator of the potential pho-tosynthetic activity of plants, and, as a result, the index of the phytocenosis productivity (Sellers, 1985; Myneni et al., 1995).
Therefore, the main goal of our study was to determine whether it is possible to completely re-place the conventional crop productivity indices (for example, the directly measured LAI) in the crops productivity models with the spatial NDVI. Therefore, the authors decided to perform yield prediction modeling based on the LAI and NDVI values on the example of a sample crop (sweet corn) and compare the accuracy and reliability of each forecasting method. It is necessary because if the NDVI-based crop prediction models are to be used, it is necessary to know all the weak and strong points of this kind of models.It is known that the spatial NDVI data are often not a reli -able source of the information on the crop condi-tion due to the dependence of the NDVI values on a number of parameters, namely: the quality of the NDVI screening equipment; the conditions of weather, especially cloudiness that can deterio-rate the quality of the screening; the soil reflective ability that often leads to the disturbances in the screening of the real NDVI values; violation of a direct correlation between the NDVI and other vegetation-related indices (such as LAI) with the increased vegetation mass development (Liu and Huete, 1995). Moreover, the authors performed a combined yield modeling by parallel implemen-tation of both LAI and NDVI as the inputs for the crop model to find out whether a combined use of these crop indices improves or, conversely, dete-riorates the accuracy and reliability of the yield-ing model.
MATERIALS AND METHODS
The authors chose sweet corn (Zea mays L. ssp. saccharata Sturt.) cultivated in the field ex -periment on the cultivation technology elements (plowing depth, fertilization and plants density) estimation at drip irrigation in the semi-arid
climate zone of the South of Ukraine as a sample crop for the conduction of the prediction model’s assessment. The geographical coordinates of the experimental field are: 46°68′N, 32°26′E, the al -titude of 42 m. The scheme of the experiment, which was conducted in 2016, is as follows:
• Factor A – plowing depth: 20-22 and 28-30 cm;
• Factor B – mineral fertilizers applied: No fer -tilizers, N60P60, N120P120;
• Factor C – plants density (this parameter was finally formed manually at the stage of 3-5 leaves of the crop): 35, 50, 65, 80 thousand plants per ha.
In order to evaluate the accuracy of the yield predictions by the different modeling approaches, the yield of the crop in the ears without husks was assessed at the stage of the technical ripe-ness through the picking and weighing of the ears from the entire area of every experimental plot (in 4 replications). Picking and weighing were per-formed in accordance to methodology of the ex-perimental work in irrigated agriculture which is generally accepted in the South of Ukraine (Ush-karenko et al., 2014). Only marketable ears were used in the assessment.
The NDVI values were obtained by using the system of precise agriculture OneSoil ® (onesoil. ai/en), which provides the screens of fields from satellites Sentinel-1 and Sentinel-2. The system provides the accuracy of recognition F1 of 0.9, the speed of the artifacts processing of 30 ms, the accuracy of the automatic field borders recogni -tion IoU of 0.85. The NDVI values were taken by all the replications of the study using the scaled screens obtained at the certain periods of the crop development (flowering and ripening stages) on July, 14th and July, 26th, 2016. LAI was calculated by the results of the direct field measurements of the leaf area of the plants per the unit of area considering the density of the crops (Ushkarenko et al., 2014). The leaf area measurements were performed using a common ruler. The withered leaves were not taken into consideration, so only pure green LAI were obtained and estimated in the study. LAI was calculated by using Eq. (2):
1
1
𝑁𝑁𝑁𝑁𝑁𝑁𝑁𝑁=((𝑎𝑎𝑎𝑎𝑛𝑛𝑛𝑛𝑛𝑛− 𝑎𝑎𝑣𝑣𝑛𝑛𝑣𝑣)
𝑛𝑛𝑛𝑛𝑛𝑛+𝑎𝑎𝑣𝑣𝑛𝑛𝑣𝑣)
(1)
𝐿𝐿𝐿𝐿𝑁𝑁=𝐿𝐿𝐿𝐿×𝑃𝑃𝑁𝑁 10000
(2) (2)
where: LA is the leaf area per plant (m2), PDis the
230
All the data obtained and used in the work were processed by using the multiplicative ANO -VA and linear regression analysis at the probabili -ty level of 95% with further building up the model for the yield prediction based on the calculated re-gression coefficients. Standard calculation proce -dures were used and performed in the Microsoft Excel software (Triola, 2013). The significance of the differences between the studied experimental variants was assessed using the least significant difference (LSD05). The differences between the variants are significant if they do not exceed the LSD05 values for the compared pair of the values within the factor.
The reliability of the developed crop predic -tion models was assessed by the comparison of the calculated during the regression analysis val-ues of the determination coefficients (R2) of each
model. The higher the coefficient is, the more reli -able and accurate the model is.
RESULTS
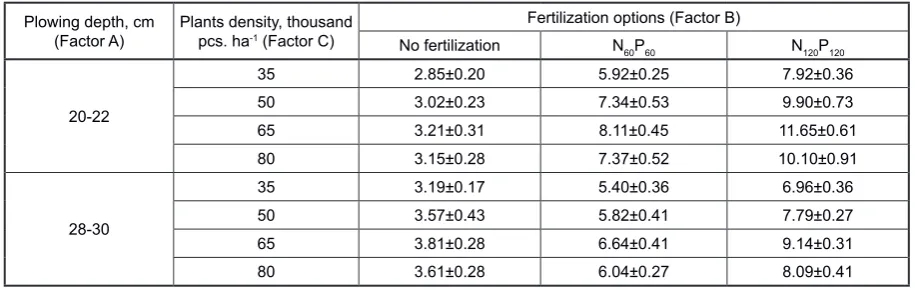
Sweet corn yield in the ears without husks obtained in the field experiment is represented in Table 1. The values are provided in the following form: the average value by the experimental plot ± standard deviation (SD) for the certain plot.
All the studied factors affected the yield ob -tained in the experiment that is testified by the values of the least significant difference, calcu -lated at the probability level of 95% (LSD05). The differences between the variants do not exceed the LSD05 values, so they cannot be considered significant.
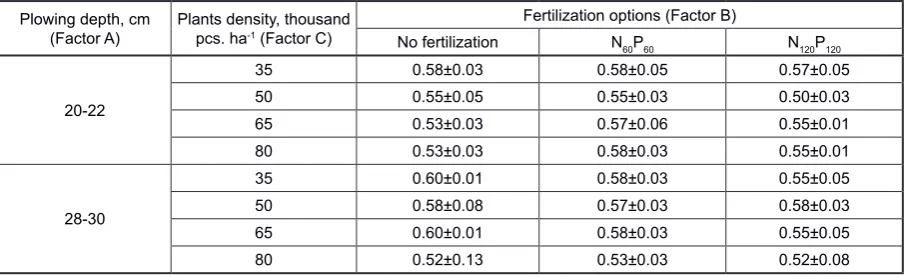
The corresponding values of the LAI at two stages of the crop development are presented in
Tables 2 and 3, while the NDVI values for the same estimation periods are provided in Tables 4 and 5. It should be noted that while the LAI values differ significantly throughout the experiment, the differences between the NDVI values are signifi -cant only for the comparison of the main effect by the plants density (factor C). All other differences cannot be associated with the influence of the fac -tors studied in the experiment.
The results of the regression analysis of the experimental data testify that there is a strong direct correlation between the LAI and NDVI values and the yield of sweet corn. Coefficients of correlation for the different stages of the crop development averaged to 0.92 for the NDVI-based, and to 0.96-0.97 for the LAI-based model of the crop productivity.I It was determined that the LAI-based model accuracy is unequal at the different stages of the crop development, and it is better to use the LAI values at the flowering stage of the crop to obtain the most reliable yield prediction.
The results of the regression analysis per -formed for the combined use of LAI and NDVI showed that there is no reason to complicate the LAI-based model with additional index because the coefficients of determination R2 both at the
stage of flowering and ripening of the crop were equal to those obtained in the simple LAI-based model (Table 8). Therefore, there is no need in an additional parameter for the yield estimation.
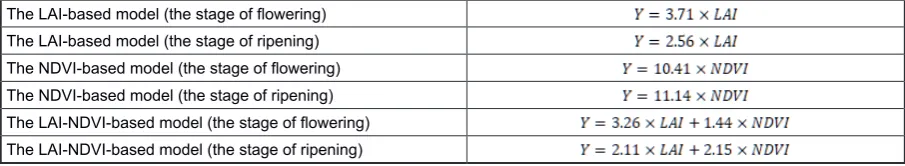
The authors also developed the mathemati -cal regression models for the crop productivity in connection with the LAI and NDVI values at the different stages of the crop development, and these models are presented in Table 9.
The highest percentile of the developed mod -els was 97.92, while the lowest one was about
Table 1. Sweet corn yield in ears without husks in dependence on the studied factors, t ha-1 (2016 year ±SD) Plowing depth, cm
(Factor A) Plants density, thousand pcs. ha-1 (Factor C)
Fertilization options (Factor B)
No fertilization N60P60 N120P120
20-22
35 2.85±0.20 5.92±0.25 7.92±0.36
50 3.02±0.23 7.34±0.53 9.90±0.73
65 3.21±0.31 8.11±0.45 11.65±0.61
80 3.15±0.28 7.37±0.52 10.10±0.91
28-30
35 3.19±0.17 5.40±0.36 6.96±0.36
50 3.57±0.43 5.82±0.41 7.79±0.27
65 3.81±0.28 6.64±0.41 9.14±0.31
80 3.61±0.28 6.04±0.27 8.09±0.41
Table 2. LAI of sweet corn at the stage of flowering in dependence on the studied factors (2016 year ±SD)
Plowing depth, cm
(Factor A) Plants density, thousand pcs. ha-1 (Factor C)
Fertilization options (Factor B)
No fertilization N60P60 N120P120
20-22
35 2.85±0.20 5.92±0.25 7.92±0.36
50 3.02±0.23 7.34±0.53 9.90±0.73
65 3.21±0.31 8.11±0.45 11.65±0.61
80 3.15±0.28 7.37±0.52 10.10±0.91
28-30
35 3.19±0.17 5.40±0.36 6.96±0.36
50 3.57±0.43 5.82±0.41 7.79±0.27
65 3.81±0.28 6.64±0.41 9.14±0.31
80 3.61±0.28 6.04±0.27 8.09±0.41
Note: LSD05 for the factors and their interaction, units: A – 0.005; B – 0.005; C – 0.007; ABC – 0.017.
Table 3. LAI of sweet corn at the stage of ripening in dependence on the studied factors (2016 year ±SD)
Plowing depth, cm
(Factor A) Plants density, thousand pcs. ha-1 (Factor C)
Fertilization options (Factor B)
No fertilization N60P60 N120P120
20-22
35 1.31±0.01 1.60±0.01 2.27±0.02
50 1.81±0.01 2.19±0.01 3.11±0.02
65 2.29±0.01 2.72±0.01 3.86±0.02
80 2.73±0.01 3.19±0.01 4.55±0.02
28-30
35 1.32±0.00 1.38±0.01 1.56±0.02
50 1.84±0.01 1.87±0.01 2.14±0.01
65 2.32±0.01 2.33±0.01 2.68±0.01
80 2.75±0.01 2.78±0.02 3.16±0.02
Note: LSD05 for the factors and their interaction, units: A – 0.005; B – 0.006; C – 0.008; ABC – 0.018.
Table 4. NDVI of sweet corn at the stage of flowering of millet in dependence on the studied factors (2016 year ±SD)
Plowing depth, cm
(Factor A) Plants density, thousand pcs. ha-1 (Factor C)
Fertilization options (Factor B)
No fertilization N60P60 N120P120
20-22
35 0.67±0.08 0.60±0.08 0.60±0.09
50 0.57±0.03 0.57±0.03 0.58±0.06
65 0.63±0.03 0.57±0.03 0.53±0.03
80 0.62±0.03 0.62±0.05 0.60±0.05
28-30
35 0.65±0.13 0.60±0.10 0.60±0.00
50 0.62±0.08 0.62±0.03 0.62±0.06
65 0.65±0.00 0.63±0.03 0.62±0.06
80 0.55±0.05 0.48±0.05 0.55±0.09
Note: LSD05 for the factors and their interaction, units: A – 0.02; B – 0.02; C – 0.03; ABC – 0.08.
Table 5. NDVI of sweet corn at the stage of ripening in dependence on the studied factors (2016 year ±SD)
Plowing depth, cm
(Factor A) Plants density, thousand pcs. ha-1 (Factor C)
Fertilization options (Factor B)
No fertilization N60P60 N120P120
20-22
35 0.58±0.03 0.58±0.05 0.57±0.05
50 0.55±0.05 0.55±0.03 0.50±0.03
65 0.53±0.03 0.57±0.06 0.55±0.01
80 0.53±0.03 0.58±0.03 0.55±0.01
28-30
35 0.60±0.01 0.58±0.03 0.55±0.05
50 0.58±0.08 0.57±0.03 0.58±0.03
65 0.60±0.01 0.58±0.03 0.55±0.05
80 0.52±0.13 0.53±0.03 0.52±0.08
232
Table 6. Regression analysis of the dependence of sweet corn yield in ears without husks on the LAI values at the different stages of the crop development
Coefficient of correlation Coefficient of determination Coefficient of regression (slope) Interception
flowering ripening flowering ripening flowering ripening flowering ripening
0.97 0.96 0.94 0.92 3.71 2.56 0 0
Table 7. Regression analysis of the dependence of sweet corn yield in ears without husks on the NDVI values at the different stages of the crop development
Coefficient of correlation Coefficient of determination Coefficient of regression (slope) Interception
flowering ripening flowering ripening flowering ripening flowering ripening
0.92 0.92 0.85 0.85 10.41 11.14 0 0
Table 8. Regression analysis of the dependence of sweet corn yield in ears without husks on the LAI-NDVI values at the different stages of the crop development
Coefficient of correlation determinationCoefficient of Coefficient of regression (slope) Interception
flowering ripening flowering ripening flowering ripening flowering ripening
0.97 0.96 0.94 0.92 LAI NDVI LAI NDVI 0 0
3.26 1.44 2.11 2.15
Table 9. Linear regression models of sweet corn yield in ears without husks depending on the LAI and NDVI
values measured at the different stages of the crop development, where Y is the yield of the crop, LAI and NDVI
are the values of the corresponding indexes
The LAI-based model (the stage of flowering)
The LAI-based model (the stage of ripening)
The NDVI-based model (the stage of flowering)
The NDVI-based model (the stage of ripening)
The LAI-NDVI-based model (the stage of flowering)
The LAI-NDVI-based model (the stage of ripening)
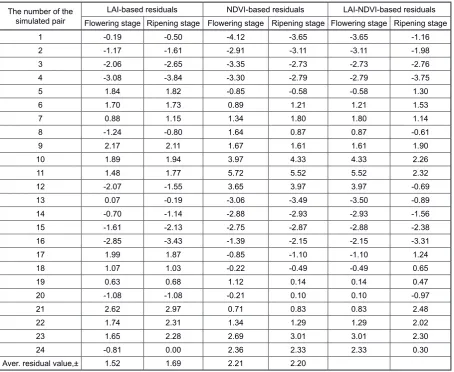
2.08. The best performance of the models could be obtained for the predictions of the crop yield in the variants with full fertilization (N120P120); conversely, the worst performance, is obtained at the prediction of the yields in the non-fertil-ized variants due to the higher disparity between the LAI, NDVI and yields in these variants. The comparison of the true and predicted values of the crop yields is presented in Table 10.
It is evident that the NDVI-based model provided considerably higher average residuals values in comparison to the LAI-based and the LAI-NDVI-based one: 2.20-2.21 versus 1.52-1.69 versus 1.67-2.21.The range of the residu -als was considerably higher under the imple-mentation of the NDVI-based model: -4.12… 5.72 against -3.84…2.97 for the LAI-based,
DISCUSSION
Yield forecasting is a highly important task of modern agricultural science that ensures national and global food safety (Horie et al., 1992). Re-cently, the NDVI has been used to forecast pro -ductivity of different crops under various envi -ronmental conditions. The results of some studies are quite encouraging but at the same time there are some studies that report certain difficulties and inconveniences related to the noisy data of the NDVI space screening that resulted in consider -able inaccuracy of the crop yielding models. For example, Quarmby et al. (1993) reported success-ful use of the NDVI data for operational monitor -ing of the conditions of such crops as wheat, cot-ton, rice and corn in the area of Northern Greece. They have also claimed quite a high reliability and accuracy of a simple linear regression model of “NDVI-yield” inter-relationship for every studied crop and suggested that NDVI is very good for
the purposes of crop productivity forecasting. The corn production estimations based on the NDVI-based model with the coefficient of regression R 0.75 were performed by Lewis et al. (1998), who claimed that the NDVI-based simple re -gression models are very encouraging. A suc-cessful introduction of the NDVI in the complex model for estimation of corn and soybean yields has been performed by Prasad et al. (2006). How-ever, their model did not use the NDVI as a self-sufficient individual index for the crop yield as in our study. The study, which was conducted in order to predict the rice yields in China, revealed that the NDVI tends to always have a positive correlation with the crop yield that agrees with the results of our study (Huang et al., 2013). In this study, the authors reported about a relatively low error of the NDVI-based yield model of the maximum 5.82%. Balaghi et al. (2008) tried to use the NDVI, rainfall and temperature data for an early prediction of wheat yields in Morocco Table 10. The comparison of true and predicted yields of sweet corn by using the LAI and NDVI based crop
models by the residuals, t ha-1
The number of the simulated pair
LAI-based residuals NDVI-based residuals LAI-NDVI-based residuals Flowering stage Ripening stage Flowering stage Ripening stage Flowering stage Ripening stage
1 -0.19 -0.50 -4.12 -3.65 -3.65 -1.16
2 -1.17 -1.61 -2.91 -3.11 -3.11 -1.98
3 -2.06 -2.65 -3.35 -2.73 -2.73 -2.76
4 -3.08 -3.84 -3.30 -2.79 -2.79 -3.75
5 1.84 1.82 -0.85 -0.58 -0.58 1.30
6 1.70 1.73 0.89 1.21 1.21 1.53
7 0.88 1.15 1.34 1.80 1.80 1.14
8 -1.24 -0.80 1.64 0.87 0.87 -0.61
9 2.17 2.11 1.67 1.61 1.61 1.90
10 1.89 1.94 3.97 4.33 4.33 2.26
11 1.48 1.77 5.72 5.52 5.52 2.32
12 -2.07 -1.55 3.65 3.97 3.97 -0.69
13 0.07 -0.19 -3.06 -3.49 -3.50 -0.89
14 -0.70 -1.14 -2.88 -2.93 -2.93 -1.56
15 -1.61 -2.13 -2.75 -2.87 -2.88 -2.38
16 -2.85 -3.43 -1.39 -2.15 -2.15 -3.31
17 1.99 1.87 -0.85 -1.10 -1.10 1.24
18 1.07 1.03 -0.22 -0.49 -0.49 0.65
19 0.63 0.68 1.12 0.14 0.14 0.47
20 -1.08 -1.08 -0.21 0.10 0.10 -0.97
21 2.62 2.97 0.71 0.83 0.83 2.48
22 1.74 2.31 1.34 1.29 1.29 2.02
23 1.65 2.28 2.69 3.01 3.01 2.30
24 -0.81 0.00 2.36 2.33 2.33 0.30
234
by the empirical regression model and succeeded. Besides, scientists stated that the NDVI reliabil -ity in the crop conditions assessment increases, if the indices of later stages of the crop vegetation period are used (Thomason et al., 2007), which agrees with our results (more reliable prediction of yield by the NDVI at the later stage of the crop development). Rasmussen (1992) stated that it is possible to assess the millet yields and produc-tion levels based on the NDVI integral values. The scientist reported the sufficient accuracy of the iNDVI-based predictive model.
Even though a number of scientists claim good performance of the NDVI-based models for crops, there are some recent scientific studies that are not as optimistic in this question. For exam-ple, Fang et al. (2011) conducted a great testing of four different crop models using two different approaches: the models, based on a certain sepa-rate index, and the model, based on the complex use of the indices. Fang et al. (2011) used three main indices for the estimation of the crops: LAI, NDVI, and the enhanced vegetation index (EVI). The results of their study revealed that the pre -dicted yield of corn was quite different at the use of different modeling approaches. The best per -formance was provided by the combined EVI-LAI model (with the discrepancy of only 3.5% in comparison to the actual data). The LAI-based model resulted in 8.6% discrepancy, and the sepa-rate use of the EVI and NDVI provided the worst results (the discrepancy of 13-21%). Thus, Fang et al. (2011) concluded that it is unacceptable to use the NDVI or EVI values as self-sufficient markers of corn productivity. This conclusion is in the agreement with ours, with the only distinc-tion that we obtained even lower reliability of the NDVI-based prediction of the crop yield. In ad -dition, Aparicio et al. (2000) provided the proof that the use of the NDVI for grain yield of du -rum wheat is justified only at the LAI level of the crops less than 3. At higher values of the LAI, the NDVI-based model usefulness is questionable.
Nevertheless, the LAI-based crop prediction models are very good. In the conducted study, we obtained the highest value of the determination coefficient of 0.94, while other scientists obtained the values of 0.49-0.55 for rice (Son et al., 2013), and 0.23-0.48 for winter wheat yields simulation (Huang et al., 2015). It has to be mentioned that the values of the determination coefficient of 0.75 and lower could not be considered as the markers of high reliability and accuracy of the developed
prediction models for crops. Therefore, LAI might not be used for every crop under every ag-ricultural and environmental condition.
Scientists suggest that it might be very useful to elaborate the crop models, which will be able to handle and operate with the complex of the LAI, NDVI, and other remotely or directly sensed indices related to the crop productivity, because our results showed that the combination of only the LAI and NDVI might be insufficient for sig -nificant improvement of the model. Now, there is no generally accepted point of view on the use of the simple or complex NDVI-based models for crops prediction. Most researchers claim that if precise predictions are beeded it would be better to implement complex models. However, the in-dices that must be included in the complex yield-ing model are still a subject of debates and further investigations are required to come up with a final conclusion in this question. Another opinion is that in fact both simple single-index-based mod-els and complex multi-index modmod-els are needed because both these types of models are useful for different purposes (Boote et al., 1996).
Jiang et al. (2004) provided the report on the study where they implemented an artificial neural network approach to the creation of the model for yield estimation using remotely sensed indices and claimed very high reliability and accuracy of the created model. Perhaps, the implementation of modern computational techniques, such as ar-tificial neural networks, is one of the most pro -spective ways to develop highly accurate yielding models for crops.
CONCLUSIONS
Even though the remotely sensed NDVI is an important modern index reflecting conditions of crops, it has been found out that it is less suit-able for relisuit-able and accurate prediction of crops productivity (R2 = 0.85) in comparison with the
directly measured LAI. LAI is an old index used for the assessment of crops status at the concrete moment of their development; however, it ap-peared to be more reliable for the productivity prediction than the NDVI (R2 = 0.92 – 0.94). It
obtained in another time resulted in the decrease of prediction reliability. However, comparatively lower accuracy of the NDVI-based prediction could be put upon the fact of noisy NDVI data provided by the monitoring service, and imper-fection of the reflection by the NDVI of the crops canopy condition due to the weather conditions and soil albedo. Modern techniques for obtaining more accurate NDVI data should be applied into the modern remote sensing systems to prevent the occurrence of spoilt and noisy datasets (Hird and McDermid, 2009).The unnecessary complica -tion of the LAI-based model for yield predic-tion by the inclusion of additional input of the NDVI was discovered. Further studies in this area are required to be conducted for other crops and en-vironmental conditions because of a great impor-tance of comprehensive and efficient use of mod -ern methods of remote sensing of environment in theoretical agricultural science and practice.
REFERENCES
1. Aparicio N., Villegas D., Casadesus J., Araus J.S.,
Royo C. 2000. Spectral vegetation indices as nonde-structive tools for determining durum wheat yield. Agron. J., 92(1), 83-91. http://doi.org/10.2134/ agronj2000.92183x
2. Atzberger C. 2013. Advances in remote sensing of agriculture: Context description, existing opera-tional monitoring systems and major information needs. Remote Sens., 5(2), 949-981. http://doi. org/10.3390/rs5020949
3. Balaghi R., Tychon B., Eerens H., Jlibene M. 2008.
Empirical regression models using NDVI, rain-fall and temperature data for the early prediction of wheat grain yields in Morocco. Intern. J. Appl. Earth Observ. Geoinform., 10(4), 438-452. https:// doi.org/10.1016/j.jag.2006.12.001
4. Boote K.J., Jones J.W., Pickering N.B. 1996.
Poten-tial uses and limitations of crop models. Agron. J., 88(5), 704-716. http://doi.org/10.2134/agronj1996. 00021962008800050005x
5. Bréda N.J.J. 2003. Ground-based measurements of
leaf area index: a review of methods, instruments and current controversies. J. Experiment. Bot., 54(392), 2403–2417. http://doi.org/10.1093/jxb/erg263
6. Carlson T.N., Ripley D.A. 1997. On the relation
be-tween NDVI, fractional vegetation cover, and leaf area index. Remote Sens. Environ., 62(3), 241-252. https://doi.org/10.1016/S0034-4257(97)00104-1
7. Daughtry C.S.T. 1990. Direct measurements of
canopy structure. Remote Sens. Rev., 5(1), 45–60. http://doi.org/10.1080/02757259009532121
8. Fang H., Liang S., Hoogenboom G. 2011. Integra-tion of MODIS LAI and vegetaIntegra-tion index products with the CSM-CERES-Maize model for corn yield estimation. Intern. J. Remote Sens., 32(4), 1039-1065. http://doi.org/10.1080/01431160903505310
9. Gamon J.A., Field C.B., Goulden M.I., Griffin
K.L., Hartley A.E., Joel G., Penuetas J., Valentini R. 1995. Relationships between NDVI, canopy structure, and photosynthesis in three Californian vegetation types. Ecol. Appl., 5(1), 28-41. https:// doi.org/10.2307/1942049
10. Hird J.N., McDermid G.J. 2009. Noise reduction of NDVI time series: An empirical comparison of selected techniques. Remote Sens. Environ., 113(1), 248-258. http://doi.org/10.1016/j.rse.2008.09.003 11. Horie T., Yajima M., Nakagawa H. 1992. Yield
fore-casting. Agric. Syst., 40(1-3), 211-236. http://doi. org/10.1016/0308-521X(92)90022-G
12. Huang J., Tian L., Liang S., Ma H., Becker-Reshef I., Huang Y., Su W., Zhang X., Zhu D., Wu W. 2015. Improving winter wheat yield estimation by assimi-lation of the leaf area index from Landsat TM and MODIS data into the WOFOST model. Agric. For. Meteorol., 204, 106-121. http://doi.org/10.1016/j. agrformet.2015.02.001
13. Huang J., Wang X., Li X., Tian H., Pan Z. 2013. Re-motely sensed rice yield prediction using multi-tem-poral NDVI data derived from NOAA‘s-AVHRR. PloS One, 8(8), e70816. https://doi.org/10.1371/ journal.pone.0070816
14. Jiang D., Yang X., Clinton N., Wang N. 2004. An artificial neural network model for estimating crop yields using remotely sensed information. Intern. J. Remote Sens. 25(9): 1723-1732. http://doi. org/10.1080/0143116031000150068
15. Kouadio L., Newlands N.K., Davidson A., Zhang Y., Chipanshi A. 2014. Assessing performance of MODIS NDVI and EVI for seasonal crop yield fore-casting at the ecodistrict scale. Remote Sens., 6(10), 10193-10214. https://doi.org/10.3390/rs61010193 16. Lewis J.E., Rowland J.J., Nadeau A. 1998.
Es-timating maize production in Kenya using NDVI: some statistical considerations. Intern. J. Remote Sens., 19(13), 2609-2617. http://doi. org/10.1080/014311698214677
17. Liu Q., Huete A. 1995. A feedback based modifica-tion of the NDVI to minimize canopy background and atmospheric noise. IEEE T. Geosci. Remote Sens., 33(2), 457-465. https://doi.org/ 10.1109/ TGRS.1995.8746027
18. Maas S.J. 1988. Use of remotely-sensed in-formation in agricultural crop growth mod-els. Ecol. Model., 41(3-4), 247-268. http://doi. org/10.1016/0304-3800(88)90031-2
236
indexes. IEEE T. Geosci. Remote Sens., 33(2), 481-486. http://doi.org/10.1109/36.377948
20. Prasad A.K., Chai L., Singh R.P., Kafatos M. 2006. Crop yield estimation model for Iowa using remote sensing and surface parameters. Intern. J. Appl. Earth Observ. Geoinform., 8(1), 26-33. https://doi. org/10.1016/j.jag.2005.06.002
21. Quarmby N.A., Milnes M., Hindle T.L., Silleos N. 1993. The use of multi-temporal NDVI measure-ments from AVHRR data for crop yield estimation and prediction. Intern. J. Remote Sens., 14(2), 199-210. https://doi.org/10.1080/01431169308904332 22. Rasmussen M.S. 1992. Assessment of millet
yields and production in northern Burkina Faso using integrated NDVI from the AVHRR. Intern. J. Remote Sens., 13(18), 3431-3442. http://doi. org/10.1080/01431169208904132
23. Sellers P.J. 1985. Canopy reflectance, photosynthesis
and transpiration. Intern. J. Remote Sens., 6(8), 1335-1372. http://doi.org/10.1080/01431168508948283 24. Son N.T., Chen C.F., Chen C.R., Chang L.Y., Duc
H.N., Nguyen L.D. 2013. Prediction of rice crop yield using MODIS EVI-LAI data in the Mekong Delta, Vietnam. Intern. J. Remote Sens., 34(20), 7275-7292. http://doi.org/10.1080/01431161.201 3.818258
25. Thomason W.E., Phillips S.B., Raymond F.D. 2007. Defining useful limits for spectral reflectance mea-sures in corn. J. Plant Nutr., 30(8), 1263-1277. http://doi.org/10.1080/01904160701555176 26. Triola M.F. 2013. Elementary statistics using Excel.
Pearson.