RESEARCH ARTICLE
N-octyl-modified magnetite NPs for optimization of solid phase
extraction for trace analysis of phenytoin in real samples
Shaghayegh Raeisi1, Mahnaz Qomi2,*, Orkideh Dadras3, Zahra Mousavi4
1 Department of Medicinal Chemistry, Faculty of Pharmaceutical Chemistry, Tehran Medical Sciences,
Islamic Azad University, Tehran, Iran
2 Active Pharmaceutical Ingredients Research Center, Tehran Medical Sciences, Islamic Azad University,
Tehran, Iran (APIRC)
3 Department of Medicinal Chemistry, Faculty of Pharmacy, Tehran Medical Sciences, Islamic Azad
University, Tehran, Iran
4 Department of Pharmacology and Toxicology, Faculty of Pharmacy, Tehran Medical Sciences, Islamic
Azad University, Tehran, Iran
*Corresponding Author Email: [email protected]
Objective: Phenytoin is an anti-seizure medication used to treat epilepsy, as well as to control arrhythmias and treat migraine headaches and nerve pain. It is recommended to determine the amount of this drug in the blood to control the seizure and prevent its toxicity. In the present study, a simplified and practical procedure based on the dispersive solid phase extraction was implemented and validated to determine Phenytoin in plasma samples. Hydrophobic n-octyl-modified magnetic iron oxide NPs (IONPs) were employed as the sorbent. Methods: The studied drug was detected using high-performance liquid chromatography with a diode array detector. The parameters affecting the extraction efficiency such as pH of the sample, amount of sorbent, time, salt, type and volume of the desorption eluent and desorption time were optimized. After the extraction procedure, magnetic nanoparticless (NPs) were easily separated from the aqueous solution by applying an external magnetic field without the need to filtration or centrifugation.
Results: The separation and preconcentration procedures were fast and completed in less than 6 min. Under the condition that was optimized, this method achieved a low limits of detection (3.0 ng mL-1), wide linear dynamic ranges (10 to 1000 ng mL-1), high enrichment factors (226), good correlation coefficients (r = 0.996), and good repeatability (6.7 to 7.3%).
Conclusion: This method was used to analyze plasma samples with good efficiency (≥ 90). Based on the results, the proposed method may be more efficient for the analysis of phenytoin in plasma samples from epileptic patients for the aim of therapeutic drug monitoring.
ARTICLE INFO
Article History:
Received 06 December 2018 Accepted 03 February 2019 Published 15 February 2019
Keywords:
Dispersive Magnetic NPs Phenytoin Plasma
Solid Microextraction
ABSTRACT
How to cite this article
Raeisi S, Qomi M, Dadras O, Mousavi Z. N-octyl-modified magnetite NPs for optimization of solid phase extraction for trace analysis of phenytoin in real samples . Nanomed Res J, 2019; 4(1): 40-47. DOI: 10.22034/nmrj.2019.01.007
This work is licensed under the Creative Commons Attribution 4.0 International License. To view a copy of this license, visit http://creativecommons.org/licenses/by/4.0/.
INTRODUCTION
Managing convulsions could be challenging most of the time since the drugs used to treat seizure are limited and the effectiveness of these drugs are highly individual based. Based on the guidelines, one of the commonly prescribed drugs for patients with seizure disorders is phenytoin [1] .
enzyme and its metabolites are inactive[2].
The half-life of phenytoin, when taken orally, is 22 hrs and 10-15 hrs when administered intravenously. It is mainly excreted by urine. Pharmacogenomics has a critical role in the prediction of the severe dermatologic reactions such as toxic epidermal necrolysis and Stevens Johnsons Syndrome when taken by patients with HLA_B*1502[2].
There have been several analytical techniques for determination of phenytoin such as spectrophotometer[3], high performance thin layer chromatography[1], F[4], HPLC-UV[5], HPLC-DAD [6]and mass spectrometer[7], supercritical LC[1], GC[8], fluorescence polarization immunoassay, [9] and spectrophotometer [10].
Since sample treatment is an essential step prior to analysis, methods for preconcentration gained so much attention. Dispersive solid phase extraction is one of the trend methods for sample treatment. Therefore, in this study, phenytoin was chosen for trace analysis using n-octyl magnetic iron oxide NPs coupled with HPLC-UV[11].
The current methods for analysis of phenytoin are not as practical and simple as the proposed methods, even though they offer desirable results. The need for a more practical and efficient method for analysis of this commonly prescribed drug necessitates more investigations on analytical techniques. There proposed work has not been implemented to our best knowledge, therefore, with the aim of individualization of treatment, this study has been conducted.
MATERIALS AND METHODS Instrumentation and equipment
In this study, HPLC-UV was used for analysis of samples (Berlin, Germany) consisting of a 1000K-low pressure pump, a 1500K solvent-based system, a Rhodyne injection system model 7725i (Cotati, USA) with a 20 μl sampler. The detection of drugs was performed using a 2600K photodiode array detector manufactured by Knauer (Berlin, Germany).
Chrome gate software was used for collecting data and analysis. The pH measurement was carried out using the eco Testr pH meter. RLABINCO 81L magnetic stirrer was used for the preparation of NPs. A EUROSONIC4D ultrasonic bath with a frequency of 50 KHz was used to diffuse the nanoparticle produced in the analyte during the adsorption process A magnet with a magnetic field strength of 1.4 Tesla was used
for magnetic separation. FT-IR device was used to ensure the correct synthesis of the prepared NPs. For microscopic imaging of the surface of the synthesized magnetic NPs, A LEO 1430VP scanning electron microscope (SEM) was used.
Materials
Phenytoin and carbamazepine standard solutions (internal standard) were obtained from the Loghman Pharmaceutical Company (Tehran, Iran). Iron (III) chloride, iron (II) chloride, hydrochloric acid, ammonia, sodium hydroxide, n-octyltriectoxylan, triethylamine, and toluene were obtained from Merck (Darmstadt, Germany). HPLC grade methanol and acetonitrile were obtained from Merck (Darmstadt, Germany). Potassium dihydrogen phosphate, sodium oxalate and sodium chloride from Applichem Company (Germany). For the preparation of all solutions, deionized water was used.
HPLC-UV method
Separation was done using a C18 column (3µm, 150×4.6 mm). Methanol and water (0.05 M Potassium Phosphate with a pH of 6.9) with a ratio of 40 to 60 was used as mobile phase. The flow rate was set at 0.85 ml/min. The UV detector was set at 210 nm. The temperature was 30°C. Phenytoin and then carbamazepine was separated respectively.
Preparation of standard solution and real samples 0.025 g standard drug was dissolved in methanol and then 25 ml deionized water was added to make a 1 mg/ml standard solution. The solution was diluted accordingly. They were stored at 4°C until analysis.
Plasma samples were collected in tubes containing EDTA and were centrifuged for a duration of 5 min at a speed of 3000 rpm after blood was taken from the patients.
Synthesis of magnetite NPs
Nanomed Res J 4(1): 40-47, Winter 2019
special nanoparticle beaker. The solution of iron (II) and (III) were being added to the container at a constant temperature of 70 ° C while nitrogen gas was blown into the container. The solution was added to the beaker while being stirred at a speed of 1000 rpm to synthesize magnetite NPs under these conditions.. Nitrogen gas flow and mixing were kept constant for 30 min. Then, by applying a strong external magnetic field, the synthesized NPs were separated from the aqueous phase and placed in the bottom of the beaker, and the solution was removed. Finally, the synthesized NPs were washed several times with distilled water until the pH was 7 [12].
Method for the Preparation of modified Magnetic NPs
To prepare n-octyl modified iron oxide NPs, 2 g dried magnetic iron oxide NPs were added to 5 g n-octyltriethoxysilane, 0.1 mL of triethylamine and 25 mL of toluene for 10 minutes and they were stirred under nitrogen gas flow. The mixture was refluxed for 24 hours with intense agitation in nitrogen. Then-octyl modified magnesium oxide NPs were collected by an external magnetic field, washed with toluene and then methanol and dried in a vacuum chamber at room temperature[13].
Extraction process using n-octyl iron NPs
For extraction, 0.20 g NPs were added into 50 ml phosphate buffer (pH=11) containing phenytoin (50 ng/ ml) and carbamazepine. The resulting mixture was placed in the ultrasonic bath at room temperature. Upon the completion of the extraction process by placing the beaker on the magnet, the adsorbent was separated from the
solution in less than 1 min. After removing the supernatant, the adsorbent was transferred to a conical glass tube (special containers for dispersive liquid-liquid extraction method) to complete the final steps of separation. Finally, the extracted drugs were washed with an appropriate amount of detergent from the surface of the adsorbent and 20 μL of the final solution was injected to HPLC-UV for analysis.
RESULTS AND DISCUSSION Spectra and morphology
SEM images
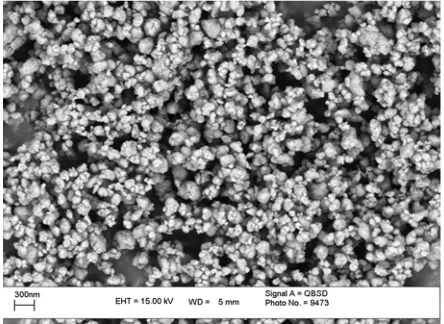
The synthesized NPs have roughly spherical shapes and a porous structure with a mean diameter of 50 nm (as in Fig. 1). Due to high surface area and energy and high magnetism, these particles tend to accumulate to form larger particles. As can be seen in this SEM image, a dense layer of octyl groups is visible on magnetite NPs.
FT-IR analysis of the nanostructures
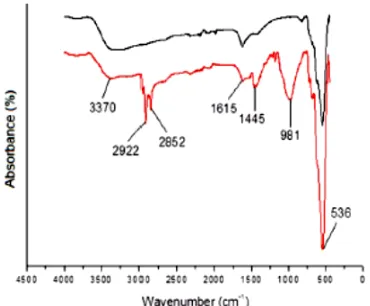
FT-IR technique was also used to confirm the structure of synthesized magnetite NPs. FT-IR spectra of magnetite NPs, as well as FT-IR spectrum of modified magnetite NPs, are shown in (Fig. 2). In the infrared spectrum of the magnetite NPs, the absorption band of 536 cm-1 is related to the Fe-O tensile vibration and the absorption band 3370 cm-1 is associated with the O-H bond vibrations [14].
During the modification of the surface of the NPs with n-octyl groups, hydroxyl groups reacted on the surface of the NPs with the n-octyl-tri-ethoxysilane group and led to the addition of n-octyl groups on the surface of magnetic iron oxide NPs. Modified NPs showed additional absorbance bands at 2922,
Figure 1. SEM images of magentic nano structures
2852, 1445 and 981 cm-1 compared to unmodified NPs. Bands with the length of 2922/2852 and 1445 cm-1, respectively, are attributed to the tensile and flexural vibrations of C-H, indicating the presence of hydrocarbon chains on NPs. The absorption band at 981 cm-1 indicates the presence of the Si-O bond, while the absorption band 1615 cm -1 indicates the vibration of water molecules in the n-octyl modified magnesium oxide NPs[15].
Optimization of magnetic solid phase extraction method for measuring phenytoin from aqueous samples using n-octyl-modified magnetite NPs Optimization of pH
pH range of 5 to 11 was chosen to investigate the effect of pH on the extraction of phenytoin. Since phenytoin is a weakly basic drug with a pKa of 8.4, therefore, the range mentioned was applied to determine the optimum pH. For phenytoin to be in molecular form and for optimum extraction, it was necessary to choose an alkaline pH for the solution. Based on the results, the maximum extraction efficiency was achieved at pH=11. Therefore it was chosen for subsequent steps of the procedure.
Effect of extraction time
The extraction efficiency is mostly dependant on the mass transfer of the analyte from the sample solution to the surface of the adsorbent. In this study, an extraction time was investigated within 3 -15 min range. At a pH of 11 and phenytoin concentration of 50 ng ml-1, the optimum time was 5 min. As the duration of the extraction process increases more than 5 min, no significant difference can be seen based on the area obtained after HPLC-UV analysis (Sup. 2).
Optimization of adsorbent
The amount of adsorbent used is one of the important factors to be optimized since it determines the capacity of adsorption of the drug, therefore the concentration of the final analyte to be injected to HPLC-Uv for analysis. In order to determine the optimum amount of adsorbent, a range of 10-40 mg magnetic Fe3O4 NPs was applied. The extraction efficiency increases as the number of adsorbents increase from 10 to 20 mg. Using NPs of more than 20 mg does not offer any desirable results. Therefore, 20 mg was chosen as the optimum amount of adsorbent for subsequent steps.
Optimization of the volume of the water phase Increased donor phase volume increases the total mass of analytes available to be extracted. Moreover, it results in increased extraction efficiency. Therefore, different volumes of 25 to 100 ml were assessed with a constant concentration of 50 ng/ml. at a range of 25 to 50 ml, an increase in volume leads to better extraction efficiency but at greater volumes than 50 ml, the extraction efficiency decreases. Therefore, the following experiments were done using 50 ml donor solution.
In order to analyze the ionic effect, 0 to 10% w/v sodium chloride was added to the donor solution. Based on the results, increased salt addition leads to a decrease in extraction efficiency. Therefore, no salt was added for real sample analysis.
Desorption
After optimization of the extraction procedure, the effect of different types of solvent was analyzed for desorption. Methanol, ethanol, acetone, and acetonitrile were used for this purpose. Based on the
Figure 2. FT-IR spectra of magnetic nano particles (Black line) and magnetic nano particles modified with n-Octyl (red line)
Nanomed Res J 4(1): 40-47, Winter 2019
results, methanol offered better results than other solvents. Moreover, the duration of desorption and volume of solvent were analyzed at ranges between 0.5 to 10 min and 50 to 500 µL, respectively. Based on the results, 100 µL solvent can be used at less than 1 min for the desorption process.
Figures of merit
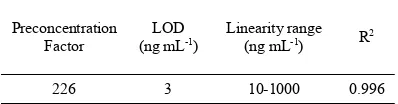
Under optimum conditions, phenytoin was preconcentrated successfully. The preconcentration factor was 226 and based on the calibration curve plotted, it offered good linearity (10-1000 ng/ml) with a correlation coefficient of 0.996 (Table 1). The limit of detection (LOD) was 3 ng/ml and the recovery of phenytoin with RSDs can be seen in (Table 2). As can be seen, the maximum recovery it offers is 94% with an inter-day and intra-day relative standard deviation (RSD) of 6.7 and 8.2 %, respectively.
Real sample analysis
3 plasma samples from 3 volunteer patients were taken. After implementation of the technique, the mean concentration of the drug in patients
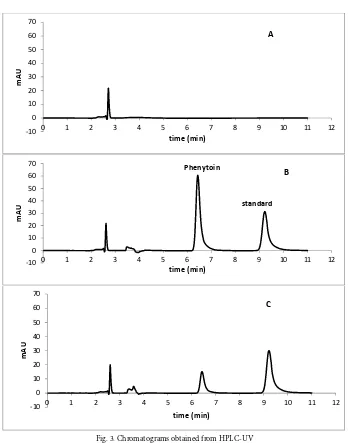
were 10.44±0.92 ng/ml (as in Table 3). The chromatograms in (Fig. 3) shows the efficiency of this method for the analysis of phenytoin in plasma samples. Comparison of outcomes of modified and unmodified magnetic NPs can be seen in (Table 4). As it is shown, the extraction efficiency is higher with modified NPs than conventional ones.
Compared to the other methods presented in (Table 5), magnetic iron oxide NPs functionalized with n-octyl is easier to set up, cost-effective and there is no need to centrifugation and other expensive instruments. The applicable nature of this method makes it a better option for trace analysis of drugs, especially phenytoin.
Solidified floating organic drop microextraction (SFO) had offered a better limit of detection compared to the other methods in the literature. The linearity range for dispersive liquid-liquid microextraction (DLLME) was approximately the same with the present method, which offers a wide range compared to the other methods. DLLME, SFO, and MNPs-dSPE have been successfully applied to plasma samples and the results show a significant difference between the other method presented in (Table 5). Therefore, these three methods may be superior to another method when LOD and linearity range is compared.
Due to acute toxicity reports[16] and a wide range of drug-drug interations[17] with phenytoin, especially in critical patients, the plasma analysis of patients is essential. This is the reason why most extraction methods are focused on determining Table 1. Figures of merit for Phenytoin analysis using modified magnetic nanoparticles coupled with HPLC-UV
R2 Linearity range
(ng mL-1) LOD
(ng mL-1) Preconcentration
Factor
0.996 1000
-10 3
226
Table 1. Figures of merit for Phenytoin analysis using modified magnetic nanoparticles coupled with HPLC-UV
Table 2. recovery and repeatablity of the experiments for trace determination of phenytoin in plasma samples
Amount of drug added (ng mL-1) Amount of drug
recovered (ng mL-1) Extraction
recovery (%) RSD%
(n=6) RSD%
(n=3)
10 9.1
91 7.3
9.3
100 93
93 7.0
8.5
500 470
94 6.7
8.2
Table 2. recovery and repeatablity of the experiments for trace determination of phenytoin in plasma samples
Table 3. Real sample analysis: the concentration of pheynitoin in plasma samples taken from patients treated with phenytoin
Mean concentration (ng mL-1) Concentration of phenytoin
(ng mL-1) Sample
10.44±0.92 9.86
Patient a
11.32 Patient b
10.14 Patient c
Table 3. Real sample analysis: the concentration of pheynitoin in plasma samples taken from patients treated with phenytoin
Table 4. the compaiosn between the modified and unmodified adsorbants.
Modified adsorbant with octyl Unmodified adsobent
Parameters
3.0 4.3
LOD(ng mL-1)
226 161
Preconcentration factor
y= 0.0217 c+1.209 y= 0.0165c+1.487
The calibration curve equation
45 Nanomed Res J 4(1): 40-47, Winter 2019 Table 5. comparison of the proposed method with other techniques in related studies
reference LOD
(ng mL-1)
Linearity range
(ng mL-1)
Sample Intrument
Extraction method
0.3 200
-1 Plasma
HPLC SFO
50 30000
-300 Plasma HPLC-DAD
MEPS
1.63 1000
-5 Urine
HPLC-UV DLLME
0.65 400
-2 Water
HPLC DLLME-SFO
80 25000
-750 Urine
HPLC-DAD SPE
800 40000
-2500 Plasma
HPLC MISPE
3 1000
-10 Plasma
HPLC-DAD MNPs-dSPE
*SFO (solidified floating organic drop microextraction) MEPS (microextraction by packed syringe) DLLME (dispersive liquid- liquid microextraction SPE (solid phase extraction)
MISPE (Molucularly imprinted solid phase extraction)
MNPs-dSPE (Magnetic nanoparticles based dispersive solid phasr extraction)
Table 5. comparison of the proposed method with other techniques in related studies
Figure 3. Chromatograms obtained from HPLC-UV
(A) Drug-free plasma sample (b) Plasma sample spiked with standard solution of 50 ng / ml phenytoin and 50 ng / ml carbamazepine as internal standard solution (c) Plasma sample donated by a volenteer patients being treated with phenytoin and 50 ng / ml standard carbamazepine. All samples were subjected to the proposed extraction procedure.
‐10 0 10 20 30 40 50 60 70
0 1 2 3 4 5 6 7 8 9 10 11 12
mAU
time (min)
A
‐10 0 10 20 30 40 50 60 70
0 1 2 3 4 5 6 7 8 9 10 11 12
m
AU
time (min)
B
standard Phenytoin
‐10 0 10 20 30 40 50 60 70
0 1 2 3 4 5 6 7 8 9 10 11 12
mAU
time (min)
C
Fig. 3. Chromatograms obtained from HPLC-UV
(A) Drug-free plasma sample (b) Plasma sample spiked with standard solution of 50 ng / ml phenytoin and 50 ng / ml carbamazepine as internal stan-dard solution (c) Plasma sample donated by a volenteer patients being treated with phenytoin and 50 ng / ml stanstan-dard carbamazepine. All samples were
Nanomed Res J 4(1): 40-47, Winter 2019
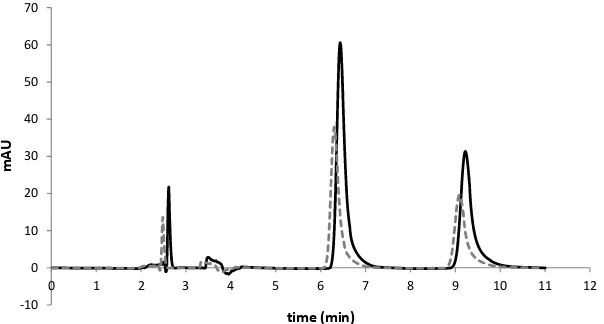
Figure 4. Chromatograms obtained from HPLC‐UV after analysis of 50ng/ ml standard solution. The dotted lines indicates the non‐modified adsotbant and the line shows the concentration of the analyte after the modification of the adsorbant using n‐Octyl
‐10 0 10 20 30 40 50 60 70
0 1 2 3 4 5 6 7 8 9 10 11 12
mAU
time (min)
Fig. 4. Chromatograms obtained from HPLC-UV after analysis of 50ng/ ml standard solution. The dotted lines indicates the non-modified adsotbant and the line shows the concentration of the analyte after the modification of the adsorbant using n-Octyl
this drug at trace levels and with great precision in plasma or urine samples for both pharmacokinetic profiling and investigational studies. Hence, the proposed method can be easily applied on a daily basis for better treatment of patients and trace analysis of wastewater for safer environment.
CONCLUSION
Phenytoin, a commonly used anticonvulsant drug, was successfully preconcentrated using modified magnetic NPs as an adsorbent. Compared to centrifugation and other techniques, this method offers more applicability and simplicity. Phenytoin trace amounts were detected in Human plasma and water using this cost-effective technique. It can be concluded that this presented research could be an effective candidate for sample treatment prior to analysis at different setting such as hospitals, investigational labs, forensics, and pharmaceutical industries. Moreover, the results of this research could be used to individualize the dose for each patient to reduce the side effects and drug interactions, which is the main concern when dealing with phenytoin.
CONFLICTS OF INTEREST
The authors declare that there are no conflicts of interest regarding the publication of this manuscript.
REFERENCES
1. Patil ST, Bhoir IC, Sundaresan M. Supercritical fluid chromatographic method using phenyl packed column for determination of phenobarbitone and phenytoin sodium in dosage form. Analytica Chimica Acta. 1999;384(2):143-50. 2. Gugler R, Manion CV, Azarnoff DL. Phenytoin:
Pharmacokinetics and bioavailability. Clinical Pharmacology & Therapeutics. 1976;19(2):135-42.
3. Al-Bayati YK, Karabat RR. Potentiometric Study of Phenytoin – PVC Membrane Electrodes for Determination of Phenytoin in pharmaceutical preparations. Journal of Al-Nahrain University-Science. 2015;18(1):79-87.
4. Hara S, Hagiwara J, Fukuzawa M, Ono N, Kuroda T. Determination of Phenytoin and Its Major Metabolites in Human Serum by High-Performance Liquid Chromatography with Fluorescence Detection. Analytical Sciences. 1999;15(4):371-5.
5. Shimoyama R, Ohkubo T, Sugawara K, Ogasawara T, Ozaki T, Kagiya A, et al. Monitoring of phenytoin in human breast milk, maternal plasma and cord blood plasma by solid-phase extraction and liquid chromatography. Journal of Pharmaceutical and Biomedical Analysis. 1998;17(4-5):863-9.
6. Santagati NA, Gotti R, Ronsisvalle G. Simultaneous determination of phenytoin and dextromethorphan in urine by solid-phase extraction and HPLC-DAD. Journal of Separation Science. 2005;28(11):1157-62.
7. Meyler M, Kelly MT, Smyth MR. New method for the determination of four antiepileptic drugs in human plasma by high performance liquid chromatography. Chromatographia. 1993;36(1):27-32.
8. Basheer C, Lee HK, Obbard JP. Determination of organochlorine pesticides in seawater using liquid-phase hollow fibre membrane microextraction and gas chromatography–mass spectrometry. Journal of Chromatography A. 2002;968(1-2):191-9.
9. Lu-Steffes M, Pittluck GW, Jolley ME, Panas HN, Olive DL, Wang CH, et al. Fluorescence polarization immunoassay IV. Determination of phenytoin and phenobarbital in human serum and plasma. Clin Chem. 1982;28(11):2278–82. 10. Rezaei Z. Simultaneous spectrophotometric determination
of carbamazepine and phenytoin in serum by PLS regression and comparison with HPLC. Talanta. 2004.
micelle enhanced spectrofluorimetry. Talanta. 2015;134:98-104.
12. Li J, Zhao X, Shi Y, Cai Y, Mou S, Jiang G. Mixed hemimicelles solid-phase extraction based on cetyltrimethylammonium bromide-coated nano-magnets Fe3O4 for the determination of chlorophenols in environmental water samples coupled with liquid chromatography/spectrophotometry detection. Journal of Chromatography A. 2008;1180(1-2):24-31. 13. Tay KS, Rahman NA, Radzi Bin Abas M. Magnetic
nanoparticle assisted dispersive liquid–liquid microextraction for the determination of 4-n-nonylphenol in water. Analytical Methods. 2013;5(12):2933.
14. Tahmasebi E, Yamini Y, Moradi M, Esrafili A. Polythiophene-coated Fe3O4 superparamagnetic nanocomposite: Synthesis and application as a new sorbent for solid-phase extraction. Analytica Chimica Acta. 2013;770:68-74. 15. Ma M, Zhang Y, Yu W, Shen H-y, Zhang H-q, Gu
N. Preparation and characterization of magnetite nanoparticles coated by amino silane. Colloids and Surfaces A: Physicochemical and Engineering Aspects. 2003;212(2-3):219-26.
16. Juhi S, Singh TS, Manjeet Singh J, Muhammed R, Manik C, Kumar TR. Ataxia, Manifestation of Phenytoin Toxicity: A Case Report. Journal of Young Pharmacists. 2018;11(1):112-3.
17. Borkar S, Agrawal M, Kale S. Phenytoin toxicity manifesting as acute psychosis: An uncommon side effect of a common drug. Asian Journal of Neurosurgery. 2019;0(0):0.
18. Asadi M, Dadfarnia S, Haji Shabani AM, abbasi
B. Simultaneous extraction and quantification of lamotrigine, phenobarbital, and phenytoin in human plasma and urine samples using solidified floating organic drop microextraction and high-performance liquid chromatography. Journal of Separation Science. 2015;38(14):2510-6.
19. Ferreira A, Rodrigues M, Oliveira P, Francisco J, Fortuna A, Rosado L, et al. Liquid chromatographic assay based on microextraction by packed sorbent for therapeutic drug monitoring of carbamazepine, lamotrigine, oxcarbazepine, phenobarbital, phenytoin and the active metabolites carbamazepine-10,11-epoxide and licarbazepine. Journal of Chromatography B. 2014;971:20-9.
20. Pourbasheer E, Sadafi S, Ganjali MR, Abbasghorbani M. Dispersive liquid–liquid microextraction for preconcentration and determination of phenytoin in real samples using response surface methodology-high performance liquid chromatography. RSC Adv. 2014;4(107):62190-6.
21. Amiri Pebdani A, Dadfarnia S, Haji Shabani AM, Khodadoust S, Talebianpoor MS. Modified dispersive liquid-phase microextraction based on sequential injection solidified floating organic drop combined with HPLC for the determination of phenobarbital and phenytoin. Journal of Separation Science. 2017;41(2):509-17.