www.atmos-meas-tech.net/8/471/2015/ doi:10.5194/amt-8-471-2015
© Author(s) 2015. CC Attribution 3.0 License.
A semi-automated system for quantifying the oxidative potential of
ambient particles in aqueous extracts using the dithiothreitol (DTT)
assay: results from the Southeastern Center for Air Pollution and
Epidemiology (SCAPE)
T. Fang1, V. Verma1, H. Guo1, L. E. King1, E. S. Edgerton2, and R. J. Weber1
1School of Earth and Atmospheric Sciences, Georgia Institute of Technology, Atlanta, GA, USA 2Atmospheric Research and Analysis, Inc., Cary, NC, USA
Correspondence to: R. J. Weber ([email protected])
Received: 17 May 2014 – Published in Atmos. Meas. Tech. Discuss.: 17 July 2014 Revised: 15 December 2014 – Accepted: 17 December 2014 – Published: 29 January 2015
Abstract. A variety of methods are used to measure the ca-pability of particulate matter (PM) to catalytically generate reactive oxygen species (ROS) in vivo, also defined as the aerosol oxidative potential. A widely used measure of aerosol oxidative potential is the dithiothreitol (DTT) assay, which monitors the depletion of DTT (a surrogate for cellular an-tioxidants) as catalyzed by the redox-active species in PM. However, a major constraint in the routine use of the DTT assay for integrating it with large-scale health studies is its labor-intensive and time-consuming protocol. To specifically address this concern, we have developed a semi-automated system for quantifying the oxidative potential of aerosol liq-uid extracts using the DTT assay. The system, capable of unattended analysis at one sample per hour, has a high an-alytical precision (coefficient of variation of 15 % for posi-tive control, 4 % for ambient samples) and reasonably low limit of detection (0.31 nmol min−1). Comparison of the au-tomated approach with the manual method conducted on am-bient samples yielded good agreement (slope=1.08±0.12, r2=0.92,N=9). The system was utilized for the South-eastern Center for Air Pollution & Epidemiology (SCAPE) to generate an extensive data set on DTT activity of am-bient particles collected from contrasting environments (ur-ban, roadside, and rural) in the southeastern US. We find that water-soluble PM2.5 DTT activity on a per-air-volume basis was spatially uniform and often well correlated with PM2.5mass (r=0.49 to 0.88), suggesting regional sources contributing to the PM oxidative potential in the southeast-ern US. The correlation may also suggest a mechanistic
ex-planation (oxidative stress) for observed PM2.5mass-health associations. The heterogeneity in the intrinsic DTT activity (per-PM-mass basis) across seasons indicates variability in the DTT activity associated with aerosols from sources that vary with season. Although developed for the DTT assay, the instrument can also be used to determine oxidative potential with other acellular assays.
1 Introduction
cell-free measures of particles oxidative potential is the DTT (dithiothreitol, HSCH2(CH(OH))2CH2SH)) assay (Charrier and Anastasio, 2012; Verma et al., 2012, 2009a; Cho et al., 2005; Kumagai et al., 2002; Delfino et al., 2013). Typ-ically, ROS in vivo are mainly produced in mitochondria and endoplasmic reticulum (ER) where molecular oxygen (O2) are reduced to superoxide anion (O−2) by accepting elec-trons from cellular reductants, such as NADPH, or during the ER protein folding process (Alfadda and Sallam, 2012). The DTT assay simulates this electron-transfer mechanism based on the catalytic ability of redox-active species to trans-fer electrons from DTT to oxygen, and thus can be con-sidered a surrogate measure of the in vivo capacity of PM to induce ROS. The rate of the reaction, commonly called DTT activity, is determined by measuring the consumption of DTT over time, which is proportional to the concentra-tion of redox-active species in PM extracts. Researchers have identified various chemical components that may participate in the reaction, including polycyclic aromatic hydrocarbons (PAHs) (Li et al., 2003), quinones (Chung et al., 2006; Ku-magai et al., 2002), transition metals (Charrier and Anasta-sio, 2012), water-soluble organic carbon (WSOC) (Verma et al., 2009a; Cho et al., 2005), and HUmic-LIke Substances (HULIS) (Verma et al., 2012; Lin and Yu, 2011). However, a consensus on the relative contributions of these species in the overall DTT activity of ambient particles is currently lacking. Studies have also reported the association between DTT activity of ambient particles and cellular biomark-ers such as fractional exhaled nitric oxide (FENO) – a marker of airway inflammation (Delfino et al., 2013); heme oxygenase (HO-1) – an enzyme responsive to oxidative stress (Li et al., 2003); and 3-(4,5-dimethylthiazol-2-yl)-2,5-diphenyltetrazolium bromide (MTT)-reduction activity (Steenhof et al., 2011). These studies suggest a plausible mechanistic link between DTT-assessed oxidative potential and adverse health effects of ambient particles. Routine DTT analysis as part of large-scale toxicological and health stud-ies involving aerosol exposure is needed to further establish the health relevance of the DTT assay (and other chemical assays in general).
One major limitation in conducting the DTT assay on a large scale is its laborious and time-intensive analytical pro-tocol, which requires precise handling practices at each step of the reaction for an accurate determination of the rate of
oped a semi-automated system using programmable syringe pumps with selector valves for conducting the DTT assay on various extracts. The system is based on a simplified proto-col in which the aerosol extract oxidizes DTT in a single vial. A small aliquot is withdrawn at various time intervals to de-termine the remaining DTT concentration and calculate the rate of DTT consumption. Particulate samples are extracted to an aqueous state and analyzed in batches using an auto-sampler at roughly 1 h per sample. The semi-automated sys-tem can run for 24 h unattended and can also be monitored remotely. Extraction liquids can be either deionized water or organic solvents; in the latter case the solvent is evaporated and reconstituted in deionized water. The system was vali-dated against the manual protocol (Cho et al., 2005) using both positive controls and ambient filter samples. Detailed comparisons of the semi-automated system and traditional manual method are shown in Table S1 in the Supplement. The DTT activity of more than 500 samples collected from the southeastern United States as part of the Southeastern Center for Air Pollution and Epidemiology (SCAPE) were analyzed for this study. Here we provide a detailed descrip-tion and characterizadescrip-tion of the automated system and an overview of aerosol oxidative potential in the southeastern United States. Sources and components of PM2.5 that pro-duce the DTT activity are presented in Verma et al. (2014).
2 Methods 2.1 Chemicals
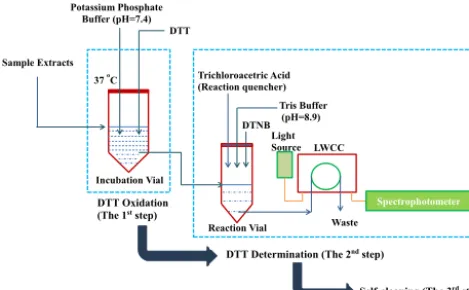
DTT Oxidation (The 1st step)
DTT Determination (The 2nd step)
Incubation Vial Potassium Phosphate Buffer (pH=7.4) DTT Trichloroacetric Acid (Reaction quencher) DTNB Sample Extracts Spectrophotometer LWCC Light Source Waste Tris Buffer (pH=8.9)
Self-cleaning (The 3rd step)
37 oC
Reaction Vial
Figure 1. Automated system protocol.
2.2 Automated DTT assay system development 2.2.1 Automated DTT assay system
Illustrated protocol and setup schematic of the semi-automated DTT assay system are shown in Figs. 1 and 2, respectively. There are three steps in the automated DTT method. In the first step (DTT oxidation step), 3.5 mL of the aerosol extract sample and 1 mL potassium phosphate buffer (0.5 mM) are loaded into an incubation vial (Figs. 1 and 2) (sterile polypropylene centrifuge tube, VWR International LLC, Suwanee, GA, USA) using a programmable syringe pump (Fig. 2, pump A) (Kloehn, Inc., Las Vegas, NV, USA). Then 0.5 mL of DTT (1 mM) is added to the incubation vial using another programmable syringe pump (Fig. 2, pump B). The DTT-buffer-sample mixture is incubated at 37◦C and
continuously shaken at a rotational frequency of 400 rpm via a ThermoMixer (incubating accuracy: ±0.5◦C; Eppendorf North America, Inc., Hauppauge, NY, USA). DTT in the mixture is consumed over time in the incubation vial due to catalytic reaction of DTT-active components of the aerosol extract.
In the second step (DTT determination step), at a spec-ified time (4 min) following the completion of step one, a small aliquot (100 µL) of the incubated mixture is withdrawn and transferred to another centrifuge tube (referred to as “reaction vial”, wrapped in aluminum foil to prevent pos-sible light interference), using pump B. This is mixed with 1 mL TCA (1 %w / v; the quenching agent), which had pre-viously been added to the reaction vial by pump A. The quenched mixture with residual DTT is further mixed with 2 mL of Tris buffer (0.08 M with 4 mM EDTA) and 0.5 mL DTNB (0.2 mM) added by pump A. Reaction between the residual DTT and DTNB forms a light-absorbing product, 2-nitro-5-thiobenzoic acid (TNB), which has a high extinc-tion coefficient of 14 150 M−1cm−1at 412 nm wavelength. Pump A then withdraws the final mixture from the reac-tion vial and pushes it through a Liquid Waveguide Capillary Cell (LWCC-M-100; World Precision Instruments, Inc., FL,
Incubation Vial (37°C) Reaction Vial DI Water Tris Buffer DTT Waste Air Air DI Water DTNB
Trichloroacetic Acid (TCA)
Potassium Phosphate Buffer
Waste Syringe Pump
Syringe Pump
Samples Extracts Multiposition Valve
Liquid Wave-guide Capillary Cell
Waste Spectrophotometer Light Source
Thermo Mixer
10ml
250µl
100mm LWCC
B A
Figure 2. Automated system setup.
USA) with an optical path length of 100 mm. The waveg-uide is coupled to an online spectrophotometer (Ocean Op-tics, Inc., Dunedin, FL, USA), which included a ultraviolet– visible (UV–Vis) light source (Ocean Optics DT-Mini-2), and a multi-wavelength light detector (USB4000 Miniature Fiber Optic Spectrometer). Absorbance intensity at 412 and 700 nm (chosen as the baseline absorbance for TNB) are recorded every 2 s using data acquisition software (Spectra-Suite). The system then performs a self-cleaning using deion-ized water (DI water,>18 Mcm−1)to eliminate any resid-ual liquid in the reaction vial, tubing, syringes, and LWCC. This second step is repeated four more times, at specific time intervals (13, 23, 30 and 41 min), generating a total of 5 data points of remaining DTT concentration with time. Follow-ing this, the automated system again performs a self-cleanFollow-ing routine (third step) to ensure no carry-over in the incubation vial, tubing, syringes, and LWCC, before analyzing the next aerosol sample. A 14-port multiposition valve (VICI®Valco Instrument Co. Inc., USA) is used to consecutively select in-dividual aerosol samples for analysis. The Kloehn control program code written for conducting the DTT assay, includ-ing hardware and software details, is included in the Supple-ment. The automated system is cleaned periodically (about every 15 days) by flushing at least three times with methanol, followed by six times with DI water.
2.2.2 DTT activity determination
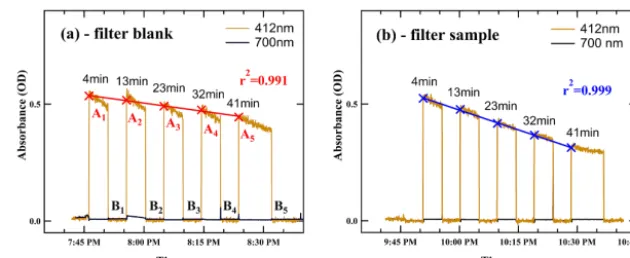
Figure 3. Example of an absorbance plot for a filter blank (a) and an ambient aerosol sample (b).
absorbance at 700 nm; B1, B2, B3, B4, B5 in Fig. 3a), thus generating a series of roughly square bars. A decreas-ing absorption intensity between successive measurements (A1>A2>A3>A4>A5) for a sample reflects the DTT ox-idation over time. During each specified DTT measurement time interval, absorbance decreases (angled top of square wave in Fig. 3); the average of the initial five absorbance data is taken as characteristic absorption for each interval. The rate of DTT consumption (σDTT, nmol min−1) was de-termined from the slope and intercept of linear regression of measured absorbance versus time as follows:
σDTT= −σAbs· N0
Abs0
, (1)
where σAbs is the slope of absorbance versus time; Abs0 is the initial absorbance calculated from the intercept of the linear regression of absorbance versus time; and N0 is the initial moles of DTT added in the reaction vial. A steeper slope corresponds to a higher rate of DTT consumption. The final DTT activity for a sample was calculated by subtract-ing a blank value from the sample and normalized by sam-ple air volume or particle overall mass (or mass of a spe-cific component) represented by the sample in the incubation vial, expressed in the units of nmol min−1m−3for volume-normalized DTT activity (DTTv), or nmol min−1µg−1 for mass-normalized DTT activity (DTTm). DTTm represents the intrinsic property of particles linked to sources, while DTTv accounts for the emission rate, dilution, etc., and char-acterizes exposure to the aerosol. Thus,
DTT activity=σDTTsample−σDTTblank
Vair orMparticle
, (2)
whereVairandMparticleare the ambient air volume (m3)and total PM mass (µg) represented by the sample in the incu-bation vial, respectively. For example, the total PM mass in the incubation vial for a sample with liquid concentration of 40 µg mL−1would be 140 µg (3.5 mL×40 µg mL−1).
2.3 Ambient sample collection and preparation 2.3.1 Sampling
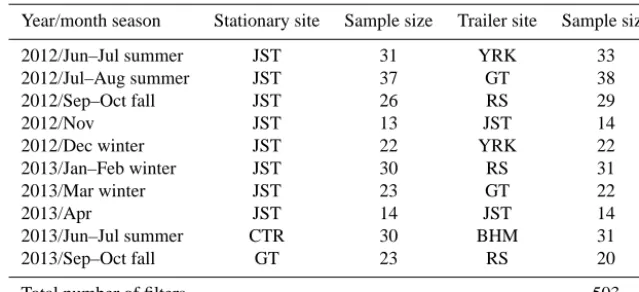
For this study, ambient PM2.5 samples were collected over 23 h on prebaked quartz filters (Pallflex® Tissuquartz™, 8×10 inches) using high-volume (Hi-Vol) samplers (Thermo Anderson, flow rate normally 1.13 m3min−1) as part of SCAPE. One sampler was fixed at a stationary site, Jefferson Street (JST), a central site representative of the At-lanta urban environment, while the other sampler (Trailer) was rotated among a roadside (RS), a near-road (Georgia Tech – GT), and a rural site (Yorkville – YRK), sampling in parallel with the fixed monitoring station (JST). Site char-acteristics are as follows:
1. RS site was situated within 5 m of the interstate high-way (I75/85) in midtown Atlanta and was chosen for capturing immediate traffic emissions;
2. GT site was located on the rooftop of the Ford Envi-ronmental Science and Technology building at Georgia Tech, Atlanta, roughly 30 m above ground level, 840 m from the RS site, providing an intermediate location be-tween RS and the central urban site (JST);
3. YRK site was situated in an agricultural region located approximately 70 km west of JST, representative of a rural environment.
Table 1. Sampling schedule and number of Hi-Vol filters collected at each site from June 2012 to September 2013.
Year/month season Stationary site Sample size Trailer site Sample size
2012/Jun–Jul summer JST 31 YRK 33
2012/Jul–Aug summer JST 37 GT 38
2012/Sep–Oct fall JST 26 RS 29
2012/Nov JST 13 JST 14
2012/Dec winter JST 22 YRK 22
2013/Jan–Feb winter JST 30 RS 31
2013/Mar winter JST 23 GT 22
2013/Apr JST 14 JST 14
2013/Jun–Jul summer CTR 30 BHM 31
2013/Sep–Oct fall GT 23 RS 20
Total number of filters 503
on the temperature profile throughout sampling period (see Supplement, Fig. S2) – summer, fall, and winter, as shown in Table 1. Collected samples were immediately wrapped in prebaked aluminum foil and stored at−18◦C until analyzed.
2.3.2 Extraction of PM filters
All filters extracted in DI water via the following method were also extracted in methanol, dried, and reconstituted in DI water for DTT analysis. Both water and methanol extracts were separated by solid-phase extraction (C-18 resin). DTT activity was analyzed with this system in order to explore the oxidative potential of chemical sub-fractions of the am-bient aerosol. Thus, not including blanks and positive con-trols, for this project on the order of 2000 extracts were analyzed for DTT activity. For the water extraction proce-dure, portions of the filters (about 1/28 of the area of the Hi-Vol filter, three 1-inch-diameter punches) were punched and extracted in 15 mL of DI water in sterile polypropylene centrifuge tubes (VWR International LLC, Suwanee, GA, USA) by sonication using an Ultrasonic Cleanser (VWR In-ternational LLC, West Chester, PA, USA) for 30 min. Ex-tracts were then filtered using PTFE 0.45 µm syringe filters (Fisherbrand™, Fisher Scientific, PA, USA) to remove insol-uble components, and divided into two fractions. One frac-tion of at least 5 mL was analyzed for DTT activity using the automated system. The other fraction was reserved for other chemical analysis including water-soluble organic car-bon and brown carcar-bon. Here we focus only on the discussion of DTT analysis of the direct water extracts.
2.4 PM2.5mass concentration
PM2.5mass concentration were measured by a Tapered El-ement Oscillating Microbalance (TEOM) at the SEARCH sites – i.e., JST, YRK, BHM, and CTR by Atmospheric Research Analysis (ARA, Inc.) – and retrieved from the data archive. For the RS and GT sites, the PM mass con-centrations were estimated from the sum of chemical
com-ponents analyzed on the Hi-Vol filters and the summa-tion method was calibrated with ARA TEOM at the JST site (slope=1.34±0.06, intercept= −2.46±0.59 µg m−3, r2=0.72,N=162; see Supplement, Fig. S3). The measured components include elemental carbon (EC; Sunset Labora-tory OCEC analyzer), organic mass (OC q1.6; Turpin and Lim, 2001), water-soluble metals (measured by X-ray flu-orescence method, XRF), and ammonium sulfate (assum-ing sulfate and ammonium are all (NH4)2SO4(Zhang et al., 2010), where sulfate was calculated from sulfur measured by XRF). Further description of the analytical procedure for each method will be reported in subsequent publications on the chemical data (Verma et al., 2014; Fang et al., 2015).
3 Results and discussion
3.1 Automated system performance
Performance of the automated system was assessed by con-ducting tests to determine instrument response, limit of de-tection (LOD), precision, and accuracy using both positive controls and ambient particles.
3.1.1 Automated system response to individual compound
Figure 4. Blank corrected DTT consumption rate as a function of
PQN (9,10-phenanthraquinone) used as a positive control. Each er-ror bar represents the standard deviation of three independent DTT measurements on each concentration.
3.1.2 Limit of detection
The limit of detection (LOD) of the system, defined as 3 times the standard deviation of DI water blanks (N=37), is 0.31 nmol min−1. Expressing the LOD in terms of the PM concentration of the sample extract (µg mL−1) is not straight-forward as it depends on many factors, including extraction efficiency and the relative fractions of DTT-active compo-nents in ambient particles. Based on the analysis of 503 Hi-Vol samples in the present study from different sites (urban, rural, and roadside), approximately 100 µg of PM2.5 mass loading on the filter, extracted in 5 mL of DI water, was suf-ficient to have reliable results above LOD. The upper limit of the PM concentration is also constrained such that the DTT consumption remains less than 50 % of the initial concentra-tion to ensure the pseudo-1st-order reacconcentra-tion of the DTT oxi-dation. For most of the PM samples collected, roughly 1/28 of the area (typical PM2.5mass loading=0.2–1 mg) of a Hi-Vol filter, extracted in 15 mL of DI water, yielded a DTT consumption rate within these limits (0.8–2.6 nmol min−1). In rare cases (<10 %) of the DTT consumption exceeding 50 %, only the initial consumption data points (at least 3) were used for the rate calculation.
3.1.3 Precision
The precision of the automated system for ambient sam-ples was assessed by separately extracting seven different equal sections (1/28 each) of the same Hi-Vol filter in 15 mL of DI water and analyzed for DTT activity. A low stan-dard deviation of 0.081 nmol min−1(coefficient of variation, CV=4 %) indicates sufficiently high precision of the system for ambient samples.
3.1.4 Accuracy
The system was validated for accuracy by comparing the DTT activity of both positive controls and ambient PM
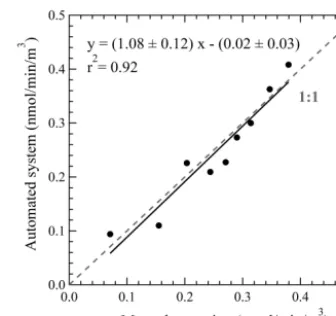
sam-Figure 5. Comparison of the automated system with manual
opera-tion using ambient aerosol extracts (PM2.5samples collected from
JST site, Atlanta, in December 2012) (regression analysis was done by orthogonal regression; the dotted line is 1 : 1).
ples obtained from the automated approach with that from the same experimental protocol performed manually (Cho et al., 2005).
Five replicates of the PQN solutions (0.21 nmol mL−1in the incubation vial) were run both on the automated system and manually. The DTT consumption rate obtained from the automated system (mean±SD of 0.77±0.03 nmol min−1, CV=4.24 %) was very close to that from the manual op-eration (0.74±0.03 nmol min−1, CV=3.97 %). As further validation, nine ambient PM samples were analyzed for DTT activity by both manual and automated approach. As shown in Fig. 5, an orthogonal fit yielded a slope (automated/manual) of 1.08±0.12, intercept close to 0 (−0.02±0.03 nmol min−1m−3), and correlation coefficient (r2) of 0.92. Further, a paired t test shows no significant difference between the results obtained by the two methods (t(8)< tcritical,p=0.05).
These tests demonstrate the robustness of the instrument as a viable alternative to the manual DTT assay, making it use-ful for rapid and high-throughput sample analysis for large-scale studies.
3.2 Field evaluation of the automated system
sys-Table 2. Performance of the automated system as assessed by consistency of DTT consumption rate for blanks and positive controls.
Sample Sample size Standard deviation, nmol/min %CV
DI blank 37 0.10 28.1
Field blank extracted in DI water 63 0.11 31.1
Positive controls (9,10-phenanthrenequinone) 55 0.19 15.0
Coefficient of variation (%CV)=SD/Avg·100
tem as evaluated by stability of the results from both positive controls and blanks. The system remained fairly consistent throughout the analysis with reasonably small variability for both positive controls (CV=15 %) and blanks (DI blanks: CV=28.1 %; field blanks: CV=26.7 %).
3.2.1 Overall method precision
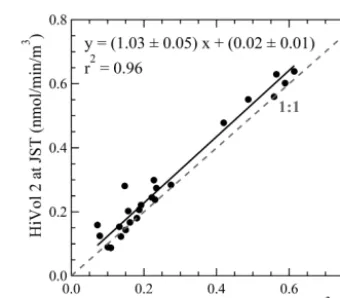
The overall precision of the paired ambient sampling method utilized in this study was further assessed by comparing the DTT activity of PM2.5 samples collected simultane-ously at JST using two Hi-Vol samplers in November 2012 and April 2013 (shown in Fig. 6). The orthogonal regres-sion yields a slope of 1.03±0.05, with an intercept of 0.02±0.01 nmol min−1m−3, andr2=0.96. Considering the combined uncertainties from sample collection, pretreat-ment, and extraction, the good agreement between the two sampling systems demonstrates a high overall precision of DTT measurement for ambient samples.
3.2.2 DTT activity of ambient samples
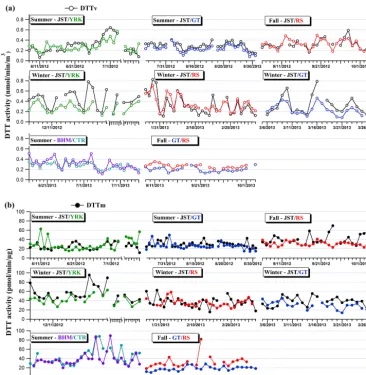
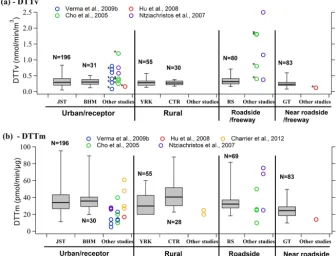
The time series of both water-soluble, volume-normalized (DTTv) and water-soluble, mass-normalized (DTTm) DTT activity are shown in Fig. 7a and b, respectively. Comparing the time series of DTTv (Fig. 7a) between paired sites shows that there is generally little divergence between sites, with the exception of the JST–YRK (urban–rural) pair in winter. Some of this uniformity is due to the 23 h integrated sam-pling time of the Hi-Vol filters, which dampens any diurnal variability in the emission sources contributing to PM ox-idative potential. Figure 8 shows the distribution of water-soluble DTTv and DTTm data of ambient PM2.5 obtained in our study in comparison with those from other studies (Charrier and Anastasio, 2012; Verma et al., 2009b; Hu et al., 2008; Ntziachristos et al., 2007; Cho et al., 2005). Our DTTv data (Fig. 8a) are in the range reported in other studies, with the exception of RS (measurements made adjacent to a high-traffic highway), which is lower in the present study. However, comparing the DTTm levels, RS DTTm are well within the typical range of other studies, and thus our lower DTTv levels are most probably attributed to higher PM2.5 concentrations reported in other studies sampling by road-ways. Our study generally shows a broader span for urban and rural sites than reported previously, which is likely due to the much larger data set collected over a yearlong period
Figure 6. Overall method precision of the automated system
as-sessed by PM2.5filter samples (N=24) collected simultaneously
using two Hi-Vol samplers deployed side-by-side at JST during November 2012 and April 2013 (regression analysis was done by orthogonal regression; the dotted line is 1 : 1).
that captured a wider range of sources and ambient condi-tions.
3.2.3 Seasonal and spatial variability
The spatiotemporal variability of DTTv can be used to as-sess the exposure to total water-soluble DTT-active species in different seasons and sites. Since DTTm is represented by DTTv divided by PM2.5mass concentration, which is the in-trinsic property of aerosol independent of exposure levels, the spatiotemporal variability of DTTm provides informa-tion on the variainforma-tion of DTT-active chemical components. Seasonal and spatial variability of aerosol oxidative potential (both DTTv and DTTm) in the southeastern US was assessed by analysis of variance (ANOVA) tests and coefficient of di-vergence (COD), respectively. The ANOVA tests were used to assess differences between seasons at a given site (Supple-ment, Tables S2 and S3), and the COD (Wilson et al., 2005) was calculated to assess spatial variability (see Table 3). The COD is calculated as follows:
COD=
v u u t 1 N
N X
i=1 c
ij−cik cij+cik
2
, (3)
where cij and cik are the 23 h averaged DTT activity
Figure 7. Water-soluble DTT activity of the ambient particles collected at paired sampling sites. The plots show (a) volume-normalized
(DTTv) and (b) mass-normalized (DTTm) DTT activity at JST (urban, black) paired with YRK (rural, green), RS (roadside, red), and GT (near road, blue). Also included is the CTR (rural, cyan)–BHM (urban, purple) pair, and the GT–RS pair.
Table 3. Spatial heterogeneity of DTTv and DTTm assessed by
co-efficient of divergence (COD).
Season Paired sites CODv (DTTv) CODm (DTTm)
Summer JST–YRK 0.21 0.23 Summer JST–GT 0.15 0.15 Fall JST–RS 0.13 0.23 Winter JST–YRK 0.25 0.15 Winter JST–RS 0.17 0.18 Winter JST–GT 0.23 0.22 Summer 2013 BHM–CTR 0.12 0.15 Fall 2013 GT–RS 0.18 0.31
N is the sample size. COD ranges from 0 to 1, with values close to 0 representing a homogenous distribution and those near 1 indicating heterogeneity.
Based on ANOVA tests, there was high heterogeneity across seasons for DTTv at JST (p=0.01; see Supplement, Table S2), with the highest DTTv in winter (December (win-ter)/June (summer)=1.51), while there was no significant seasonal variation observed at YRK, GT, or the RS site (p >0.01). In comparison to DTTv, there are greater sea-sonal variations in DTTm; for example, average DTTm at most sites showed much higher levels in winter than sum-mer and fall (winter/sumsum-mer=1.4, 1.2, and 2.2 for YRK, GT, and JST, respectively). ANOVA tests also validated the pronounced seasonal differences for DTTv and DTTm at JST and DTTm at other sites (p <0.01; see Supplement, Ta-bles S2 and S3). The higher seasonal differences in DTTm may suggest that the specific chemical components that con-tribute to the oxidative potential of particles vary between seasons and originate from different sources.
Figure 8. Distribution of water-soluble volume-normalized (a) and mass-normalized (b) DTT activity (oxidative potential) of ambient PM2.5
in our study compared with other studies. Data from this study are expressed as median, maximal, minimal, and percentile 25 and 75. Roadside/freeway – sampling sites are located adjacent to road/highway; near roadside/freeway – sampling sites are further away but less
than 1 km from road/freeway.∗– numbers not presented in the paper, thus estimated from graphs.
homogeneity of water-soluble aerosol oxidative potential in the region, suggesting dominant DTT activity sources are re-gional in nature, such as SOA (secondary organic aerosol) or a well-mixed atmosphere of emissions from distant sources (e.g., long-range transport). Note that JST–RS and GT–RS pairs, in both fall seasons, show slightly lower CODs (more uniformity) in DTTv than in DTTm (COD for DTTv=0.13 and 0.18 compared to COD for DTTm=0.23 and 0.31 for JST–RS and GT–RS, respectively). This indicates that, al-though there may be unique local sources at the RS site, for example primary vehicle emissions and re-suspended dust, their overall contribution was not substantial compared to the regional DTT signal and so was not clearly resolved.
3.2.4 Oxidative potential and PM2.5mass
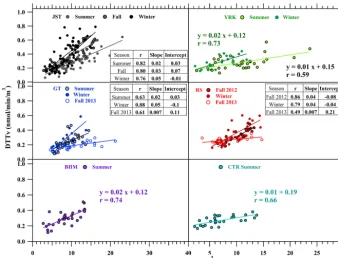
Figure 9 shows the correlation between DTT activity (DTTv) and PM2.5 mass concentrations for all the sites and sea-sons. DTTv correlates with PM concentration in various de-grees (Pearson’s r=0.49–0.88), but generally the correla-tions are high for most sites. For JST, the representative ur-ban site, Pearson’sr is particularly high (r=0.76–0.82) in all seasons. Lowest DTTv–PM2.5mass correlations were at the roadside site, probably due to the influence of unique RS sources that contributed to mass but not significantly to DTT activity (average PM2.5 concentrations are 8.7 and
8.2 µg m−3 at JST compared to 10.4 and 9.5 µg m−3 at RS in fall and winter, respectively). It is important to note that, despite the significant correlation, the slope for DTT activity versus PM2.5mass varies among different sites and seasons. Overall, we attribute the variation in degree of association between DTT activity and PM2.5 mass to the varying PM chemical composition.
Figure 9. Correlation (Pearson’sr) between water-soluble DTT activity (DTTv) and PM2.5mass concentration at JST (urban), YRK (rural),
RS (roadside), GT (near-road), CTR (rural), and BHM (urban) sites.
4 Conclusions
An automated analytical system for quantifying the oxida-tive potential of aerosol liquid extracts using the DTT assay was developed. The system follows the analytical approach developed by Cho et al. (2005) and is capable of one DTT activity measurement per hour. The system response was as-sessed by PQN, which was used as a positive control when running a series of ambient samples. The method LOD was 0.31 nmol min−1. Analytical precision based on both PQN (CV=15 %) and ambient samples (CV=4 %) was high. The instrument was further validated for accuracy by compar-ing with the manual procedure uscompar-ing ambient PM samples (r2=0.92, slope=1.08±0.12). The suitability of the sys-tem for large-scale application was assessed by analyzing more than 500 filters collected in the southeastern US as part of SCAPE, the joint Emory–Georgia Tech Clean Air Research Center. The data show that water-soluble PM2.5 DTT activity on a per-volume-of-air basis was spatially uni-form and generally correlated with PM2.5mass (r=0.49 to 0.88), indicating DTT activity in the southeast is likely, to a significant extent, related to regional sources and not dom-inated by a single source or a limited number of species. However, the higher seasonal heterogeneity in the intrinsic water-soluble DTT activity (per-PM-mass basis) may indi-cate that the dominant regional sources change with sea-son. More in-depth analysis of the extensive data set gen-erated with the instrument will be forthcoming. It is noted
The Supplement related to this article is available online at doi:10.5194/amt-8-471-2015-supplement.
Acknowledgements. We wish to thank the Southeastern Aerosol Research and Characterization (SEARCH) personnel for their many contributions supporting the field deployments. We also thank R. Erik Weber, Janessa Riana Rowland, and Madhusudan Kamat for assistance in lab work. This research was made possible by US EPA grant R834799. T. Fang acknowledges the support from the Oversea Study Program of Guangzhou Elite Project.
Disclaimer. The contents are solely the responsibility of the grantee and do not necessarily represent the official views of the US EPA. Further, US EPA does not endorse the purchase of any commercial products or services mentioned in the work.
Edited by: P. Herckes
References
Alfadda, A. A. and Sallam, R. M.: Reactive oxygen species in health and disease, J. Biomed. Biotechnol., 2012, 936486, doi:10.1155/2012/936486, 2012.
Antonini, J. M., Clarke, R. W., Krishna Murthy, G. G., Sreekanthan, P., Jenkins, N., Eagar, T. W., and Brain, J. D.: Freshly generated stainless steel welding fume induces greater lung inflammation in rats as compared to aged fume, Toxicol. Lett., 98, 77–86, 1998. Aust, A. E., Ball, J. C., Hu, A. A., Lighty, J. S., Smith, K. R.,
Strac-cia, A. M., Veranth, J. M., and Young, W. C.: Particle character-istics responsible for effects on human lung epithelial cells, Res. Rep. Health Eff. Inst., 110, 1–65, 2002.
Bonvallot, V., Baeza-Squiban, A., Baulig, A., Brulant, S., Boland, S., Muzeau, F., Barouki, R., and Marano, F.: Organic compounds from diesel exhaust particles elicit a proinflammatory response in human airway epithelial cells and induce cytochrome p450 1A1 expression, Am. J. Resp. Cell Mol., 25, 515–521, 2001. Charrier, J. G. and Anastasio, C.: On dithiothreitol (DTT) as a
mea-sure of oxidative potential for ambient particles: evidence for the importance of soluble transition metals, Atmos. Chem. Phys., 12, 9321–9333, doi:10.5194/acp-12-9321-2012, 2012.
Cho, A. K., Sioutas, C., Miguel, A. H., Kumagai, Y., Schmitz, D. A., Singh, M., Eiguren-Fernandez, A., and Froines, J. R.: Redox activity of airborne particulate matter at different sites in the Los Angeles Basin, Environ. Res., 99, 40–47, 2005.
Chung, M. Y., Lazaro, R. A., Lim, D., Jackson, J., Lyon, J., Ren-dulic, D., and Hasson, A. S.: Aerosol-borne quinones and reac-tive oxygen species generation by particulate matter extracts, En-viron. Sci. Technol., 40, 4880–4886, 2006.
Delfino, R. J., Staimer, N., Tjoa, T., Gillen, D. L., Schauer, J. J., and Shafer, M. M.: Airway inflammation and oxidative potential of air pollutant particles in a pediatric asthma panel, J. Expos. Sci. Environ. Epidemiol., 23, 466–473, 2013.
Fang, T., Verma, V., Peltier, R. E., Guo, H. Y., King, L. E., Edger-ton, E. S., and Weber, R. J.: Distribution of ambient atmospheric water-soluble metals in the southeastern United States and in-sights into their complexation states, in preparation, 2015.
Frampton, M. W., Ghio, A. J., Samet, J. M., Carson, J. L., Carter, J.
D., and Devlin, R. B.: Effects of aqueous extracts of PM10filters
from the Utah Valley on human airway epithelial cells, Am. J. Phys.-Lung C., 277, L960–L967, 1999.
Gholampour, A., Nabizadeh, R., Naseri, S., Yunesian, M., Taghipour, H., Rastkari, N., Nazmara, S., Faridi, S., and Mahvi, A. H.: Exposure and health impacts of outdoor particulate mat-ter in two urban and industrialized area of Tabriz, Iran, Jour-nal of Environmental Health Science and Engineering, 12, 27, doi:10.1186/2052-336X-12-27, 2014.
Gurgueira, S. A., Lawrence, J., Coull, B., Murthy, G. G., and Gonzalez-Flecha, B.: Rapid increases in the steady-state concen-tration of reactive oxygen species in the lungs and heart after particulate air pollution inhalation, Environ. Health Persp., 110, 749–755, 2002.
Hansen, D. A., Edgerton, E. S., Hartsell, B. E., Jansen, J. J., Kan-dasamy, N., Hidy, G. M., and Blanchard, C. L.: The Southeastern Aerosol Research and Characterization Study: Part 1-Overview, J. Air Waste Ma., 53, 1460–1471, 2003.
Harkema, J. R., Keeler, G., Wagner, J., Morishita, M., Timm, E., Hotchkiss, J., Marsik, F., Dvonch, T., Kaminski, N., and Barr, E.: Effects of concentrated ambient particles on normal and hyper-secretory airways in rats, Res. Rep. Health Eff. Inst., 120, 1–68, 2004.
Hiura, T. S., Kaszubowski, M. P., Li, N., and Nel, A. E.: Chemicals in diesel exhaust particles generate reactive oxygen radicals and induce apoptosis in macrophages, J. Immunol., 163, 5582–5591, 1999.
Hu, S., Polidori, A., Arhami, M., Shafer, M. M., Schauer, J. J., Cho, A., and Sioutas, C.: Redox activity and chemical spe-ciation of size fractioned PM in the communities of the Los Angeles-Long Beach harbor, Atmos. Chem. Phys., 8, 6439– 6451, doi:10.5194/acp-8-6439-2008, 2008.
Jung, H., Guo, B., Anastasio, C., and Kennedy, I. M.: Quantitative measurements of the generation of hydroxyl radicals by soot par-ticles in a surrogate lung fluid, Atmos. Environ., 40, 1043–1052, 2006.
Koehler, K. A., Shapiro, J., Sameenoi, Y., Henry, C., and Volck-ens, J.: Laboratory evaluation of a microfluidic electrochemical sensor for aerosol oxidative load, Aerosol Sci. Technol., 48, 489– 497, 2014.
Kubátová, A., Dronen, L. C., Picklo, M. J., and Hawthorne, S. B.: Midpolarity and nonpolar wood smoke particulate matter frac-tions deplete glutathione in RAW 264.7 macrophages, Chem. Res. Toxicol., 19, 255–261, 2006.
Kumagai, Y., Koide, S., Taguchi, K., Endo, A., Nakai, Y., Yoshikawa, T., and Shimojo, N.: Oxidation of proximal protein sulfhydryls by phenanthraquinone, a component of diesel ex-haust particles, Chem. Res. Toxicol., 15, 483–489, 2002. Li, N., Sioutas, C., Cho, A. K., Schmitz, D., Misra, C., Sempf, J.,
Wang, M., Oberley, T., Froines, J., and Nel, A.: Ultrafine particu-late pollutants induce oxidative stress and mitochondrial damage, Environ. Health Persp., 111, 455–460, 2003.
Li, Q. F., Wyatt, A., and Kamens, R. M.: Oxidant generation and toxicity enhancement of aged-diesel exhaust, Atmos. Environ., 43, 1037–1042, 2009.
and asthma emergency department visits for children in Seattle, Environ. Health Persp., 107, 489–493, 1999.
Ntziachristos, L., Froines, J. R., Cho, A. K., and Sioutas, C.: Rela-tionship between redox activity and chemical speciation of size-fractionated particulate matter, Particle and Fibre Toxicology, 4, 5, doi:10.1186/1743-8977-4-5, 2007.
Peter, M. and Steffen, L.: Oxidative damage to DNA and Lipids as biomarkers of exposure to air pollution, Environ. Health Persp., 118, 1126–1136, 2010.
Pope, C. A., Burnett, R. T., Thurston, G. D., Thun, M. J., Calle, E. E., Krewski, D., and Godleski, J. J.: Cardiovascular mortality and long-term exposure to particulate air pollution: epidemiolog-ical evidence of general pathophysiologepidemiolog-ical pathways of disease, Circulation, 109, 71–77, 2004.
Sameenoi, Y., Koehler, K., Shapiro, J., Boonsong, K., Sun, Y., Col-lett, J., Volckens, J., and Henry, C. S.: Microfluidic electrochem-ical sensor for on-line monitoring of aerosol oxidative activity, J. Am. Chem. Soc., 134, 10562–10568, 2012a.
Sameenoi, Y., Panymeesamer, P., Supalakorn, N., Koehler, K., Chailapakul, O., Henry, C. S., and Volckens, J.: Microfluidic paper-based analytical device for aerosol oxidative activity, Env-iron. Sci. Technol., 47, 932–940, 2012b.
Samet, J. M., Dominici, F., Curriero, F. C., Coursac, I., and Zeger, S. L.: Fine particulate air pollution and mortality in 20 U.S. cities, 1987–1994, New Engl. J. Med., 343, 1742–1749, 2000. Schaumann, F., Borm, P. J. A., Herbrich, A., Knoch, J., Pitz,
M., Schins, R. P. F., Luettig, B., Hohlfeld, J. M., Heinrich, J., and Krug, N.: Metal-rich ambientparticles (particulate matter2.5) cause airway inflammation in healthy subjects, Am. J. Resp. Crit. Care, 170, 898–903, 2004.
Steenhof, M., Gosens, I., Strak, M., Godri, K. J., Hoek, G., Cassee, F. R., Mudway, I. S., Kelly, F. J., Harrison, R. M., Lebret, E., Brunekreef, B., Janssen, N. A. H., and Pieters, R. H. H.: In vitro toxicity of particulate matter (PM) collected at different sites in the Netherlands is associated with PM composition, size fraction and oxidative potential–the RAPTES project, Particle and Fibre Toxicology, 8, 26, doi:10.1186/1743-8977-8-26, 2011.
Sun, Q. H., Hong, X. R., and Wold, L. E.: Cardiovascular effects of ambient particulate air pollution exposure, Circulation, 121, 2755–2765, 2010.
Tong, H., Rappold, A. G., Diaz-Sanchez, D., Steck, S. E., Berntsen, J., Cascio, W. E., Devlin, R. B., and Samet, J. M.: Omega-3 fatty acid supplementation appears to attenuate particulate air pollution-induced cardiac effects and lipid changes in healthy middle-aged adults, Environ. Health Persp., 120, 952–957, 2012.
of particulate matter in Los Angeles during the October 2007 southern California wildfires, Environ. Sci. Technol., 43, 954– 960, 2009b.
Verma, V., Rico-Martinez, R., Kotra, N., King, L. E., Liu, J., Snell, T. W., and Weber, R. J.: Contribution of water-soluble and insol-uble components and their hydrophobic/hydrophilic subfractions to the reactive oxygen species-generating ootential of fine ambi-ent aerosols, Environ. Sci. Technol., 46, 11384–11392, 2012. Verma, V., Fang, T., Guo, H., King, L., Bates, J. T., Peltier, R. E.,
Edgerton, E., Russell, A. G., and Weber, R. J.: Reactive oxygen
species associated with water-soluble PM2.5 in the
southeast-ern United States: spatiotemporal trends and source apportion-ment, Atmos. Chem. Phys., 14, 12915–12930, doi:10.5194/acp-14-12915-2014, 2014.
Wilson, J. G., Kingham, S., Pearce, J., and Sturman, A. P.: A review of intraurban variations in particulate air pollution: Implications for epidemiological research, Atmos. Environ., 39, 6444–6462, 2005.
Xia, T., Kovochich, M., Brant, J., Hotze, M., Sempf, J., Oberley, T., Sioutas, C., Yeh, J. I., Wiesner, M. R., and Nel, A. E.: Com-parison of the abilities of ambient and manufactured nanoparti-cles to induce cellular toxicity according to an oxidative stress paradigm, Nano Lett., 6, 1794–1807, 2006.
Zanobetti, A., Coull, B. A., Gryparis, A., Kloog, I., Sparrow, D., Vokonas, P. S., Wright, R. O., Gold, D. R., and Schwartz, J.: Associations between arrhythmia episodes and temporally and spatially resolved black carbon and particulate matter in elderly patients, Occup. Environ. Med., 71, 201–207, 2014.
Zhang, X., Hecobian, A., Zheng, M., Frank, N. H., and Weber, R.
J.: Biomass burning impact on PM2.5over the southeastern US
during 2007: integrating chemically speciated FRM filter mea-surements, MODIS fire counts and PMF analysis, Atmos. Chem. Phys., 10, 6839–6853, doi:10.5194/acp-10-6839-2010, 2010. Zomer, B., Collé, L., Jedy´nska, A., Pasterkamp, G., Kooter, I., and