https://doi.org/10.5194/amt-10-2313-2017 © Author(s) 2017. This work is distributed under the Creative Commons Attribution 3.0 License.
Development and validation of a CCD-laser aerosol detective system
for measuring the ambient aerosol phase function
Yuxuan Bian1,2, Chunsheng Zhao2, Wanyun Xu3, Gang Zhao2, Jiangchuan Tao2, and Ye Kuang2
1State Key Laboratory of Severe Weather, Chinese Academy of Meteorological Sciences, Beijing, 100081, China 2Department of Atmospheric and Oceanic Sciences, School of Physics, Peking University, Beijing, 100871, China 3State Key Laboratory of Severe Weather & Key Laboratory of Atmospheric Chemistry of CMA, Chinese Academy of Meteorological Sciences, Beijing, 100081, China
Correspondence to:Chunsheng Zhao ([email protected])
Received: 28 November 2016 – Discussion started: 6 February 2017 Revised: 2 May 2017 – Accepted: 29 May 2017 – Published: 27 June 2017
Abstract. Aerosol phase function represents the angular scattering property of aerosols, which is crucial for un-derstanding the climate effects of aerosols that have been identified as one of the largest uncertainties in the evalu-ation of radiative forcing. So far, there is a lack of instru-ments with which to measure the aerosol phase function di-rectly and accurately in laboratory studies and in situ mea-surements. A portable instrument with high angular range and resolution has been developed for the measurement of the phase function of ambient aerosols in this study. The charge-coupled device-laser aerosol detective system (CCD-LADS) measures the aerosol phase function both across a relatively wide angular range of 10–170◦and at a high res-olution of 0.1◦. The system includes a continuous laser, two charge-coupled device cameras and the corresponding fish-eye lenses. The CCD-LADS was validated by both a labo-ratory study and a field measurement. The comparison be-tween the aerosol phase function retrieved from CCD-LADS and Mie-scattering model shows good agreement. Compared with the TSI polar nephelometer, CCD-LADS has the advan-tages of wider detection range and better stability.
1 Introduction
The climate effect of aerosol optical properties is one of the greatest uncertainties in our understanding of climate change (Pachauri et al., 2014). Instruments such as the integrating nephelometer have often been used to measure the aerosol scattering coefficient in laboratory studies and field
cam-paigns (Anderson et al., 1996; Heintzenberg and Charlson, 1996; Ma et al., 2011; Müller et al., 2011; Tao et al., 2014). However, besides the total scattering coefficient, the distri-bution of aerosol scattering at different directions also has a significant impact on the direct climate effect of aerosols (Kuang et al., 2015, 2016b). The aerosol phase function (p (θ ))is defined to describe the angular distribution of the aerosol scattering intensity (van de Hulst, 1957).p (θ )is one of the important properties determining the contribution of aerosols to the radiative balance of the atmosphere (Andrews et al., 2006). Some parameters such as the asymmetry pa-rameter and the hemispheric backscatter fraction estimated fromp (θ )are of great importance to the retrieval of remote sensing measurements and in the simulation of atmospheric radiative transfer models (Muñoz et al., 2002). If the particle is assumed to be spherical, there is a comprehensive theory named the “Mie scattering theory” which describes the char-acteristics of aerosol scattering when the particle size is at the same scale as the wavelength of scattering light (Bohren and Huffman, 2008).p (θ )can also be calculated with the size and complex refractive index of particles by Mie scattering theory (Kim et al., 2010).
Castag-ner and Bigio (2006, 2007) focused the light scattered at a single spot with different scattering angles to another single spot by using two parabolic reflectors next to the light path. A plane mirror was placed at that point to reflect the scatter-ing signals with different angles to a PMT by rotation. These two styles of instruments measured the angular distribution of scattering signals by using the rotational mechanism. This design will lead to an obvious uncertainty because the sig-nals were not measured simultaneously. Barkey et al. (2002, 2007) made the sample flow perpendicular and intersected it with the light path. Then many PMTs were mounted around the point of intersection in the same plane with the laser beam to capture the scattering signal from different scattering an-gles. The signals with different scattering angles were mea-sured at the same time with this design. However, the angular resolution which is limited to larger than 8◦per point is rela-tively low because the PMTs cannot be mounted too close to each other. Curtis et al. (2007, 2008) used an elliptical mir-ror to reflect the scattering light to a charge-coupled device (CCD) detector for the detection of aerosol phase function. By using CCD as detector, this method can offer a better an-gle and time resolution at a wider range of scattering anan-gles than the other methods above. It just needs one detector and there is no need to move the detector during the measure-ment. However, the structure of this design is too compli-cated to be used in field measurements.
Recently, McCrowey et al. (2013) developed a minia-turised polar nephelometer, which can be used in the in situ measurement based on the techniques of Curtis et al. (2007) and can then be calibrated in the laboratory using polystyrene latex (PSL) standard particles. A comparison between the re-sults measured from this instrument and calculated from a Mie model showed a good agreement. The detection range of this instrument is from 20 to 155◦scattering angle. Besides these studies, the Aurora 4000 polar nephelometer (Ecotech Pty Ltd., Australia) is currently the only commercial instru-ment that can measure the aerosol phase function. This prod-uct has a strprod-ucture similar to that of the integrating neph-elometer, while a backscatter shutter that is able to be posi-tioned at any angle between 10 and 90◦is mounted in the cavity to help the nephelometer measuring the light scatter-ing from that angle through to 170◦. The Aurora 4000 can only measure the aerosol phase function in a scattering an-gle range of 0–90◦for dry aerosols. These two instruments can be used to measure the scattering phase function of dry aerosols in in situ measurements.
In this paper, a novel instrument named “charge-coupled device-laser aerosol detective system” (CCD-LADS) based on the CCD imaging principle and the optical structure of the fisheye lens is developed to measure the ambient aerosol phase function in the field measurement at a wider range of detection angles and a higher accuracy. The validation in both laboratory and field measurement shows the ability of the CCD-LADS to measure the aerosol phase function.
2 Instrumentation and methodology 2.1 Design of the instrument
The CCD-LADS includes several main components: a high-power continuous laser emitter, two CCD cameras, optical filters and fisheye lenses. The laser and CCD cameras are mounted on tripods and controlled by a laptop. Each compo-nent is portable and on a scale of a few cubic decimetres.
The emitting system of the CCD-LADS is mainly built with a solid continuous laser emitter. Nd : YAG is used as the solid laser material as the wavelength of the emitter is 532 nm. The transverse mode is near TEM00. The M2 fac-tor is less than 2.0 while the divergence of the beam is less than 2.0 mrad. The diameter at the aperture is 3.0 mm. The power of the laser is 1 W. To change the polarisation state of the laser from linear to circular, a quarter-wave plate was mounted in front of the laser emitter. During the exposure time (a few minutes) of the image, the circular-polarisation light can be assumed to be unpolarised.
The receiving system of CCD-LADS has three main parts, the CCD cameras, the optical filters and the fisheye lenses. The SBIG model STF-8300 CCD imaging camera, which has the KAF-8300 CCD sensor (ON Semiconductor, Phoenix, AZ, USA) is used. The area array (17.96×13.52 mm) of pix-els has 8.3 million (3326×2504) effective pixels, while each pixel is a square 5.4 µm on a side. The exposure time is from 0.1 s to 1 h. The A/D converter is 16 bit. Due to its outstand-ing performance, this product is often used in astronomical measurements and also measurements in the other research areas (Coenen et al., 2015). The quantum efficiency of the CCD is about 55 % at 532 nm, while the linearity error is about 10 %. This camera has an air-cooling unit to control the temperature of CCD.
The fisheye lens (Sigma Corp., Japan) has a 10 mm fo-cus length and a F2.8 aperture. When this lens is used with a Nikon camera, the field of view can be 180◦. Because of the size of the CCD arrays, when this lens is used with the STF-8300 camera, the field of view is about 120◦. The eq-uisolid projection, which means that the solid angle of the object is directly proportional to the area on the CCD ar-rays, is used by this lens (Miyamoto, 1964). The modula-tion transfer funcmodula-tion of the lens shows that, according to the size of the CCD sensor, the difference of the sensitiv-ities from the centre to the corner is less than 5 % (http: //www.sigma-photo.co.jp/english/lens/wide/10_28/#/data).
To filter out the background noise from the sky radiation, an optical filter (Thorlabs, Newton, NJ, USA) is mounted between the CCD camera and the lens. The filter has a 532±2 nm wavelength, and a 10±2 nm full width at half maximum, while the minimum transmission at the peak is 70 %.
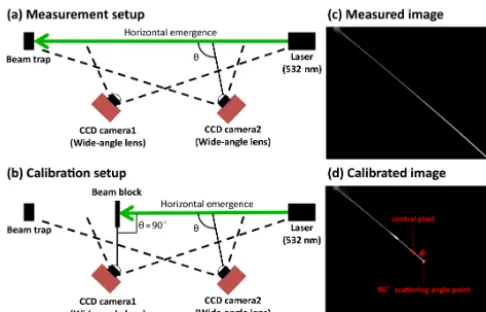
Figure 1.Sketch map of the geometric relationship and the sam-pling image of CCD-LADS.
side. Besides the laser beam, two CCD cameras with fish-eye lenses are installed at the same altitude with the laser to capture the scattering signal from the laser beam, while the directions of the cameras are forward and backward. With the mounted lens, there is a one-to-one correspondence between the image of the laser beam captured by CCDs and the laser beam object according to the principle of image formation by lenses. When two CCD cameras are used in this system, the detective angle can be expanded to 10–170◦. The angle
reso-lution can reach 0.1◦per pixel. The scattering signal from 0 to 10 and 170 to 180◦cannot be detected, because the signal to noise ratio is significantly lower than the value needed to estimate the quantities effectively.
To decrease the total area of the instrument, the distance between the CCD cameras and the laser beam should be less than 1 m. Therefore the CCD-LADS system covers an area 12 m long and 1 m wide. When the instrument is set up, the first step is to measure the relative position of the CCD cam-eras, the laser beam and the laser emitter. From the geometric relationship shown in Fig. 1, we can know that the light scat-tered at different position on the laser beam will be collected by different pixels on the CCD, so that the scattering light at different angles can be retrieved from the image captured by CCD. Due to the open path structure of the CCD-LADS, the background noise is much higher in the daytime than at night-time. Currently, the CCD-LADS system can only esti-mate the nocturnal aerosol scattering phase function. 2.2 Methodology
2.2.1 Data acquisition and preprocessing
The data acquisition of CCD-LADS involves obtaining the angle-resolved scattering signals from images captured by two independent CCD systems and then merging the sig-nals. Firstly, the CCD-LADS is set up as shown in Fig. 1a. The geometric relationships between the CCDs, laser emit-ter and light trap are measured by tape. Then the scatemit-tering
angle of laser in the image should be calibrated. The direc-tion of the CCD cameras are adjusted to make sure that the image from the laser goes through the centre of the pixel arrays of CCD. By using a beam block, the backscattering light is blocked from going into the CCD and the pixel re-lated to the 90◦scattering angle can be referred from the cal-ibrated image (Fig. 1d). Because of the equisolid projection is used by the lens, the distance from a point on the image on the CCD to the centre of the pixels can be calculated as R=2f×sin(θ/2), whereθ is the angle in rad between a point in the real world and the optical axis, which goes from the centre of the image through the centre of the lens,f is the focal length of the lens (Miyamoto, 1964). Therefore, the scattering angle, which is related to the centre of the image, can be calculated by introducing the distance between the centre of the pixels and the pixel related to the 90◦scattering angle in the calibrated image into the equation of the equi-solid projection. In this way, each pixel on the image of laser will be associated with a scattering angle.
At the beginning of the measurement, the CCDs are cooled down to −15◦C to minimise the noise from dark current. Then a test image with a 10 s exposure time is captured to fix the exposure time of the measurement by evaluating the signal intensity of this image. Generally, the maximum of the signal intensity is tuned to about 214because the limita-tion is 216. If the maximum increased to the limitation in an image, the exposure time will also be changed in the next im-age automatically. The exposure time of these two CCDs that were always about 5–60 s in the past observations and should be in complete accordance for the comparison. After the test image, a dark frame image is captured for each CCD by us-ing a shutter in front of the lens. The dark current noise from the process and transmission of the signal can be subtracted during the procedure of image configuration by subtracting the dark frame image from the regular image (Fig. 2a). The images are captured automatically after these steps.
After the image has been captured, the scattering light of the laser beam is separated from the background noise in the image as in the following steps. Firstly, the central axis of the scattering signals of laser beam is fitted in the programme (the red line shown in Fig. 2b). Then the intensities of image on the perpendicular of this central axis (the blue line shown in Fig. 2b) are fitted with a normal distribution:
f (x)=I0+I× 1 √
2π σexp
−(x−µ) 2
2σ2 !
, (1)
scat-Figure 2.Noise subtraction of CCD-LADS:(a)dark current noise subtraction,(b)background noise subtraction.
tering angle, the angle-resolved scattering signals is obtained with the above steps of data acquisition.
When the angle-resolved signals from two CCDs are ob-tained, the change of signals with angles can be merged by following the steps below. Firstly, the minimum angleθ1and maximum angleθ2of the overlap angular region of signals from two CCDs are set as the boundary angle of data merg-ing (shadow zone in Fig. 3).θ1andθ2are always around 50 and 80◦, respectively. In this region, a transform coefficient with scattering anglesT (θ )is calculated:
T (θ )=I1(θ ) I2(θ )
. (2)
I1(θ )is the signal with the scattering angleθcaptured by the first CCD whileI2(θ )is that of the second CCD. The lifted signalI20(θ )can be calculated by multiplyingI2(θ )with the average of T (θ ) (Fig. 3). For the regions whereθ < θ1 or θ > θ2, the signal I1(θ ) or I20(θ ) are used as the merged scattering signal I (θ ), respectively. For the overlap region, a linear weighting average is calculated between I1(θ )and I20(θ ),
I (θ )=
I1(θ ) , θ < θ1
θ2−θ
θ2−θ1
×I1(θ )+
θ−θ1
θ2−θ1
×I20(θ ) , θ1≤θ≤θ2
I20(θ ) , θ > θ2.
(3)
Using the method above, the merged signals with scattering anglesI (θ )can be estimated.
2.2.2 The retrieval algorithm to determine aerosol phase function
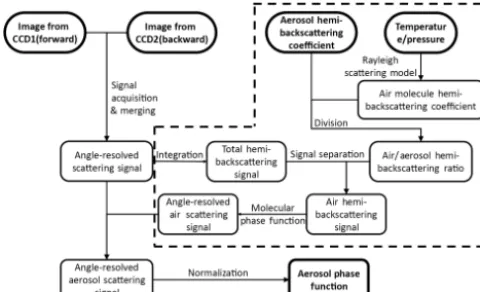
Figure 4 shows the flow chart of the retrieval algorithm used to determinep (θ )from CCD-LADS measurements. Accord-ing to the geometric structure of the CCD-LADS, the echo
Figure 3.Signal merging of two CCD cameras. Besides the signals captured by the first CCD (blue dotted line) and the second CCD (red solid line), the lifted signal from the second CCD (red dashed line) is also shown in the left drawing. The merged signal is shown in the right drawing.
equation of CCD-LADS can be figured first:
I (θ )=N0τZτRβ (θ ) , (4)
where β (θ ) is the scattering function of atmospheric air molecules and aerosols, τZ and τR are the transmittances on the optical paths of laser emitting and scattering respec-tively,N0is the calibration factor that depends on the opti-cal efficiency of the instrument. Depending on the area that the CCD-LADS covers, the longest distance between CCD cameras and the laser beam is less than 8 m. In this range, an assumption that τZ=τR=1 can be established with a threshold that the visibility should be larger than 1.5 km. The correlation between the visibility and extinction coefficient kexcan be expressed askex=3/visibility(km)(Chen et al., 2012) which means that the assumption can be established if kexis smaller than 2 km−1. In some extreme pollution pro-cesses with high concentrations of both aerosol and gaseous pollutants (Ma et al., 2011; Xu et al., 2011), the scattering and absorption of aerosols and gases (NO2, Dixon, 1940, O3, Burrows et al., 1999, etc.) may lead to extremekex val-ues. If thekexis more than 2 km−1, the assumption cannot be applied while the transmittance can be calculated with the measurement of visibility. With the assumption, Eq. (4) can be transformed toI (θ )=N0β (θ ).
Scattering phase functionp (θ )is the normalised angular distribution of the scattering function:
p (θ )=R4πβ (θ )
4πβ (θ )d
= 2β (θ ) R180
0 β (θ )sinθdθ
= 2I (θ ) R180
0 I (θ )sinθdθ
. (5)
Figure 4.Flow chart of the retrieval algorithm used to determine aerosol phase function from CCD-LADS measurements (the pro-cesses in the dashed box are used to subtract the scattering signal of air molecules from the total scattering signal).
As the first step, the scattering coefficient of air molecules at near-surface levelksc-air is calculated with the density of atmosphere by a Rayleigh scattering model:
ksc-air=
8π3 m2−12 3nairλ4
, (6)
where nair is the number density of air molecules, which depends on the surface pressure and temperature measured by the weather station. m is the index of refraction of at-mosphere, which depends onnair and the wavelength of the laser λ. The hemispheric backscattering coefficient of air molecules kbsc-air is a half ofksc-air (Bohren and Huffman, 2008).
To resolve the ratio between the air molecules and the total hemispheric scatteringRair=k kbsc-air
bsc-air+kbsc-aero, the hemispheric
backscattering coefficient of aerosols kbsc-aero is measured with an integrating nephelometer here.
To solve the intensity of the total hemispheric backscatter-ing scatterbackscatter-ing signalsIbsc, the angle-resolved scattering sig-nals should be integrated from a 90 to 180◦ scattering an-gle. Because of the detective angular range of CCD-LADS is 10–170◦, the angular truncation correction is necessary to re-solve the hemispheric scattering intensity. For the backward angular truncation, the scattering intensity in that range is as-sumed to be equal to the scattering intensity at the largest scattering angle that CCD-LADS can measured. After the correction above, the corrected intensityI0(θ )is used to ob-tainIbsc:
Ibsc= Z 2π
0 Z π
π/2
I0(θ )sinθdθdϕ. (7)
Then the angle-resolved scattering signals of air molecules can be calculated with a molecular phase function (Bohren and Huffman, 2008):
Iair(θ )=
3 1+cos2θ
4 ×
Ibsc×Rair
2π , (8)
Figure 5.Uncertainties of the merged angle-resolved signal from CCD-LADS measurement.
whereIair(θ )is the calculated angle-resolved scattering sig-nals of air molecules. According to Eq. (5), the aerosol phase functionpaero(θ )can be estimated as
paero(θ )=
2(I (θ )−Iair(θ )) R180
0 (I (θ )−Iair(θ ))sinθdθ
. (9)
2.2.3 Error analysis
Two types of uncertainties determine the error of the re-trieved aerosol phase function: the measurement errors caused by the processes of obtaining the angle-resolved sig-nals and an error introduced by the retrieval algorithm.
There are two sources of measurement errors in the data acquisition processes introduced in Sect. 2.2.1. Firstly, the measurement error of CCD used in the CCD-LADS is 10 % according to the related manual. The relative difference be-tween the fitted normal distribution introduced in Eq. (1) and the measured signal in the laboratory study is 8.8 %±1.5 %, which can also certify the 10 % measuring error onI intro-duced by the manual of CCD. Secondly, the measurement of the geometric relationship will lead to a relative error of 5 % at the most on the scattering angleθ introduced by the resolution and accuracy of the used tools.
The relative errors on the merged angle-resolved signals I (θ )can be derived by applying a standard propagation of errors to Eq. (3) (Bevington and Robinson, 2003):
1I
I 2
=FI1
1I 1 I1
2 +FI0
2
1I0 2 I20
2 +Fθ
1θ
θ 2
, (10)
where1 means the standard deviation of variables, 1xx is equal to the relative error ofx and the propagation factor Fx is defined asFx= xI∂I∂x
2
. By substituting the relative errors and the average signals in Eq. (10), the uncertainties on I (θ )are calculated as a distribution with an angle-resolved distribution shown in Fig. 5. The values of uncertainties on I (θ )are between 10 and 19 %, and they vary with angle.
groups of input parameters in the retrieval algorithm: merged angle-resolved signals, aerosol hemi-backscattering coeffi-cient and temperature/pressure. The errors of the temperature and pressure are about 0.1 K and 0.1 hPa (Box and Steffen, 2001), which will lead to a 0.02 % uncertainty on kbsc-air. Combined the 10 % uncertainties on the measured kbsc-aero (Heintzenberg et al., 2006), the uncertainty of Rair can be calculated as 7 % with the algorithm in Sect. 2.2.2. Accord-ing to the algorithm shown in Fig. 4, the uncertainty of the retrieved aerosol phase function are mainly dominated by the uncertainties of the merged signal shown in Fig. 5, and also influenced by the uncertainty ofRairin a way.
3 Results
3.1 Laboratory results
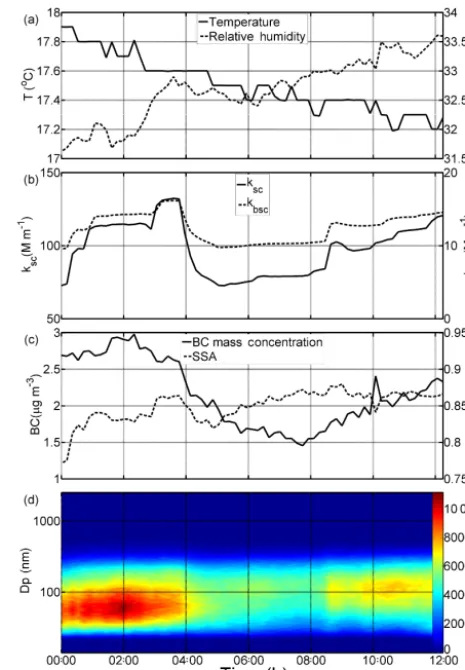
To validate the ability of the CCD-LADS to measure the aerosol phase function, an indoor experiment was held in the laboratory in the Physics Building at Peking University during 7–8 November 2015. The time resolution of CCD-LADS was set to 60 s during the experiment, while the an-gular detection ranged from 10 to 170◦. The aerosol scat-tering coefficient, number size distribution, mass concen-tration of black carbon particles, ambient temperature and relative humidity were measured with an integrating neph-elometer (Model 3563, TSI, Inc., Shoreview, MN, USA), a scanned mobility particle sizer (SMPS; Model 3936, TSI, Inc., Shoreview, MN, USA), an aerodynamic particle sizer (APS; Model 3321, TSI, Inc., Shoreview, MN, USA), a micro-Aethalometer (Model AE51, Magee Scientific, Berke-ley, CA, USA) and a dew-point chilled mirror sensor (Ed-getech DewMaster), respectively.
Figure 6 shows the time series of several quantities dur-ing the laboratory experiment. The scatterdur-ing/hemispheric backscattering coefficient of aerosols at 525 nm wavelength shown in Fig. 6b and the mass concentration of black car-bon particles shown in Fig. 6c reveal the same pattern that first declines and climbs up afterwards. The same pattern can be discovered in the time series of particle number size dis-tributions shown in Fig. 6d. The variation reflects the slow exchange between the indoor and outdoor air. The peak di-ameter of aerosol number size distribution was still around 100 nm, but it had a slight shift during the experiment. There-fore, the fine particles are dominant in the laboratory. The single scattering albedo (SSA) shown in Fig. 6c was around 0.85 which means that the black carbon aerosol took up a relatively large proportion of the aerosol species, resulting in strong particle light absorption ability.
Having combined the particle number size distributions measured with SMPS/APS and the mass concentration of black carbon aerosols measured with AE51 (Fig. 6) into a modified Mie-scattering model, the aerosol optical properties including the aerosol phase function could be modelled (Ma
Figure 6.Time series of(a)temperature (solid line) and relative humidity (dashed line) in the laboratory,(b)scattering coefficient (solid line) and hemispheric backscattering coefficient (dashed line) of aerosols at 525 nm wavelength,(c)mass concentration of black carbon particles (solid line) and single scattering albedo of aerosols at 525 nm wavelength (dashed line),(d)PNSD of aerosols during the laboratory study at Peking University in 2015.
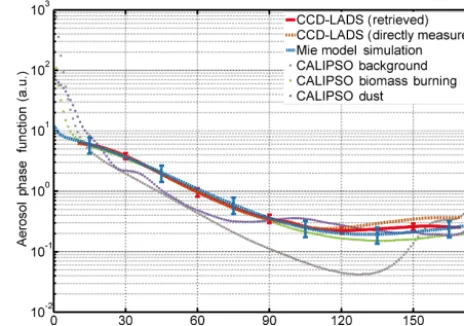
red solid line shows the retrieved p (θ ) from the CCD-LADS measurements with the retrieval algorithm introduced in Sect. 2.2.2, while the brown dashed line shows the re-trievedp (θ )from CCD-LADS directly without considering the scattering influence of air molecules. The blue dashed line shows the modelled result, and the other dotted lines ex-press the aerosol phase functions of different aerosol types from CALIPSO aerosol classification. The uncertainties of the retrievedp (θ )and simulatedp (θ )with the Mie model, which is about 30 % (Ma et al., 2011), are shown as error bars. The result shows that the comparison between the mod-elled p (θ )and the p (θ ) retrieved with the retrieval algo-rithm shows a better agreement than the comparison between the modelled p (θ )and thep (θ )retrieved from the CCD-LADS measurements directly, especially for the backward scattering. The reasons for this phenomenon is that the scat-tering coefficients of aerosols and air molecules are closer to each other for the backward scatter than for the forward scatter based on the background and that the total scatter-ing coefficient of aerosols is always much higher than that of air molecules. The comparison also shows that the re-trieved p (θ )is closer to the aerosol phase function of the biomass burning aerosol among the six aerosol types clas-sified from CALIPSO aerosol products. Compared with the other aerosol types, the biomass burning aerosol represents a better absorption ability due to the larger percentage of black carbon aerosol and organic aerosol, and also a smaller effec-tive diameter around 100 nm (Omar et al., 2005; Rissler et al., 2006; Zhu et al., 2017). The SSA and particle number size distribution of aerosols during the experiment shown in Fig. 6 also have similar characteristics to the biomass burning aerosol.
To further validate the quality of the retrieved result from the CCD-LADS measurement, a comparison was also car-ried out among thep (θ )at 42◦scattering angle resolved with different methods (Fig. 8). Thep (θ )at 42◦scattering angle is relatively typical and comparable because 42◦is the scat-tering angle used in the forward scatscat-tering visibility sensor (Kessner et al., 2013). The result of the comparison shows that thep (θ )from CCD-LADS measurement and Mie model have the same pattern and the average difference in the abso-lute values between these twop (θ )is less than 10 %.
3.2 Field measurements
During January 2016, a comprehensive field campaign fo-cused on air pollution in winter was conducted on the roof of a school building at Yanqi campus of the University of Chi-nese Academy of sciences (UCAS) in the Huairou district, Beijing (40◦240N, 116◦400E, 91 m a.s.l.). The observatory is 60 km away from the centre of Beijing and is at the edge of the North China Plain (NCP), which makes it suitable for measuring the regional pollution properties of the NCP (Ma et al., 2016). During the campaign, all the instruments except for the CCD-LADS were housed in a laboratory with a steady
Figure 7. Comparison between aerosol phase function obtained from CCD-LADS measurements (red solid line shows the result es-timated with the retrieval algorithm, brown dashed line shows that estimated directly with the measurements), modelled with modi-fied Mie model (blue dashed line) and offered by previous studies with CALIPSO (different colours of dotted lines represent different aerosol types).
Figure 8.Comparison between aerosol phase function at 42◦ scat-tering angle obtained from CCD-LADS measurements (results es-timated with the retrieval algorithm are shown with a fine solid line, while the values estimated directly with the measurements are shown with a dashed line) and modelled with a modified Mie model (shown with a bold solid line).
room temperature of 20◦C. The aerosols were sampled from
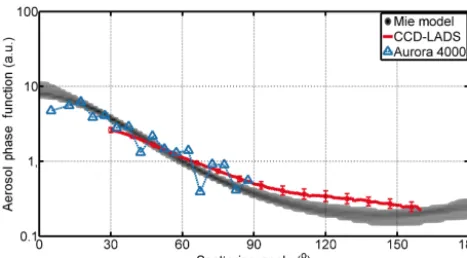
Figure 9. Comparison between aerosol phase function retrieved from CCD-LADS measurements (red line shows the average value, the error bar shows the standard deviation), measured from Aurora 4000 polar nephelometer (blue triangle) and modelled with modi-fied Mie model (grayscale map).
angular detection range of the CCD-LADS was 30–160◦in this campaign.
During the field measurement, the scattering phase func-tion of dry aerosols could be resolved in two ways, with Aurora 4000 polar nephelometer measurements or with the modified Mie-scattering model with the related aerosol mea-surements. Under high relative humidity condition, aerosol particles will absorb moisture in the atmosphere and exhibit hygroscopic growth significantly (Bian et al., 2014; Chen et al., 2014; Kuang et al., 2016a), and hence the scattering properties of ambient and dry aerosols are totally different. Therefore, the data collected at a relative humidity above 70 % were eliminated from the comparison between the scat-tering phase functions of dry and ambient aerosols obtained by different methods. Figure 9 shows the result of the com-parison mentioned above. The results from the three meth-ods are consistent with one another in the overlap of the de-tectable scattering angular range. Compared with the other results, the retrieval of CCD-LADS measurement enhances the backward scattering fraction of aerosol. This might be caused by the angular range (30–160◦), which did not reach 10–170◦and therefore might have increased errors in retriev-ing the angular distribution of aerosol scatterretriev-ing. Thep (θ ) from Aurora 4000 measurements have the similar average pattern with the results from other methods, but the deviation of its pattern is obvious. Compared to the Aurora 4000 re-sults, there are two significant advantages of CCD-LADS: wider detection range and better stability.
4 Discussions and conclusions
A novel instrument named charge-coupled device-laser aerosol detective system (CCD-LADS) was developed to measure the nocturnal ambient aerosol phase function in the ambient atmosphere at a wider range of detection angles and a higher accuracy. The validation in both laboratory and field
measurement shows the ability of CCD-LADS to measure the aerosol phase function. A laser is emitted horizontally, while two CCD cameras with fisheye lenses are installed be-sides the laser beam at the same altitude to capture the scat-tering signal from the laser beam with the cameras facing forward and backward. Then the signal captured by the two cameras are merged into one signal curve. The detectable an-gular range is from 10 to 170◦, while the angle resolution reach 0.1◦ per pixel. A retrieval algorithm is developed to subtract the influence of air molecule scattering with the in-tegrating nephelometer and weather station measurements. The uncertainties of CCD-LADS were discussed.
To validate the ability of CCD-LADS to measure the aerosol phase function, an indoor experiment was held in the laboratory of the Physics Building at Peking Univer-sity during 7–8 November 2015. During the experiment, the angular detection range was from 10 to 170◦. The
com-parison between the modelledp (θ )and the retrieved p (θ ) shows excellent agreement. Both of them are close to the aerosol phase function of the biomass burning aerosol from CALIPSO aerosol products. The comparison result is reason-able, because the SSA and particle number size distribution of aerosols during the experiment also had similar character-istics to the biomass burning aerosol. The comparison of the p (θ )at 42◦scattering angle acquired by different methods also shows good agreements for both patterns and absolute values.
During January 2016, a comprehensive field campaign fo-cused on air pollution in winter was organised at the roof of a school building in Yanqi campus of UCAS. Depending on the limitation of the ambient condition, the angular detection range of the CCD-LADS was 30–160◦in this campaign. The
retrieved aerosol phase function with CCD-LADS measure-ments is consistent with both the Aurora 4000 measurement and the modified Mie model results in the overlap region of the detectable scattering angular range. Compared with the Aurora 4000 measurements during this campaign, the CCD-LADS measurements are steadier.
Both the laboratory experiment and the field measurement have demonstrated that the CCD-LADS is a robust instru-ment, fully capable of measuring the ambient aerosol phase function under different conditions. Overall, compared with the laboratory-scale instruments, the CCD-LADS measured aerosol phase functions with a wider angular range and at a higher angular resolution.
Data availability. The averaged retrieved aerosol phase function used to create Fig. 7 is attached in Supplement. The CALIPSO aerosol classification data are listed in the reference. The entire data set can be accessed by request to the corresponding author at [email protected].
Competing interests. The authors declare that they have no conflict of interest.
Acknowledgements. This work is supported by the National Natural Science Foundation of China (41590872, 41375134).
Edited by: Thomas Wagner
Reviewed by: two anonymous referees
References
Anderson, T. L., Covert, D. S., Marshall, S. F., Laucks, M. L., Charlson, R. J., Waggoner, A. P., Ogren, J. A., Caldow, R., Holm, R. L., Quant, F. R., Sem, G. J., Wiedensohler, A., Ahlquist, N. A., and Bates, T. S.: Performance Characteristics of a High-Sensitivity, Three-Wavelength, Total Scatter/Backscatter Nephelometer, J. At-mos. Ocean. Tech., 13, 967–986, https://doi.org/10.1175/1520-0426(1996)013<0967:PCOAHS>2.0.CO;2, 1996.
Andrews, E., Sheridan, P. J., Fiebig, M., McComiskey, A., Ogren, J. A., Arnott, P., Covert, D., Elleman, R., Gasparini, R., Collins, D., Jonsson, H., Schmid, B., and Wang, J.: Comparison of meth-ods for deriving aerosol asymmetry parameter, J. Geophys. Res.-Atmos., 111, D05S04, https://doi.org/10.1029/2004JD005734, 2006.
Barkey, B., Bailey, M., Liou, K.-N., and Hallett, J.: Light-scattering properties of plate and column ice crystals generated in a labora-tory cold chamber, Appl. Optics, 41, 5792–5796, 2002. Barkey, B., Paulson, S. E., and Chung, A.: Genetic Algorithm
Inver-sion of Dual Polarization Polar Nephelometer Data to Determine Aerosol Refractive Index, Aerosol Sci. Tech., 41, 751–760, 2007. Bevington, P. R. and Robinson, D. K.: Data reduction and error analysis, Third Edn., Physical Science – Astronomy, McGraw-Hill Education, 336 pp., 2003.
Bian, Y. X., Zhao, C. S., Ma, N., Chen, J., and Xu, W. Y.: A study of aerosol liquid water content based on hygroscopicity measure-ments at high relative humidity in the North China Plain, At-mos. Chem. Phys., 14, 6417–6426, https://doi.org/10.5194/acp-14-6417-2014, 2014.
Bohren, C. F. and Huffman, D. R.: Absorption and scattering of light by small particles, John Wiley & Sons, New York, 2008. Box, J. E. and Steffen, K.: Sublimation on the
Green-land Ice Sheet from automated weather station obser-vations, J. Geophys. Res.-Atmos., 106, 33965–33981, https://doi.org/10.1029/2001jd900219, 2001.
Burrows, J. P., Richter, A., Dehn, A., Deters, B., Himmelmann, S., Voigt, S., and Orphal, J.: ATMOSPHERIC REMOTE-SENSING REFERENCE DATA FROM GOME – 2. TEMPERATURE-DEPENDENT ABSORPTION CROSS SECTIONS OF O3 IN
THE 231–794NM RANGE, J. Quant. Spectrosc. Ra., 61, 509– 517, https://doi.org/10.1016/S0022-4073(98)00037-5, 1999. Castagner, J.-L. and Bigio, I. J.: Polar nephelometer based on a
ro-tational confocal imaging setup, Appl. Optics, 45, 2232–2239, 2006.
Castagner, J.-L. and Bigio, I. J.: Particle sizing with a fast polar nephelometer, Appl. Optics, 46, 527–532, 2007.
Chen, J., Zhao, C. S., Ma, N., Liu, P. F., Göbel, T., Hallbauer, E., Deng, Z. Z., Ran, L., Xu, W. Y., Liang, Z., Liu, H. J., Yan, P., Zhou, X. J., and Wiedensohler, A.: A parameterization of low visibilities for hazy days in the North China Plain, At-mos. Chem. Phys., 12, 4935–4950, https://doi.org/10.5194/acp-12-4935-2012, 2012.
Chen, J., Zhao, C. S., Ma, N., and Yan, P.: Aerosol hygroscopicity parameter derived from the light scattering enhancement factor measurements in the North China Plain, Atmos. Chem. Phys., 14, 8105–8118, https://doi.org/10.5194/acp-14-8105-2014, 2014. Coenen, J. W., Arnoux, G., Bazylev, B., Matthews, G. F.,
Jach-mich, S., Balboa, I., Clever, M., Dejarnac, R., Coffey, I., Corre, Y., Devaux, S., Frassinetti, L., Gauthier, E., Horacek, J., Knaup, M., Komm, M., Krieger, K., Marsen, S., Meigs, A., Mertens, P., Pitts, R. A., Puetterich, T., Rack, M., Stamp, M., Sergienko, G., Tamain, P., and Thompson, V.: ELM induced tungsten melting and its impact on tokamak operation, J. Nucl. Mater., 463, 78– 84, https://doi.org/10.1016/j.jnucmat.2014.08.062, 2015. Curtis, D. B., Aycibin, M., Young, M. A., Grassian, V. H., and
Kleiber, P. D.: Simultaneous measurement of light-scattering properties and particle size distribution for aerosols: Application to ammonium sulfate and quartz aerosol particles, Atmos. Envi-ron., 41, 4748–4758, 2007.
Curtis, D. B., Meland, B., Aycibin, M., Arnold, N. P., Grassian, V. H., Young, M. A., and Kleiber, P. D.: A laboratory investigation of light scattering from representative components of mineral dust aerosol at a wavelength of 550 nm, J. Geophys. Res.-Atmos., 113, D08210, https://doi.org/10.1029/2007JD009387, 2008. Dixon, J. K.: The Absorption Coefficient of Nitrogen
Diox-ide in the Visible Spectrum, J. Chem. Phys., 8, 157–160, https://doi.org/10.1063/1.1750622, 1940.
Heintzenberg, J. and Charlson, R. J.: Design and Applica-tions of the Integrating Nephelometer: A Review, J. At-mos. Ocean. Tech., 13, 987–1000, https://doi.org/10.1175/1520-0426(1996)013<0987:DAAOTI>2.0.CO;2, 1996.
Heintzenberg, J., Wiedensohler, A., Tuch, T. M., Covert, D. S., Sheridan, P., Ogren, J. A., Gras, J., Nessler, R., Kleefeld, C., Kalivitis, N., Aaltonen, V., Wilhelm, R.-T., and Havlicek, M.: Intercomparisons and Aerosol Calibrations of 12 Commercial Integrating Nephelometers of Three Manufacturers, J. Atmos. Ocean. Tech., 23, 902–914, https://doi.org/10.1175/jtech1892.1, 2006.
van de Hulst, H. C.: Light scattering by small particles, Dover Pub-lications, New York, 1957.
Kessner, A. L., Wang, J., Levy, R. C., and Colarco, P. R.: Remote sensing of surface visibility from space: A look at the United States East Coast, Atmos. Environ., 81, 136–147, 2013. Kim, H., Barkey, B., and Paulson, S. E.: Real refractive indices ofα
-andβ-pinene and toluene secondary organic aerosols generated from ozonolysis and photo-oxidation, J. Geophys. Res.-Atmos., 115, D24212, https://doi.org/10.1029/2010jd014549, 2010. Kuang, Y., Zhao, C. S., Tao, J. C., and Ma, N.: Diurnal variations
of aerosol optical properties in the North China Plain and their influences on the estimates of direct aerosol radiative effect, At-mos. Chem. Phys., 15, 5761–5772, https://doi.org/10.5194/acp-15-5761-2015, 2015.
Kuang, Y., Zhao, C. S., Tao, J. C., Bian, Y. X., and Ma, N.: Impact of aerosol hygroscopic growth on the direct aerosol radiative effect in summer on North China Plain, Atmos. Environ., 147, 224– 233, 2016b.
Ma, N., Zhao, C. S., Nowak, A., Müller, T., Pfeifer, S., Cheng, Y. F., Deng, Z. Z., Liu, P. F., Xu, W. Y., Ran, L., Yan, P., Göbel, T., Hallbauer, E., Mildenberger, K., Henning, S., Yu, J., Chen, L. L., Zhou, X. J., Stratmann, F., and Wiedensohler, A.: Aerosol optical properties in the North China Plain during HaChi cam-paign: an in-situ optical closure study, Atmos. Chem. Phys., 11, 5959–5973, https://doi.org/10.5194/acp-11-5959-2011, 2011. Ma, N., Zhao, C. S., Müller, T., Cheng, Y. F., Liu, P. F., Deng, Z.
Z., Xu, W. Y., Ran, L., Nekat, B., van Pinxteren, D., Gnauk, T., Müller, K., Herrmann, H., Yan, P., Zhou, X. J., and Wiedensohler, A.: A new method to determine the mixing state of light absorb-ing carbonaceous usabsorb-ing the measured aerosol optical properties and number size distributions, Atmos. Chem. Phys., 12, 2381– 2397, https://doi.org/10.5194/acp-12-2381-2012, 2012. Ma, N., Zhao, C., Tao, J., Wu, Z., Kecorius, S., Wang, Z., Größ, J.,
Liu, H., Bian, Y., Kuang, Y., Teich, M., Spindler, G., Müller, K., van Pinxteren, D., Herrmann, H., Hu, M., and Wiedensohler, A.: Variation of CCN activity during new particle formation events in the North China Plain, Atmos. Chem. Phys., 16, 8593–8607, https://doi.org/10.5194/acp-16-8593-2016, 2016.
McCrowey, C. J., Tinilau, S. S., Calderon, G., Koo, J.-E., and Curtis, D. B.: A Portable High-Resolution Polar Nephelometer for Mea-surement of the Angular Scattering Properties of Atmospheric Aerosol: Design and Validation, Aerosol Sci. Tech., 47, 592–605, 2013.
Miyamoto, K.: Fish Eye Lens, J. Opt. Soc. Am., 54, 1060–1061, https://doi.org/10.1364/JOSA.54.001060, 1964.
Müller, T., Laborde, M., Kassell, G., and Wiedensohler, A.: Design and performance of a three-wavelength LED-based total scatter and backscatter integrating nephelometer, Atmos. Meas. Tech., 4, 1291–1303, https://doi.org/10.5194/amt-4-1291-2011, 2011. Muñoz, O., Volten, H., de Haan, J. F., Vassen, W., and
Hov-enier, J. W.: Experimental determination of scattering matri-ces of randomly oriented fly ash and clay particles at 442 and 633 nm, J. Geophys. Res.-Atmos., 106, 22833–22844, https://doi.org/10.1029/2000JD000164, 2001.
Muñoz, O., Volten, H., de Haan, J. F., Vassen, W., and Hovenier, J. W.: Experimental determination of the phase function and degree of linear polarization of El Chichón and Pinatubo vol-canic ashes, J. Geophys. Res.-Atmos., 107, ACL 4-1–ACL 4-8, https://doi.org/10.1029/2001JD000983, 2002.
Muñoz, O., Moreno, F., Guirado, D., Ramos, J. L., López, A., Girela, F., Jerónimo, J. M., Costillo, L. P., and Bus-tamante, I.: Experimental determination of scattering matri-ces of dust particles at visible wavelengths: The IAA light scattering apparatus, J. Quant. Spectrosc. Ra., 111, 187–196, https://doi.org/10.1016/j.jqsrt.2009.06.011, 2010.
Muñoz, O. and Hovenier, J. W.: Laboratory measurements of sin-gle light scattering by ensembles of randomly oriented small ir-regular particles in air. A review, J. Quant. Spectrosc. Ra., 112, 1646–1657, https://doi.org/10.1016/j.jqsrt.2011.02.005, 2011. Omar, A. H., Won, J.-G., Winker, D. M., Yoon, S.-C., Dubovik,
O., and McCormick, M. P.: Development of global aerosol models using cluster analysis of Aerosol Robotic Network
(AERONET) measurements, J. Geophys. Res.-Atmos., 110, D10S14, https://doi.org/10.1029/2004JD004874, 2005. Omar, A. H., Winker, D. M., Vaughan, M. A., Hu, Y., Trepte, C. R.,
Ferrare, R. A., Lee, K.-P., Hostetler, C. A., Kittaka, C., Rogers, R. R., Kuehn, R. E., and Liu, Z.: The CALIPSO Automated Aerosol Classification and Lidar Ratio Selection Algorithm, J. Atmos. Ocean. Tech., 26, 1994–2014, 2009.
Pachauri, R. K., Allen, M. R., Barros, V. R., Broome, J., Cramer, W., Christ, R., Church, J. A., Clarke, L., Dahe, Q., Dasgupta, P., Dubash, N. K., Edenhofer, O., Elgizouli, I., Field, C. B., Forster, P., Friedlingstein, P., Fuglestvedt, J., Gomez-Echeverri, L., Hal-legatte, S., Hegerl, G., Howden, M., Jiang, K., Jimenez Cisneroz, B., Kattsov, V., Lee, H., Mach, K. J., Marotzke, J., Mastrandrea, M. D., Meyer, L., Minx, J., Mulugetta, Y., O’Brien, K., Oppen-heimer, M., Pereira, J. J., Pichs-Madruga, R., Plattner, G.-K., Pörtner, H.-O., Power, S. B., Preston, B., Ravindranath, N. H., Reisinger, A., Riahi, K., Rusticucci, M., Scholes, R., Seyboth, K., Sokona, Y., Stavins, R., Stocker, T. F., Tschakert, P., van Vu-uren, D., and van Ypserle, J.-P.: Climate Change 2014: Synthe-sis Report. Contribution of Working Groups I, II and III to the Fifth Assessment Report of the Intergovernmental Panel on Cli-mate Change, edited by: Pachauri, R. K. and Meyer, L., IPCC, Geneva, Switzerland, 151 pp., 2014.
Rissler, J., Vestin, A., Swietlicki, E., Fisch, G., Zhou, J., Ar-taxo, P., and Andreae, M. O.: Size distribution and hygro-scopic properties of aerosol particles from dry-season biomass burning in Amazonia, Atmos. Chem. Phys., 6, 471–491, https://doi.org/10.5194/acp-6-471-2006, 2006.
Seinfeld, J. H. and Pandis, S. N.: Atmospheric Chemistry and Physics, Second Edn., John Wiley & Sons, Hoboken, New Jer-sey, 2006.
Tao, J. C., Zhao, C. S., Ma, N., and Liu, P. F.: The impact of aerosol hygroscopic growth on the single-scattering albedo and its ap-plication on the NO2photolysis rate coefficient, Atmos. Chem.
Phys., 14, 12055–12067, https://doi.org/10.5194/acp-14-12055-2014, 2014.
Wex, H., Neusüß, C., Wendisch, M., Stratmann, F., Koziar, C., Keil, A., Wiedensohler, A., and Ebert, M.: Particle scattering, backscattering, and absorption coefficients: An in situ closure and sensitivity study, J. Geophys. Res.-Atmos., 107, LAC 4-1– LAC 4-18, https://doi.org/10.1029/2000JD000234, 2002. Xu, W. Y., Zhao, C. S., Ran, L., Deng, Z. Z., Liu, P. F., Ma,
N., Lin, W. L., Xu, X. B., Yan, P., He, X., Yu, J., Liang, W. D., and Chen, L. L.: Characteristics of pollutants and their correlation to meteorological conditions at a suburban site in the North China Plain, Atmos. Chem. Phys., 11, 4353–4369, https://doi.org/10.5194/acp-11-4353-2011, 2011.