Influence of Limit-Setting and Participation in Physical
Activity on Youth Screen Time
WHAT’S KNOWN ON THIS SUBJECT: Children’s screen time should be limited toⱕ2 hours/day. Strategies to limit excessive screen time include development of parental rules (studies have not yet examined the importance of consistency) and promotion of physical activity (study results have been mixed).
WHAT THIS STUDY ADDS: Rules that were consistent and that were reported by both parents and children were associated with the lowest prevalence of children exceeding recommended screen-time limits. Children’s odds of exceeding screen-time limits decreased as the number of physical activity sessions increased.
abstract
OBJECTIVES:To examine the associations of demographics, rules as-sociated with television-viewing, and physical activity with daily screen time (including television, non–school-related computer use, and video games) in children and adolescents.
METHODS:We analyzed data from a telephone survey of 7415 youth aged 9 to 15 years from the Youth Media Campaign Longitudinal Survey. We used logistic regression models to calculate odds of exceeding recommended screen-time limits (⬎120 minutes/day) according to demographics, rules, and physical activity.
RESULTS:Odds that children would exceed recommended screen-time limits were positively associated with age and black race/ethnicity and negatively associated with income level. Children and adolescents who reported that they really agreed that their parents had rules about time spent watching television and playing video games were less likely to ex-ceed recommended limits than those who strongly disagreed that their parents had rules. Similarly, when parents reported always or very often having limits on television watching (versus rarely or never) and when parents correctly identified the recommended limits, children were less likely to exceed recommended limits. Children whose parents reported consistent limits and who themselves reported consistent rules about time spent watching television had the lowest prevalence of exceeding recommended limits. Odds that children would exceed recommended lim-its decreased as physical activity in the previous week increased.
CONCLUSIONS:Parental rules regarding screen time and participa-tion in physical activity play a role in the amount of screen time among children and adolescents. Programs that encourage limit-setting by parents and promote physical activity may reduce screen time among youth.Pediatrics2010;126:e89–e96
AUTHORS:Susan A. Carlson, MPH,aJanet E. Fulton, PhD,a
Sarah M. Lee, PhD,aJohn T. Foley, PhD,bCarrie Heitzler,
PhD,cand Marian Huhman, PhDd
aNational Center for Chronic Disease Prevention and Health Promotion, Centers for Disease Control and Prevention, Atlanta, Georgia;bDepartment of Physical Education, State University of New York, Cortland, New York;cDivision of Epidemiology and Community Health, University of Minnesota, Minneapolis, Minnesota; anddDepartment of Communication, University of Illinois, Urbana-Champaign, Urbana, Illinois
KEY WORDS
television, parenting, physical activity, adolescents
ABBREVIATIONS
YMCLS—Youth Media Campaign Longitudinal Survey AAP—American Academy of Pediatrics
CDC—Centers for Disease Control and Prevention CI— confidence interval
The findings and conclusions in this report are those of the authors and do not necessarily represent the official position of the Centers for Disease Control and Prevention.
www.pediatrics.org/cgi/doi/10.1542/peds.2009-3374 doi:10.1542/peds.2009-3374
Accepted for publication Mar 1, 2010
Address correspondence to Susan A. Carlson, MPH, Centers for Disease Control and Prevention, National Center for Chronic Disease Prevention and Health Promotion, 4770 Buford Hwy, NE, Mail Stop K-46, Atlanta, GA 30345. E-mail: [email protected] PEDIATRICS (ISSN Numbers: Print, 0031-4005; Online, 1098-4275). Copyright © 2010 by the American Academy of Pediatrics
FINANCIAL DISCLOSURE:The authors have indicated they have no financial relationships relevant to this article to disclose.
computers for non–school-related use) affects multiple aspects of child and adolescent health. Screen-media use has been associated with youth al-cohol use,1 precocious sexual
prac-tices,2 negative body concept,3 eating
disorders,4 aggressive behaviors,5,6
worsened educational achievement,7
and higher BMI.8,9Most screen media
viewed by children comprise televi-sion, videos, and DVDs.10The American
Academy of Pediatrics (AAP) recom-mends that pediatricians advise par-ents of children older than 2 years to “limit children’s total media time (with entertainment media) to no more than 1 to 2 hours of quality programming per day,”11and the goal of increasing
the proportion of adolescents who view television 2 or fewer hours on a school day is a Healthy People 2010
objective.12
To help in the development of effective programs to reduce screen time, in-vestigators must more closely exam-ine the association of youth screen time with modifiable factors such as the presence of consistent parental rules and children’s levels of physical activity. Parental rules can effectively limit or deter adolescents from par-ticipating in excessive television-viewing.13,14However, it is not just the
presence or absence of rules that is important but also the consistency of the rules and whether children and ad-olescents are aware of the rules.15
In-tuitively, participation in physical activ-ity seems likely to be associated with limited screen time; however, previ-ously reported evidence regarding such an association has been incon-clusive.16–18In this study, we examined
whether demographic characteristics, consistency of rules about television-and video-viewing (reported by both parent and child), and physical activity were associated with screen time
year-olds throughout the United States.
METHODS
The Youth Media Campaign Longitudi-nal Survey (YMCLS) is a prospective, longitudinal study of a cohort of chil-dren who were initially selected to be representative of the US population and their parents. The YMCLS was designed for the evaluation of the Centers for Disease Control and Prevention (CDC) VERB campaign.19
The survey was administered via computer-assisted telephone inter-views conducted on 2 panels chosen through a list-assisted random-digit-dial method to select a sample of households. A 1-minute screening sur-vey was used to identify households with children aged 9 to 13 years. Par-ents and children completed separate interviews. Panel 1 surveys were con-ducted yearly from 2002 to 2006, and panel 2 surveys were conducted yearly from 2004 to 2006. Specifics about the sampling procedure and weighting have been reported elsewhere.19 The
institutional review board at the CDC approved the study.
For this analysis we combined the 2004 data from panel 1 (youth aged 11–15 years, n⫽ 2256) and panel 2 (youth aged 9 –13 years,n⫽5177). In 2002, 60.5% of selected households com-pleted a screening interview to deter-mine eligibility to participate in panel 1, and the cumulative response rate for 2002–2004 (the product of the com-pletion rate for the screening, parent, and child interviews) was 31.9%. In 2004, 58.8% of selected households completed a screening interview to de-termine eligibility for panel 2, and the overall response rate for 2004 was 43.9%. Five children were excluded from the analyses because they did not have complete information about
their parent reported not having or not watching television, and 13 children were excluded because they did not have information about rules associ-ated with playing video games because they reported not having or not playing video games. The final analytic sample included 7415 children and 5685 par-ents, including 1513 households with 2 or more children. Results were similar when the analysis was limited to 1 child per household.
Demographic Variables
Data on age and gender of participat-ing children were obtained from the adult screening interview and verified during parent interviews. Children’s race/ethnicity, parental education level, and parental income were ob-tained from the parent interview.
Screen Time
Children were asked: “How many hours did you watch TV, play video games, or play computer games yes-terday?” Children were instructed not to include time spent doing homework on the computer. Responses were re-corded by the interviewer in hours and minutes. Screen time was categorized into approximate quartiles (ie, 0 –30, 31– 60, 61–120, and ⬎120 minutes/ day). The definition used for exceeding recommended screen time (⬎120 minutes/day) was based on the AAP’s recommended limit for entertainment-media time.11
Rules and Limitations
par-ents have rules about how much time I can spend playing video games.” Chil-dren’s responses were collapsed into 3 categories (really agree, sort of agree/sort of disagree, and really dis-agree). Parents were asked how often (always, very often, sometimes, rarely, or never) they “set limits on the amount of time child watches TV” and “set limits on the amount of time child plays video games.” Responses were collapsed into 3 categories (always/ very often, sometimes, and rarely/ never). Parents also were asked to re-port the number of hours of television per day to which experts recommend children be limited and we collapsed this into 2 categories (choices were
ⱕ2 orⱖ3 hours).
Physical Activity
Children were asked to report all of the physical activities in which they had participated during the previous 7 days and whether each activity was an organized activity that had a coach, in-structor, or leader or if the activity was done during the child’s free time. Chil-dren were instructed to include activi-ties that “got your body moving,” such as sports, physical activity lessons, or playing actively with their friends. Chil-dren were instructed to exclude activ-ities during the school day, such as physical education and recess. We to-taled the number of activities reported to create counts per week of physical activity sessions for organized, free-time, and total physical activity. Cate-gories were created on the basis of quartiles for total sessions and free-time sessions. Because most children (60.7%) engaged in 0 sessions of orga-nized activity per week, 3 categories were created for organized sessions. A study was conducted to determine the reliability and validity of the physical activity measurements, and the re-sults showed acceptable test-retest reliability for reports of physical activ-ity and significant moderate
correla-tions of those reports with detailed ac-tivity logs and data gathered by use of activity monitors.20Children were also
asked if they currently played on any sports teams including teams run by their school or community group.
We conducted stratified data analyses to compare prevalence of television-viewing in approximate quartiles according to demographic character-istics, child-reported and parent-reported rules associated with television and video games, parent-reported knowledge of the recom-mended limits, and number of physical activity sessions. Each panel was weighted to population totals for chil-dren aged 9 to 13 years in the initial survey year after preliminary adjust-ments for differential probabilities of selection and nonresponse. Panel 1 was initially weighted to Census 2000 totals (http://factfinder.census.gov), and panel 2 was weighted to 2004 Cur-rent Population Survey totals (www. bls.gov/cps). After additional adjust-ments were made for attrition in follow-up assessments for panel 1, weights were controlled to 2004 Cur-rent Population Survey totals for chil-dren aged 11 to 15 years. To account for the complex sampling design, SUDAAN 9.0 (Research Triangle Insti-tute, Research Triangle Park, NC) was used to obtain estimates, and SEs were estimated by using the jackknife replication method. Analy-sis of unweighted data yielded simi-lar results for associations.
RESULTS
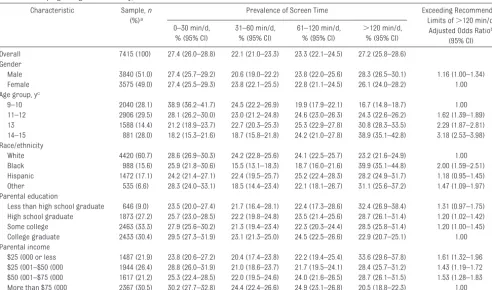
Adjusted odds of exceeding recom-mended screen-time limits were higher in boys than in girls, were pos-itively associated with age (P for trend⬍.001), and were negatively as-sociated with parental income level (Pfor trend ⬍ .001) (Table 1). Com-pared with white children, children in the black and other race/ethnicity
cat-egories were more likely to report ex-ceeding recommended screen-time limits. The largest differences in the amount of screen time were associ-ated with child age; 16.7% of children aged 9 to 10 years compared with 38.9% of children aged 14 to 15 years reported screen times of more than 2 hours/day, and 38.9% of children aged 9 to 10 years compared with 18.2% of children aged 14 to 15 years reported screen times of less than 30 minutes/ day (Table 1).
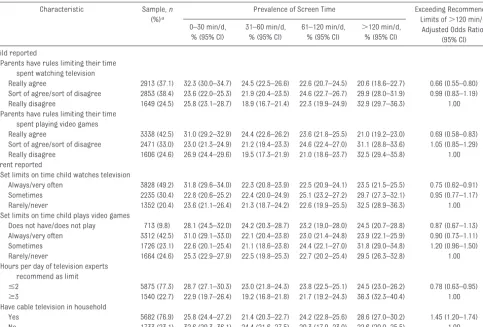
Most parents (76.9%) reported having cable television available in the house. The presence of cable television was associated with children exceeding recommended screen-time limits (Ta-ble 2). Almost 1 in 4 parents reported that experts recommend children be limited to more than 3 hours of televi-sion per day (Table 2). Children whose parents identified the recommended limit as 2 or fewer hours/day were less likely to report child’s screen times that exceeded this limit.
Fewer than half (49.2%) of the parents reported that they always or very often placed limits on the time their child could watch television, whereas 37.1% of children really agreed that their parents had rules about how much television the child could watch (Table 2). Children who reported really agree-ing that their parents had rules about how much time the child could spend watching television and playing video games were less likely to exceed
rec-ommended limits compared with
those who really disagreed that their parents had rules. Similarly, children of parents who reported always or very often having limits on time the child watched television were less likely to exceed recommended limits for screen time; however, this associa-tion was not significant in relaassocia-tion to playing video games. Rules about television-viewing and playing video games were not significantly
ated with less screen time when chil-dren reported that they sort of agreed or disagreed that rules were present (versus really disagree), nor were the rules significantly associated with less screen time when parents reported sometimes having limits (versus rarely/never).
Children who really agreed that their parents had rules limiting television time had a higher prevalence of watch-ing less than 30 minutes/day of televi-sion and a lower prevalence of watch-ing more than 120 minutes/day than those who really disagreed that their parents had rules (Table 2). The same association was observed for children whose parents reported always/very often having limits to television watch-ing (versus rarely/never).
Among children whose parents re-ported always or very often having
rules about the amount of television time, fewer than half, 47.3% (95% con-fidence interval [CI]: 45.3– 49.3) re-ported really agreeing that their parents had rules, 34.9% (95% CI: 33.1– 36.8) reported sort of agreeing or sort of disagreeing, and 17.8% (95% CI: 16.4 –19.2) reported really disagreeing (data not shown). Children whose par-ents reported having rules always or very often and who themselves re-ported really agreeing that their par-ents had rules about how much televi-sion they could watch had the lowest prevalence of exceeding recom-mended screen-time limits (18.1%) (Fig 1).
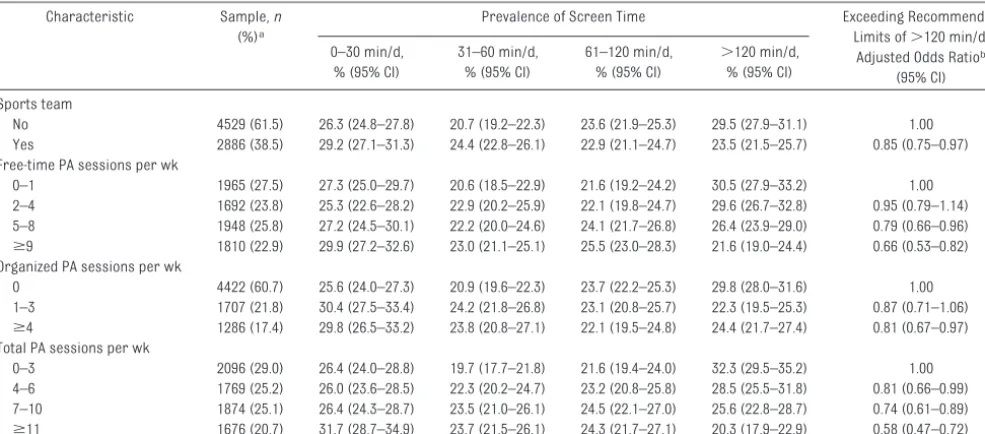
Physical activity was negatively associ-ated with screen time (Table 3). Being on a sports team was associated with children being less likely to exceed rec-ommended screen-time limits. As the
number of total physical activity ses-sions (combined free-time and orga-nized activities) increased, the odds of exceeding recommended screen-time limits decreased (Pfor trend⬍.001). This trend was also observed when we examined free-time (P for trend ⬍ .001) and organized (Pfor trend⫽.02) physical activity sessions separately.
DISCUSSION
The AAP recommends that children aged 2 years or older engage in no more than 2 hours of quality media time per day.11
We found that more than 27% of youth aged 9 to 15 years exceed the recom-mended limit of screen time and that boys, children of black race/ethnicity, and children from lower-income families exceed this limit more than other popu-lations. We also found that the likelihood that youth would exceed recommended
Characteristic Sample,n
(%)a
Prevalence of Screen Time Exceeding Recommended Limits of⬎120 min/d,
Adjusted Odds Ratiob
(95% CI) 0–30 min/d,
% (95% CI)
31–60 min/d, % (95% CI)
61–120 min/d, % (95% CI)
⬎120 min/d, % (95% CI) Overall 7415 (100) 27.4 (26.0–28.8) 22.1 (21.0–23.3) 23.3 (22.1–24.5) 27.2 (25.8–28.6) Gender
Male 3840 (51.0) 27.4 (25.7–29.2) 20.6 (19.0–22.2) 23.8 (22.0–25.6) 28.3 (26.5–30.1) 1.16 (1.00–1.34) Female 3575 (49.0) 27.4 (25.5–29.3) 23.8 (22.1–25.5) 22.8 (21.1–24.5) 26.1 (24.0–28.2) 1.00 Age group, yc
9–10 2040 (28.1) 38.9 (36.2–41.7) 24.5 (22.2–26.9) 19.9 (17.9–22.1) 16.7 (14.8–18.7) 1.00 11–12 2906 (29.5) 28.1 (26.2–30.0) 23.0 (21.2–24.8) 24.6 (23.0–26.3) 24.3 (22.6–26.2) 1.62 (1.39–1.89) 13 1588 (14.4) 21.2 (18.9–23.7) 22.7 (20.3–25.3) 25.3 (22.9–27.8) 30.8 (28.3–33.5) 2.29 (1.87–2.81) 14–15 881 (28.0) 18.2 (15.3–21.6) 18.7 (15.8–21.8) 24.2 (21.0–27.8) 38.9 (35.1–42.8) 3.18 (2.53–3.98) Race/ethnicity
White 4420 (60.7) 28.6 (26.9–30.3) 24.2 (22.8–25.6) 24.1 (22.5–25.7) 23.2 (21.6–24.9) 1.00 Black 988 (15.6) 25.9 (21.8–30.6) 15.5 (13.1–18.3) 18.7 (16.0–21.6) 39.9 (35.1–44.8) 2.00 (1.59–2.51) Hispanic 1472 (17.1) 24.2 (21.4–27.1) 22.4 (19.5–25.7) 25.2 (22.4–28.3) 28.2 (24.9–31.7) 1.18 (0.95–1.45) Other 535 (6.6) 28.3 (24.0–33.1) 18.5 (14.4–23.4) 22.1 (18.1–26.7) 31.1 (25.6–37.2) 1.47 (1.09–1.97) Parental education
Less than high school graduate 646 (9.0) 23.5 (20.0–27.4) 21.7 (16.4–28.1) 22.4 (17.3–28.6) 32.4 (26.9–38.4) 1.31 (0.97–1.75) High school graduate 1873 (27.2) 25.7 (23.0–28.5) 22.2 (19.8–24.8) 23.5 (21.4–25.6) 28.7 (26.1–31.4) 1.20 (1.02–1.42) Some college 2463 (33.3) 27.9 (25.6–30.2) 21.3 (19.4–23.4) 22.3 (20.3–24.4) 28.5 (25.8–31.4) 1.20 (1.00–1.45) College graduate 2433 (30.4) 29.5 (27.3–31.9) 23.1 (21.3–25.0) 24.5 (22.5–26.6) 22.9 (20.7–25.1) 1.00 Parental income
$25 (000 or less 1487 (21.9) 23.8 (20.6–27.2) 20.4 (17.4–23.8) 22.2 (19.4–25.4) 33.6 (29.6–37.8) 1.61 (1.32–1.96 $25 (001–$50 (000 1944 (26.4) 28.8 (26.0–31.9) 21.0 (18.6–23.7) 21.7 (19.5–24.1) 28.4 (25.7–31.2) 1.43 (1.19–1.72 $50 (001–$75 (000 1617 (21.2) 25.3 (22.4–28.5) 22.0 (19.5–24.6) 24.0 (21.6–26.5) 28.7 (26.1–31.5) 1.53 (1.28–1.83 More than $75 (000 2367 (30.5) 30.2 (27.7–32.8) 24.4 (22.4–26.6) 24.9 (23.1–26.8) 20.5 (18.8–22.3) 1.00
aSample percentages were weighted.
bAdjusted models include gender, age (continuous, except for estimates according to age group), race/ethnicity, and parental income except for models that included parental education, which were adjusted for gender, age, and race/ethnicity.
screen-time limits was negatively associ-ated with parents’ being aware of rec-ommended limits, the existence of
con-sistent parental rules, and increasing amounts of physical activity. Our study results suggest that programs that
fo-cus on development of parental limit-setting and/or promotion of physical ac-tivity may be effective in decreasing screen time among youth aged 9 to 15 years.
In our study population the prevalence of children who exceeded recom-mended screen-time limits was within the range of results from other na-tional surveys. In a study in which in-vestigators used data from the National Health and Nutrition Examina-tion Survey, the overall prevalence es-timates were slightly higher, with 32% of children aged 6 to 11 years and 35% of children aged 12 to 15 years exceed-ing recommended limits.9 In another
study among US high school students, 35.4% reported watching television 3 or more hours on an average school day.12Our estimates also seemed low
FIGURE 1
Prevalence of youth who exceeded the recommended screen-time limit (⬎2 hours/day) according to child- and parent-reported rules: Youth Media Campaign Longitudinal Survey, 2004
TABLE 2 Prevalence of Quartiles of Screen Time and Odds Ratios of Exceeding Recommended Limits According to Rules (as Reported by Both Child and Parent), Parents’ Awareness of Recommended Limits, and Presence of Cable Television: Youth Media Campaign Longitudinal Survey, 2004
Characteristic Sample,n
(%)a
Prevalence of Screen Time Exceeding Recommended Limits of⬎120 min/d,
Adjusted Odds Ratiob
(95% CI) 0–30 min/d,
% (95% CI)
31–60 min/d, % (95% CI)
61–120 min/d, % (95% CI)
⬎120 min/d, % (95% CI) Child reported
Parents have rules limiting their time spent watching television
Really agree 2913 (37.1) 32.3 (30.0–34.7) 24.5 (22.5–26.6) 22.6 (20.7–24.5) 20.6 (18.6–22.7) 0.66 (0.55–0.80) Sort of agree/sort of disagree 2853 (38.4) 23.6 (22.0–25.3) 21.9 (20.4–23.5) 24.6 (22.7–26.7) 29.9 (28.0–31.9) 0.99 (0.83–1.19) Really disagree 1649 (24.5) 25.8 (23.1–28.7) 18.9 (16.7–21.4) 22.3 (19.9–24.9) 32.9 (29.7–36.3) 1.00 Parents have rules limiting their time
spent playing video games
Really agree 3338 (42.5) 31.0 (29.2–32.9) 24.4 (22.6–26.2) 23.6 (21.8–25.5) 21.0 (19.2–23.0) 0.69 (0.58–0.83) Sort of agree/sort of disagree 2471 (33.0) 23.0 (21.3–24.9) 21.2 (19.4–23.3) 24.6 (22.4–27.0) 31.1 (28.8–33.6) 1.05 (0.85–1.29) Really disagree 1606 (24.6) 26.9 (24.4–29.6) 19.5 (17.3–21.9) 21.0 (18.6–23.7) 32.5 (29.4–35.8) 1.00 Parent reported
Set limits on time child watches television
Always/very often 3828 (49.2) 31.8 (29.6–34.0) 22.3 (20.8–23.9) 22.5 (20.9–24.1) 23.5 (21.5–25.5) 0.75 (0.62–0.91) Sometimes 2235 (30.4) 22.8 (20.6–25.2) 22.4 (20.0–24.9) 25.1 (23.2–27.2) 29.7 (27.3–32.1) 0.95 (0.77–1.17) Rarely/never 1352 (20.4) 23.6 (21.1–26.4) 21.3 (18.7–24.2) 22.6 (19.9–25.5) 32.5 (28.9–36.3) 1.00 Set limits on time child plays video games
Does not have/does not play 713 (9.8) 28.1 (24.5–32.0) 24.2 (20.3–28.7) 23.2 (19.0–28.0) 24.5 (20.7–28.8) 0.87 (0.67–1.13) Always/very often 3312 (42.5) 31.0 (29.1–33.0) 22.1 (20.4–23.8) 23.0 (21.4–24.8) 23.9 (22.1–25.9) 0.90 (0.73–1.11) Sometimes 1726 (23.1) 22.6 (20.1–25.4) 21.1 (18.6–23.8) 24.4 (22.1–27.0) 31.8 (29.0–34.8) 1.20 (0.96–1.50) Rarely/never 1664 (24.6) 25.3 (22.9–27.9) 22.5 (19.8–25.3) 22.7 (20.2–25.4) 29.5 (26.3–32.8) 1.00 Hours per day of television experts
recommend as limit
ⱕ2 5875 (77.3) 28.7 (27.1–30.3) 23.0 (21.8–24.3) 23.8 (22.5–25.1) 24.5 (23.0–26.2) 0.78 (0.63–0.95) ⱖ3 1540 (22.7) 22.9 (19.7–26.4) 19.2 (16.8–21.8) 21.7 (19.2–24.3) 36.3 (32.3–40.4) 1.00 Have cable television in household
Yes 5682 (76.9) 25.8 (24.4–27.2) 21.4 (20.3–22.7) 24.2 (22.8–25.6) 28.6 (27.0–30.2) 1.45 (1.20–1.74) No 1733 (23.1) 32.6 (29.3–36.1) 24.4 (21.6–27.5) 20.3 (17.9–23.0) 22.6 (20.0–25.5) 1.00
aSample percentages were weighted.
bAll adjusted models include gender, age (continuous), race/ethnicity, and parental income.
when we compared them with results from the Kaiser Family Foundation, which reported that in 2004, 8- to 18-year-olds used screen media for⬃4 hours/day.10However, in another study
in which investigators used data from the National Survey of Children’s Health, the overall prevalence esti-mates were lower than those in our study (children aged 6 –17 years: 17.0%).21These differences in the
esti-mates may have been attributable to different definitions of screen time (ie, whether playing video games and com-puter games was included with screen time), whether categorical and contin-uous responses for amount of screen time were included, whether the child or parent reported the screen time, and differences in sample characteris-tics. The disparities in exceeding rec-ommended screen-time limits that we found among boys, children of black race/ethnicity, and children from lower-income families were consistent with results of other studies.10,12,22
Although our findings were similar to those reported for other studies,13,14
our study was unique in 2 ways. First, we examined the consistent enforce-ment of rules by asking parents to re-port how often they set limits and ask-ing children to report how much they agreed that rules were present. Sec-ond, we examined the presence of rules as reported by parents and chil-dren. This area of investigation was im-portant, because we found that chil-dren in families in which the parent and child agreed on the presence of rules had the lowest prevalence of ex-ceeding recommended screen-time limits. We found, however, that fewer than half of the parents reported that they always or very often had limits on time spent watching television, and only ⬃37% of the children really agreed that they had rules. Thus, the development and use of messages and programs designed to increase the prevalence of households that imple-ment consistent rules about television-viewing among youth may be an effec-tive way to decrease screen time.
Our findings suggest that programs that focus on educating parents about
recommended limits and encouraging parents to set limits may be promoting viable strategies to reduce screen time. However, these methods should be tested empirically. We found no in-tervention studies that have specifi-cally examined the effect of implemen-tation of consistent rules by parents on reducing screen time. There have been studies, however, in which edu-cating children,23 and in some cases
parents,24about limiting screen time
was observed to be associated with re-ductions in screen time. Results of a study in which the intervention group implemented 5 lessons delivered for a 12-week period to parents and chil-dren at home indicated that chilchil-dren’s screen time decreased.24The lessons
in this study focused on several strat-egies (eg, self-monitoring to reduce television-viewing, replacing viewing time with other activities, and budget-ing viewbudget-ing hours). Education of chil-dren can increase their awareness of the importance of limiting television-viewing time, and inclusion of parents in this process can help increase their
Characteristic Sample,n
(%)a
Prevalence of Screen Time Exceeding Recommended Limits of⬎120 min/d,
Adjusted Odds Ratiob
(95% CI) 0–30 min/d,
% (95% CI)
31–60 min/d, % (95% CI)
61–120 min/d, % (95% CI)
⬎120 min/d, % (95% CI) Sports team
No 4529 (61.5) 26.3 (24.8–27.8) 20.7 (19.2–22.3) 23.6 (21.9–25.3) 29.5 (27.9–31.1) 1.00 Yes 2886 (38.5) 29.2 (27.1–31.3) 24.4 (22.8–26.1) 22.9 (21.1–24.7) 23.5 (21.5–25.7) 0.85 (0.75–0.97) Free-time PA sessions per wk
0–1 1965 (27.5) 27.3 (25.0–29.7) 20.6 (18.5–22.9) 21.6 (19.2–24.2) 30.5 (27.9–33.2) 1.00 2–4 1692 (23.8) 25.3 (22.6–28.2) 22.9 (20.2–25.9) 22.1 (19.8–24.7) 29.6 (26.7–32.8) 0.95 (0.79–1.14) 5–8 1948 (25.8) 27.2 (24.5–30.1) 22.2 (20.0–24.6) 24.1 (21.7–26.8) 26.4 (23.9–29.0) 0.79 (0.66–0.96) ⱖ9 1810 (22.9) 29.9 (27.2–32.6) 23.0 (21.1–25.1) 25.5 (23.0–28.3) 21.6 (19.0–24.4) 0.66 (0.53–0.82) Organized PA sessions per wk
0 4422 (60.7) 25.6 (24.0–27.3) 20.9 (19.6–22.3) 23.7 (22.2–25.3) 29.8 (28.0–31.6) 1.00 1–3 1707 (21.8) 30.4 (27.5–33.4) 24.2 (21.8–26.8) 23.1 (20.8–25.7) 22.3 (19.5–25.3) 0.87 (0.71–1.06) ⱖ4 1286 (17.4) 29.8 (26.5–33.2) 23.8 (20.8–27.1) 22.1 (19.5–24.8) 24.4 (21.7–27.4) 0.81 (0.67–0.97) Total PA sessions per wk
0–3 2096 (29.0) 26.4 (24.0–28.8) 19.7 (17.7–21.8) 21.6 (19.4–24.0) 32.3 (29.5–35.2) 1.00 4–6 1769 (25.2) 26.0 (23.6–28.5) 22.3 (20.2–24.7) 23.2 (20.8–25.8) 28.5 (25.5–31.8) 0.81 (0.66–0.99) 7–10 1874 (25.1) 26.4 (24.3–28.7) 23.5 (21.0–26.1) 24.5 (22.1–27.0) 25.6 (22.8–28.7) 0.74 (0.61–0.89) ⱖ11 1676 (20.7) 31.7 (28.7–34.9) 23.7 (21.5–26.1) 24.3 (21.7–27.1) 20.3 (17.9–22.9) 0.58 (0.47–0.72)
PA indicates physical activity. aSample percentages were weighted.
awareness about recommended limits and about methods to limit screen time at home.
It makes intuitive sense that time spent in physical activity could dis-place screen time or screen time could displace time spent in physical activity. Our cross-sectional data did not allow us to determine the direction of this association; however, our findings showed that physical activity and screen time are negatively associated and thus supported the displacement hypothesis. Previous evidence has been inconclusive regarding this asso-ciation16–18; however, some
research-ers have suggested that this displace-ment process may become more apparent after adolescence,25and our
findings were similar to the results of 2 other studies with similar-aged chil-dren.26,27 In addition, Epstein et al28
have shown that in obese children, positive reinforcement of a decrease in sedentary behaviors is associated with increases in physical activity. The association we observed was for sports participation and organized and free-time activity, which suggests that the availability of opportunities to participate in physical activity, either organized or free time, may be 1 way to decrease screen time among 9- to 15-year-olds. Future work should examine the causal direction of the association to understand how these behaviors in-fluence one another.
Our study had both strengths and lim-itations. As we previously mentioned, a
strength of our study was that we col-lected information on reported rules from both parents and children. Also, the reliability of our measures were tested in a sample of youth from 8 eth-nically diverse schools, with a 1-week time period between administration of the YMCLS to youth at each of the schools. Our measures were found to have moderate-to-high reliability (moderate: total and free-time phys-ical activity sessions; high: organized physical activity sessions, sports team participation, screen time, and children’s reported rules about tele-vision and video-game use).29In
addi-tion, our measures of physical activ-ity sessions have been shown to provide valid estimates of weekly physical activity.20 Our use of data
from a cohort of children initially se-lected to be nationally representa-tive is another strength. However, be-cause of low response rates and attrition over time, there is the possi-bility that parents and children who agreed to be in the study may not be representative of the US population. Nevertheless, the distribution of our unweighted sample was similar to that of our sample weighted to the US population, which suggests that our sample may have been broadly repre-sentative; thus, our results may be generalized to apply to a diverse popu-lation. In addition, the weights we ap-plied in our analysis served to adjust for nonresponse and potential under-coverage, although the use of weights cannot adjust for the potential bias
introduced if survey nonresponse and/or undercoverage were associ-ated with our variables of interest. Fi-nally, our study was cross-sectional and could not be used to determine causality. Future work should examine the association between parental rules and physical-activity sessions by using a longitudinal design to deter-mine if the age trajectories in screen time are modified by the existence of consistent rules or high levels of phys-ical activity.
CONCLUSIONS
In our study population, ⬃1 in 4 chil-dren and adolescents exceeded the recommended screen time limits of 2 hours/day. Boys, children from lower-income families, and African American children were more likely to report in-creased screen times. Our study re-sults suggest that programs that focus on the development of parental limits and that promote physical activity may lead to decreased screen time among youth aged 9 to 15 years. Programs to reduce screen time must address the roles of parents and parental rules, target age, and socioeconomic charac-teristics of families. Programs might best be focused on educating parents about recommended limits and the im-portance of consistent rules. In addi-tion, promotion of physical activity al-ternatives to sedentary screen-time behavior may be an appropriate strat-egy for reducing screen time among youth.
REFERENCES
1. Robinson TN, Chen HL, Killen JD. Television and music video exposure and risk of ado-lescent alcohol use. Pediatrics. 1998; 102(5). Available at: www.pediatrics.org/ cgi/content/full/102/5/e54
2. Collins RL, Elliott MN, Berry SH, et al. Watch-ing sex on television predicts adolescent initiation of sexual behavior. Pediatrics.
2004;114(3):280 –289
3. Harrison K, Cantor J. The relationship
be-tween media consumption and eating dis-orders.J Commun.1997;47(1):40 – 67 4. Field AE, Camargo CA, Taylor CB, Berkey CS,
Colditz GA. Relation of peer and media influ-ences to the development of purging behav-iors among preadolescent and adolescent girls.Arch Pediatr Adolesc Med.1999; 153(11):1184 –1189
5. Browne KD, Hamilton-Giachritsis C. The in-fluence of violent media on children and
adolescents: a public-health approach. Lan-cet.2005;365(9460):702–710
6. Donnerstein E. The mass media: a role in injury causation and prevention.Adolesc Med.1995;6(2):271–284
7. Hancox RJ, Milne BJ, Poulton R. Association of television viewing during childhood with poor educational achievement.Arch Pedi-atr Adolesc Med.2005;159(7):614 – 618 8. Gortmaker SL, Must A, Sobol AM, Peterson K,
atr Adolesc Med.1996;150(4):356 –362 9. Fulton JE, Wang X, Yore MM, Carlson SA,
Ga-luska DA, Caspersen CJ. Television viewing, computer use, and BMI among U.S. children and adolescents.J Phys Act Health.2009; 6(suppl 1):S28 –S35
10. Roberts DF, Foehr UG, Rideout V.Generation M: Media in the Lives of 8 –18 Year-Olds.
Menlo Park, CA: Henry J. Kaiser Family Foundation; 2005
11. American Academy of Pediatrics, Commit-tee on Public Education. Children, adoles-cents, and television.Pediatrics. 2001; 107(2):423– 426
12. Lowry R, Lee SM, Fulton JE, Kann L. Healthy People 2010 objectives for physical activity, physical education, and television viewing among adolescents: national trends from the Youth Risk Behavior Surveillance Sys-tem, 1999 –2007.J Phys Act Health.2009; 6(suppl 1):S36 –S45
13. Barradas DT, Fulton JE, Blanck HM, Huhman M. Parental influences on youth television viewing.J Pediatr.2007;151(4):369 –373, 373.e1–373.e4
14. Salmon J, Timperio A, Telford A, Carver A, Crawford D. Association of family environ-ment with children’s television viewing and with low level of physical activity.Obes Res.
2005;13(11):1939 –1951
15. Gentile DA, Walsh DA. A normative study of family media habits.J Appl Dev Psychol.
2002;23(2):157–178
152–163
17. Marshall SJ, Biddle SJ, Gorely T, Cameron N, Murdey I. Relationships between media use, body fatness and physical activity in children and youth: a meta-analysis.Int J Obes Relat Metab Disord. 2004;28(10): 1238 –1246
18. Sallis JF, Prochaska JJ, Taylor WC. A review of correlates of physical activity of children and adolescents. Med Sci Sports Exerc.
2000;32(5):963–975
19. Potter LD, Judkins DR, Piesse A, Nolin MJ, Huhman M. Methodology of the outcome evaluation of the VERB campaign.Am J Prev Med.2008;34(6 suppl):S230 –S240 20. Welk GJ, Wickel E, Peterson M, Heitzler CD,
Fulton JE, Potter LD. Reliability and validity of questions on the youth media campaign longitudinal survey.Med Sci Sports Exerc.
2007;39(4):612– 621
21. Singh GK, Yu SM, Siahpush M, Kogan MD. High levels of physical inactivity and seden-tary behaviors among US immigrant chil-dren and adolescents.Arch Pediatr Adolesc Med.2008;162(8):756 –763
22. Anderson SE, Economos CD, Must A. Active play and screen time in US children aged 4 to 11 years in relation to sociodemographic and weight status characteristics: a nation-ally representative cross-sectional analy-sis.BMC Public Health.2008;8(1):366 23. Salmon J, Ball K, Crawford D, et al. Reducing
sedentary behaviour and increasing
physi-“Switch-Play” intervention.Health Promot Int.2005;20(1):7–17
24. Robinson TN, Killen JD, Kraemer HC, et al. Dance and reducing television viewing to prevent weight gain in African-American girls: the Stanford GEMS pilot study.Ethn Dis.2003;13(1 suppl 1):S65–S77
25. Ball K, Cleland VJ, Timperio AF, Salmon J, Crawford DA. Socioeconomic position and children’s physical activity and sedentary behaviors: longitudinal findings from the CLAN study.J Phys Act Health.2009;6(3): 289 –298
26. Harrison M, Burns CF, McGuinness M, Heslin J, Murphy NM. Influence of a health educa-tion interveneduca-tion on physical activity and screen time in primary school children: “Switch Off—Get Active.”J Sci Med Sport.
2006;9(5):388 –394
27. Hohepa M, Scragg R, Schofield G, Kolt GS, Schaaf D. Associations between after-school physical activity, television use, and parental strategies in a sample of New Zea-land adolescents.J Phys Act Health.2009; 6(3):299 –305
28. Epstein LH, Saelens BE, Myers MD, Vito D. Effects of decreasing sedentary behaviors on activity choice in obese children.Health Psychol.1997;16(2):107–113
DOI: 10.1542/peds.2009-3374 originally published online June 14, 2010;
2010;126;e89
Pediatrics
Marian Huhman
Susan A. Carlson, Janet E. Fulton, Sarah M. Lee, John T. Foley, Carrie Heitzler and
Time
Influence of Limit-Setting and Participation in Physical Activity on Youth Screen
Services
Updated Information &
http://pediatrics.aappublications.org/content/126/1/e89
including high resolution figures, can be found at:
References
http://pediatrics.aappublications.org/content/126/1/e89#BIBL
This article cites 26 articles, 1 of which you can access for free at:
Subspecialty Collections
milestones_sub
http://www.aappublications.org/cgi/collection/growth:development_
Growth/Development Milestones
al_issues_sub
http://www.aappublications.org/cgi/collection/development:behavior
Developmental/Behavioral Pediatrics following collection(s):
This article, along with others on similar topics, appears in the
Permissions & Licensing
http://www.aappublications.org/site/misc/Permissions.xhtml
in its entirety can be found online at:
Information about reproducing this article in parts (figures, tables) or
Reprints
http://www.aappublications.org/site/misc/reprints.xhtml
DOI: 10.1542/peds.2009-3374 originally published online June 14, 2010;
2010;126;e89
Pediatrics
Marian Huhman
Susan A. Carlson, Janet E. Fulton, Sarah M. Lee, John T. Foley, Carrie Heitzler and
http://pediatrics.aappublications.org/content/126/1/e89
located on the World Wide Web at:
The online version of this article, along with updated information and services, is
by the American Academy of Pediatrics. All rights reserved. Print ISSN: 1073-0397.