102 | P a g e
SEISMIC EVALUATION OF 3-DFOUR STOREYED RC
MULTISTOREYED BUILDINGS BY PUSHOVER
ANALYSIS
Shekhappa H
1, Dr.S.S.Dyavanal
2 1PG Student,
2Professor, Dept.of Civil Engg. B.V.B.C.ET. Hubballi, (India)
ABSTRACT
The RC frame structures with infill walls are frequently used in multi-storeyed buildings in recent past. Window
and door openings are inevitable part of the infill walls. The presence of openings in infill walls considerably
reduces the lateral strength and stiffness of RC frames. In the present study three-dimensional four storeyed
reinforced concrete (RC) building models are considered with ten percentage of central opening. Bare frame
and infill frame buildings are modelled considering special moment resisting frame (SMRF) for medium soil
profile under zone III. Unreinforced brick masonry infill and concrete block infill walls are modelled as
pin-jointed single equivalent diagonal strut. Pushover analysis is carried out for user defined hinge properties as
per FEMA 440 guidelines using SAP2000v14.2.0 software.The results of ductility ratio, safety ratio and hinge
status are compared amongst the models
Keywords: Ductility Ratio,Performance Levels, Pushover Analysis,Safety Ratio User Defined
Hinges.
I. INTRODUCTION
In India large numbers of buildings are constructed with brick/or concrete block infill walls. These infill walls
significantly increase the stiffness and strength of the infilled frame [1]. In the current practice, masonry infill
panels are treated as non-structural element during the design of the structure and their strength and stiffness
contributions are ignored [2]. The RC frame action behaviour with masonry infill walls illustrates the truss
action
,
where the infill wall behaves as the diagonal strut and absorbs the lateral load under compression [3]. Several buildings constructed in India andacross the world have the ground storey frames without infill walls leading to soft open ground storey. Thus,
upper floors move almost together as a single block and most of the lateral displacement of the buildings occurs
in the open ground storey to earthquake excitation.
Door and window openings are unavoidable parts of any structure. However, the presence of openings in infill
walls reduces the stiffness and strength of the RC frame [1]. Indian seismic code recommends no provision
103 | P a g e
II. DESCRIPTION OF THE BUILDING MODELS
In the present study three-dimensional four storeyed RC frame buildings are considered. The plan and 3-d view
of the building models are shown in Fig. 1, and Fig. 2. The bottom storey height is 4.2 m, upper storey height is
3.6 m, and bay width in both longitudinal and lateral direction is considered as 5 m. The building is assumed to
be located in zone III. M25 grade of concrete and Fe415 grade of steel are considered. The stress-strain
relationship is used as per IS 456:2000 [6]. The concrete block infill walls are modelled as pin-jointed
equivalent diagonal struts. M3 (Moment), V3 (Shear), PM3 (axial force with moment), and P (Axial force) user
defined hinge properties are assigned at rigid ends of beam, column, and strut elements. The density and
Young‟s modulus of concrete block is 25 kN/m3 and 2500 MPa. Poison‟s ratio of concrete is 0.3. Ten
percentage ofcentral openings are considered and three analytical models are developed as mentioned below,
Model 1 - Building has no walls and the building is modelled as bare frame, however masses of the walls are
considered. Building has no walls in the first storey and unreinforced masonry infill walls in the upper storeys,
with varying central opening, however stiffness and masses of the walls are considered.
Model 2- Building has no walls in the first storey and one full unreinforced masonry infill wall in the upper
storeys, with central opening of 10% of the total area of infill. Stiffness and masses of the walls are considered.
Model 3 - Building has no walls in the first storey and one full concrete infill wall in the upper storeys, with
central opening of 10% of the total area of infill. Stiffness and masses of the walls are considered.
104 | P a g e
Fig: 2 3-D view of building model
III METHODOLOGY
3.1 User Defined Hinges
The definition of user-defined hinge properties requires moment–curvature analysis of beam and column
elements. Similarly load deformation curve is used for strut element. For the problem defined, building
deformation is assumed to take place only due to moment under the action of laterally applied earthquake loads.
Thus user-defined M3 and V3 hinges for beams, PM3 hinges for columns and P hinges for struts are assigned.
The calculated moment-curvature values for beam (M3 and V3), column (PM3), and load deformation curve
values for strut (P) are substituted instead of default hinge values in SAP2000v14.2.0.
3.1.1 Moment Curvature for Beam Section
Following procedure is adopted for the determination of moment–curvature relationship considering unconfined
concrete model given stress-strain block as per IS 456:2000
Fig.3 Stress-Strain block for beam [9]
1. Calculate the neutral axis depth by equating compressive and tensile forces.
105 | P a g e
)
(
002
.
0
0035
.
0
u s y
u
d
x
E
f
x
……… (1)3. Divide the xumax in to equal laminae.
4. For each value of xu get the strain in fibers.
5. Calculate the compressive force in fibers corresponding to neutral axis depth.
6. Then calculate the moment from compressive force and lever arm (C×Z).
7. Now calculate the curvature from equation 2.
(
) = u sx
d
……….. (2)
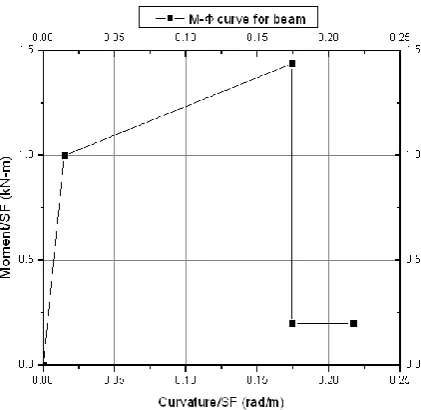
8. Plot moment curvature curve. The curve is shown in Fig.4.
Assumption made in obtaining Moment Curvature Curve for beam and column
[1] The strain is linear across the depth of the section („Plane sections remain plane‟).
[2] The tensile strength of the concrete is ignored.
[3] The concrete spalls off at a strain of 0.0035.
[4] The point „D‟ is usually limited to 20% of the yield strength, and ultimate curvature,u with that.
[5] The point „E‟ defines the maximum deformation capacity and is taken as 15y whichever is greater.
[6] The ultimate strain in the concrete for the column is calculated as 0.0035-0.75 times the strain at the
least compressed edge (IS 456 : 2000) [6]
Fig. 4 Moment curvature curve for beam
3.1.2 Moment Curvature for Column Section
106 | P a g e
Fig.5 Analysis of design strength of a rectangular section under compression
1.0 Calculate the maximum neutral axis depth xumax from equation 3.
)
(
002
.
0
0035
.
0
u s y
u
d
x
E
f
x
……….(3)
2. NA depth is calculated by assuming the neutral axis lies within the section.
3. The value of xu is varied until the value of load (P) tends to zero. At P = 0 kN the value of xu obtained is the
initial depth of NA.
4. Similarly, NA depth is varied until the value of moment tends to zero. At M = 0 kN-m the value of xu
obtained will be the final depth of NA.
5. For the different values of xu, the strain in concrete is calculated by using the similar triangle rule.
6. The curvature values are calculated using equation 4
107 | P a g e
0.00 0.02 0.04 0.06 0.08 0.10 0.12 0.14
0.0 0.2 0.4 0.6 0.8 1.0 1.2 Mo me n t/ SF (kN -m) Curvature/SF (rad/m)
Curve for column
0.00 0.02 0.04 0.06 0.08 0.10 0.12 0.14
0.0 0.2 0.4 0.6 0.8 1.0 1.2
Fig.6 Moment-curvature for column section
3.2 Pushover Analysis
Pushover analysis is a static non-linear procedure in which the magnitude of the lateral load is incrementally
increased maintaining a predefined distribution pattern along the height of the building. With the increase in the
magnitude of loads, weak links and failure modes of the building can be found. Pushover analysis can determine
the behavior of a building, including the ultimate loadand the maximum inelastic deflection. At each step, the
base shear and the roof displacement can be plotted to generate the pushover curve for that structure. Pushover
analysis as per FEMA 440 [11] guide lines is adopted. The models are pushed in a monotonically increasing
order in a particular direction till the collapse of the structure. The models are pushed in a monotonically
increasing order in a particular direction till the collapse of the structure. 4% of height of building [10] as
maximum displacement is taken at roof level and the same is defined in to several steps. The global response of
structure at each displacement level is obtained in terms of the base shear, which is presented by pushover
curve. Pushover curve is a base shear versus roof displacement curve. The peak of this curve represents the
maximum base shear, i.e. maximum load carrying capacity of the structure; the initial stiffness of the structure is
obtained from the tangent at pushover curve at the load level of 10% [12] that of the ultimate load and the
maximum roof displacement of the structure is taken that deflection beyond which the collapse of structure
takes place.
IV. RESULTS AND DISCUSSIONS
4.1
Performance Evaluation of Building Models Performance based seismic evaluation of all the models iscarried out by nonlinear static pushover analysis. User defined hinges are assigned for the seismic designed
building models along the both longitudinal and lateral direction.
4.1.1 Location of Hinges
The location of the hinges for user defined hinges and performance levels along longitudinal direction for all
108 | P a g e
Table: 1 Location of hinges for four storeyed building models
For building models, the base force is found more in infill frame building compare to bare frame building by
33.33% at the ultimate state for brick masonry and 53.32% for concrete block infill. In four storeyed bare frame
building model hinges are formed 85.71% 14.29% between A to B, B to IOrespectively and most of the hinges
are formed in the beams and columns of bottom storey in both X and Y direction at ultimate state. Similarly for
brick infill wall model 99.33%, 6.7% between A to B, B to IO respectively at ultimate state and for concrete
block infill wall 95.78%, 2.44%, 1.77% between A to B, B to IO, IO to LS respectively and most hinges are
formed in the beams andcolumns of bottom storey in both X and Y direction at ultimate state.
4.2 Ductility Ratio
The ratio of collapse yield (CY) to the initial yield (IY) is called as ductility ratio [13]. Ductility ratio (DR) for
building models are tabulated in the table 2.
Table: 2 Ductility Ratios of Building Models
Model
No
Displacement(mm) Base force(kN)
Location of hinges
AtoB BtoIO IOtoLS LStoCP
Total
1
Yield 12.01 1599.59 840 0 0 0 840
Ultimate 60.01 6443.85 720 120 0 0 840
2
Yield 11.42 2984.84 900 0 0 0 900
Ultimate 59.42 9661.13 894 6 0 0 900
3
Yield 5.01 4498.12 898 2 0 0 900
Ultimate 59.01 13806.72 862 22 16 0 900
Model No
Initial yield
Collapse yield
Ductility ratio
1
12.01
60.01
5.00
2
11.42
59.42
5.20
109 | P a g e
For building models, reduced ductility ratio are found in bare frame building compare to brick infill framebuilding by 3.846% and 57.55% for solid concrete block infill. From the above results it can be concluded that,
the solid concrete block buildings are more ductile as compare to the brick infill building.
4.3 Safety Ratio
The ratio of base force to base shear by ESM is defined as safety ratio (SR). The buildings are safe when SR is
equal to one, safer when SR is more than one, and unsafe when SR is less than one [14]
Table: 3 Safety ratios for four storeyed building models
In building models, for brick masonry infill model is found to be 1.16 times safer and for solid concrete block
infill 1.81 times safer compared to the bare frame building model by equivalent static method. Thus the safety
ratios for all building models considered are safe.
V. CONCLUSIONS
Based on the results obtained by analyses for the building models, the following conclusions are drawn,
1. RC framed multi-storeyed buildings must be designed considering methods mentioned in earthquake codes
to reduce vulnerability to earthquake shaking.
2. Flexural hinges are found within the collapse prevention level at the ultimate state and plastic hinges
formation takes place in beams and columns of open ground storey of building model.
3. Ductility ratio for brick masonry infill and for solid concrete block infill are more than the target value
equal to 5 and the solid concrete block buildings are more ductile as compare to the brick infill buildings.
4. The models considered in this paper are safer and ductile.
REFERENCES
[1] C.V.R. Murthy (2002), “What are the Seismic Effects on Structures?” Earthquaketip 05, IITK –BMTPC.
[2] B.G. Prashanta and S.S. Dyavanal (2007), “Performance Based Seismic Evaluation of Multistoried
Buildings with the Openings in U M Infill Walls”, RDSE-2007, ManipalInstitute of Technology,
Manipal. 30 31st August.
[3] G. Mondal and S.K. Jain, “Lateral Stiffness of Masonry Infilled Reinforced Concrete(RC) Frames with
Central Opening”, Earthquake Spectra, Vol 24, No 3, pages701-723, Indian Institute of Technology,
India, 2008.
Model No Base force (kN) Base shear (kN) Scale factor
1 1345.603 996.969 1.35
2 1685.225 1072.733 1.57
110 | P a g e
[4] IS 1893 (Part 1): 2002, “Criteria for Earthquake Resistant Design of Structures”,Bureau of IndianStandards, New Delhi110002.
[5] S.K. Jain, and C.V.R. Murty, Proposed draft provision and commentary on Indian Seismic Code IS 1893
(Part 1), Department of Civil Engineering, Indian Institute of Technology Kanpur.
[6] IS 456:2000, “Code of Practice for Plain and Reinforced Concrete”, Bureau of IndianStandards, New
Delhi, India.
[7] Niranjan C.B, M.V Renukadevi and K.S. Jagadish “Non-linear analysis of infilled frames”, IJRET,
November 2014.
[8] RihanMaaze “Seismic Evaluation of Multistorey Buildings with Soft Storey Assigned with User
Defined Hinges”,M.Tech Thesis, B.V. Bhoomaraddi Collegeof Engineering & Technology, Hubli,
2013.
[9] Pillai and Menon, “Reinforced Concrete Design”, Tata McGraw-Hill Education 2003
[10] Applied Technology Council (1996), “Seismic Evaluation and Retrofit ofConcrete Buildings”, Vol.1&
2, California
[11] Federal Emergency Management Agency, FEMA-440 (2005), “Improvement ofNonlinear Seismic
Analysis Procedures”.California.
[12] FEMA 356, 2000 “Pre-standard and commentary for the seismic rehabilitation of buildings”, ASCE for
the FederalEmergency Management Agency,Washington, D.C.
[13] R. Park and T. Paulay, "Reinforced Concrete Structures," Christ church, New Zealand,Aug, pp.
270-343, 1974.
[14] V.B. Karkatti, “Seismic Evaluation and Retrofitting of Soft Ground RC Multistorey Buildings”, M.Tech
Thesis, B.V. Bhoomaraddi College of Engineering &Technology, Hubli, 2006.
[15] Praveen Rathod, S.S Dyavanal,“Seismic Evaluation of Multistorey RC Building With Openings in
Unreinforced Masonry Infill Walls with User Defined Hinges”, ICMBME, IRAJ Research
Forum,Bengaluru, 5th july 2014.
[16] Praveen Rathod, S.S Dyavanal, “Performance Based Seismic Evaluation of G+9 RC Buildings with
Openings in InfillWalls”, IJARSE, Vol. No.3, Issue No.7, July 2014.
[17] Praveen Rathod, S.S Dyavanal, “Pushover Analysis of Ten Storeyed RC Buildings with Openings in
Infill Walls”, InternationalJournal of Advanced Scientific and Technical Research, IJAST, Issue 4,
Volume4: July-August 2014.
[18] Praveen Rathod, S.S Dyavanal, “Non-Linear Static Analysis of G+3 Storeyed RC buildings with
Openings in Infill walls”, IJERT, Vol. No.3, Issue No.8, August 2014.
[19] Praveen Rathod, S.S Dyavanal, “Pushover Analysis of Seven Storeyed RC buildings with Openings in
Infill walls”, IJETT, Volume 14, Number 3, August 2014.
[20] Praveen Rathod, S.S Dyavanal, “Performance Based Seismic Evaluation ofG+3 RC Buildings with