R E S E A R C H
Open Access
Vision-based detection of container lock
holes using a modified local sliding
window method
Yunfeng Diao
1,2, Wenming Cheng
1,2, Run Du
1,2*, Yaqing Wang
3and Jun Zhang
1,2Abstract
Container yards have been facing the increase of freight volume. In order to improve the efficiency of container handling, automatic stations have been established in many terminals. However, current container handling still needs a manual operation to locate container lock holes. Hence, it is inefficient and potential to risk workers’health under long working hours. This paper presented a hybrid machine vision method to automatically recognize and locate container lock holes. The proposed method extracted the top area of the container from the multiple container areas, and then presented a new modified local sliding window to detect the keyhole region. The algorithm learned the histograms of oriented gradients (HOG) features using a multi-class support vector machine (SVM). Finally, the holes were located using direct least square fitting of ellipses. We carried an experiment under various weather and light conditions including nights and rainy days. The results showed that both the recognition and location accuracy outperformed the state-of-the-art results.
Keywords:Container port, Computer vision, Container lock holes location, Automatic handling
1 Introduction
In the container terminal, the productivity of container handling immensely impacts the whole efficiency of the terminal because container handling operates more fre-quently than other logistics activities. During handling, crane operators need to observe the lock holes and align the spreader with the container with a long working time. Such manual operations are time-consuming and require high technique of operators. Besides, the cab is mounted below the crane girder, thus the driver has to keep his head down to observe the position of the con-tainer for a long time, which would risk operators’safety and health. With the fast growth of container trade vol-umes [1], there is a need for an efficient, safe, and, auto-mated method to handle containers [2].
Over the past decade, many researchers have devoted themselves to improve the productivity of container handling by using laser scanning [3], anti-sway control
[4, 5], and made remarkable achievements. However, these assistant methods mainly solve the problem of the location of the container truck and swing of the spreader respectively, which are difficult to apply to the container lock hole location. In recent years, with the prevalence of cameras in container terminals and the increasing de-velopment in the field of computer vision and machine learning, the automatic container location can be achieved based on vision methods. Li and Lee [6] pro-posed a method for recognizing the container shape and range, which detects the container contour by Hough transform and uses the stereo camera to measure the container depth information. However, detecting straight lines by Hough transform is easily interfered by surface texture and is not robust enough. Chen and Wang [7] proposed a container recognition and location method based on feature matching, which improves the effect-iveness of detecting container’s shape. Yoon and Hwang [8] got information about container position based on stereo vision. However, these methods focus on the whole container, which have problems in recognizing and locating the small and key targets, such as the cor-ner casting and the hole. Shen and Mi [9] extracted the
© The Author(s). 2019Open AccessThis article is distributed under the terms of the Creative Commons Attribution 4.0 International License (http://creativecommons.org/licenses/by/4.0/), which permits unrestricted use, distribution, and reproduction in any medium, provided you give appropriate credit to the original author(s) and the source, provide a link to the Creative Commons license, and indicate if changes were made.
* Correspondence:[email protected]
1
School of Mechanical Engineering, Southwest Jiaotong University, Chengdu, China
2Technology and Equipment of Rail Transit Operation and Maintenance Key Laboratory of Sichuan Province, Chengdu, China
images, which contain only top area or even local regions. Thus, it is difficult to detect the lock holes from container images containing multiple surfaces.
Therefore, we proposed a combination of various ma-chine vision algorithms to solve these challenges. In order to evaluate our method, the testing dataset contained con-tainer miniatures of rusty lock holes in various environ-ments. Experimental results showed that the average accuracies of recognition were all 100% in any conditions. The average accuracies of location were 98.13% at daytime and 90.50% at night respectively, and all outperforms the state-of-the-art results. Additionally, the first proposed rainy experiment which achieved average accuracies of 100% and 95.25% for recognition and location respectively showed that the method was also adaptive to rainy days.
The rest of the paper is organized as follows. Section 2 describes the method framework, including the con-tainer extraction, hole recognition, and hole location. Section 3 gives out the dataset and experimental results and compares them with state-of-art results, then ana-lyzes the causes of error. Section 4 concludes the paper.
2 Methodology
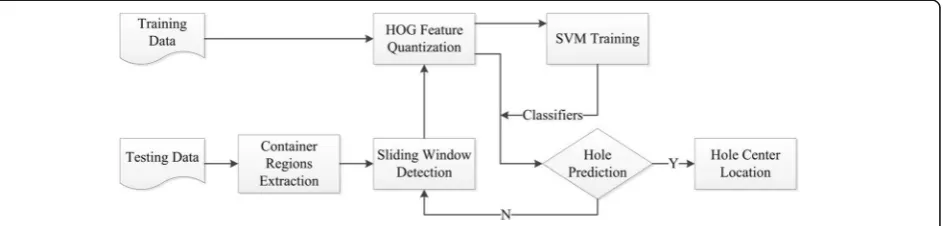
The overall framework of the proposed method is shown in Fig. 1. Firstly, the image is segmented by HSV (hue, saturation, value) color space and k-means clustering al-gorithm, then the container region is clipped from the whole image after affine transformation. Secondly, the fixed-size section of the container region which is clipped with a sliding window is detected by HOG
color difference between the container and background. The RGB color model has many limitations when used for color description, for example, the three channels are highly correlated, and the difference between the two colors cannot be represented by the distance between two points in the color space. In contrast, the HSV color model is less sensitive to the external environment such as light, brightness, and shadow, and is easier to separate the object from the background. Thus, the image is transformed from RGB to HSV, obtaining the images of three channels of H, S, and V respectively.
H¼
60ðG−BÞ=ðV−min Rð ;G;BÞÞ;V ¼R
120þ60ðB−RÞ=ðV−min Rð ;G;BÞÞ;V ¼G
240þ60ðR−GÞ=ðV−min Rð ;G;BÞÞ;V ¼B Hþ360;H <0
8 > > < > > :
S¼ ðV−min Rð ;G;BÞÞ=V;V≠0
0;V¼0
V ¼ max Rð ;G;BÞ
ð1Þ
To facilitate subsequent processing, the R, G, and B channels are normalized to the range [0, 1]; hence, the H, S, and V channels are within the range [0, 1]. According to the experiment results, although the segmented container is completed inHchannel image, there are some noises in the background. InSchannel image, there are few noises, but the separation degree is lower between the object and the background, especially in sunny time or nighttime. Therefore, we combinedHand S to a single channel for images captured in daytime, namedW:
W¼0:3Hþ0:7S ð2Þ
For images captured at night, the value ofW is equal to theSchannel. Because the obtainedWchannel image still contains a little noise, we used median filtering for smoothing image. Then, we segmented the container and the background by binarization, and the global
opti-mal thresholdTwas selected by Otsu method [11]. The
segmented image valueg(x,y)was calculated in Formula 3, wheref(x,y)represented the value ofWchannel.
g xð ;yÞ ¼ 1; f xð ;yÞ>T
0 f xð ;yÞ≤T
ð3Þ
After binarization, we used morphological processing [12] to eliminate the interfering points in the background and small holes in the object and to fill gaps in the contour.
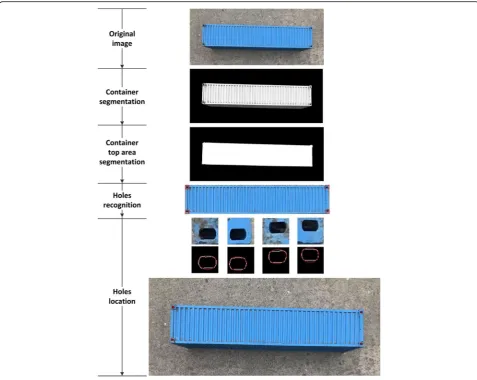
2.1.2 Container top area segmentation
When taking pictures, the shapes of the container de-pend on the position and viewing angle of the camera. According to the actual shooting situation, there are two types of container in an image. One includes the top and side surfaces, and the other only has the top surface.
The top surface needs to be extracted from the con-tainer for images containing two surfaces since the lock holes in the top surface are identified for locating. For images taken at daytime, the k-means algorithm [13] is used to separate container top area by clustering the brightness value, because the brightness is largely differ-ent between the light-receiving surfaces and the less-light-receiving surfaces. The clustering metric used Eu-clidean distance. Firstly, the value ofg(x,y)was replaced with Formula (4).
g2ðx;yÞ ¼ fυðx;yÞ;g ðx;yÞ ¼1
0;g ðx;yÞ ¼0
(
ate the interfering points that cannot be eliminated in Section 3.1.1. For images taken at night, only the top sur-face illuminated by light has a high brightness. Therefore, the Ostu method can replace the k-means algorithm to binarize theg2(x,y) to obtain a complete top surface.
In order to extract the contour of the container top area, the image after segmentation was processed by Canny edge detector [14].
2.1.3 Angle detection and position correction
The location of the camera installation and container placement errors may change the angle of the container in the image. In order to correct the inclined errors of the container, it is necessary to perform angle detection and position correction on the container. The correction was obtained by solving the minimum area bounding rectangle of an enclosing contour. The algorithm principle and cal-culation steps were as follows:
(1) The convex hull of the contour was found. The number of the points on the convex hull was usually between 10 and 14.
(2) The endpoints of the convex hull in thexdirection were denoted asXmin andXmax, and the endpoints in the y directions were denoted asYmin andYmax. The four points were connected to form an initial rectangular area, as the current minimum value. (3) The rectangle rotates clockwise until one of its
sides (side A) coincides with one edge of the convex hull. Then, the convex point of the farthest distance from the side and the leftmost and rightmost points in the direction of the side projection were found. Finally, a new rotated rectangle was generated, which enveloped these three points and one of its sides coinciding with side A.
(4) Calculate the new rectangular area and compare it with the current minimum value. If it was less than the current minimum value, the new rectangle was recorded as the smallest rectangle. If it was greater than or equal to the current minimum value, the original minimum rectangle was retained.
(5) Repeat steps (3), (4) until the angle of rotation was greater than 90°.
traction [15] can clearly describe the shape features around the lock holes and is robust to illumination information. Then, the HOG can be used in detecting the lock holes.
2.2.2 Learning features and classification
To learn and predict container features, a multiclass one-against-one SVM classifier was used [16]. The SVM is based on error-correcting output codes (ECOC) multi-class model [17]. It is more accurate than one-against-all SVM and faster than the ordinary one-against-one SVM. When setting up the data set, we chose to clip a 50 × 50 pixel slices from the M2 × 425 pixel container top images as the training images. Where M2 is the width, 425 is the height, and the size of M2 may vary depending on the size of the container and the effect of the segmentation. The lock holes can just fill the entire slice under such size. The data was divided into eight types, including“hole,” “ back-ground,” “half hole in vertical,” “incomplete hole at left edge,” “incomplete hole at right edge,” “incomplete hole at upper edge,” “incomplete hole at lower edge,” “container.” Figure3shows examples of the data types.
2.2.3 Local sliding window recognition of lock holes
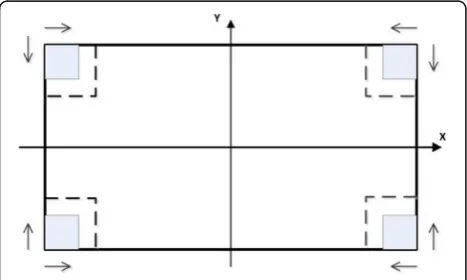
After obtaining the trained model, a sliding window method was proposed to recognize the lock holes. In this paper, the traditional window sliding technology was improved so that the window only slid in the four corner areas of the image; thus, the times of window sliding was reduced. To ensure that the proportion of the lock holes in the sliding window was consistent with the data set, we scaled the container top image to M2 × 425 pixels by following Formula (5):
l¼N=425
M2¼ML
ð5Þ
where Lis a scaling factor, and M and Nare the width
and height of the image. The four corner areas of the image were named as the block to slide the window within
the block (Fig. 4). The block size was set to W1×W2
(1) At the corner point of the image, a 50 × 50 pixel sliding window was defined as the initial window. (2) The HOG feature of the window was detected
using the classification model, and if the prediction result was“hole,”go to step (4); if the prediction result was“incomplete hole at upper/lower edge,” stop sliding and go to step (3); if the prediction result was another classification result, slide the windowk1pixels to theX-axis to predict again, until the window was outside the range of the block, then stop sliding and go to step (3). (3) The sliding window first returned to the initial
position of step (2). After sliding the windowk2 pixels to theY-axis, the prediction was continued to step (2). If the prediction result was“hole,”go to step (4). If the sliding window was outside the range of the block, stop sliding.
(4) Finally, the sliding windows, which were predicted as the“hole,”were clipped from the top area image.
Based on this method, the holes figure can be clipped from the container top image.
2.3 The location of the lock holes
To get the exact position of the lock holes, we need to de-tect the edge of the holes and find the contour center. After being converted to a grayscale image and getting the edges by using the Canny algorithm, the hole edge features were detected as follows. Firstly, the maximum area of all enclos-ing contours was found. If the maximum area was larger than 1/4 of the image area, only the maximum contour is retained; otherwise, if the edge of the lock holes was not closed, the only unclosed contour with the largest perimeter was found and retained. In the end, the only remaining edge in the image was the contour of the lock holes.
Then, the least squares method was used to fit ellipses on the contour of the lock holes and the center of the holes on the sliding window were positioned. Finally, the center coordinates of four lock holes in the original image were calculated via Formula (6):
xð Þhi;yð Þhi
¼ xð Þhi2;yð Þhi2
þ xð Þsi;yð Þsi
þðxr;yrÞ;i¼1;2;3;4
x0hð Þi;y
0ð Þi
h ;1
T
¼R xð Þhi;y i
ð Þ
h ;1
T
8 < :
ð6Þ WherexðhiÞ;yðhiÞis the coordinate of the center of the lock hole i in the image after transformation. xðh2iÞ;yðh2iÞ is the center of the lock hole coordinates within a clipped win-dow. xðsiÞ;yðsiÞ is the upper left corner coordinate of a clipped window within the container top area image. (xr, yr) is the upper left corner coordinate of the container top area in the original image. R is the rotation matrix with the rotation angleθ. Finally xh0ðiÞ;y0hðiÞ is the coordinate of holes center in the original image.
3 Experiments
3.1 Preparation for experiments
We validated the proposed method using two kinds of container miniatures, whose sizes were 1/15 of the real 20 ft container and 40 ft container (In the following Fig. 3Examples of data types
The training dataset was divided into eight types, and the classification is detailed in Section 3.2.2.
After training, the testing dataset was randomly col-lected 1600 images. The testing dataset accounted for the variability in the form and size of the container, dif-ferent position of a container placed, difdif-ferent lighting, and weather conditions. The setting of the testing data-set was as follows.
(1) The testing dataset was divided into four groups according to weather and lighting conditions, i.e., sunny, cloudy, rainy, and night. Each group was divided into two small groups according to the size of the container, i.e., 20 ft container, 40 ft container; each small group contains 200 images.
(2) The test used four 20 ft, eight 40 ft container mini-atures. In the lock holes area of the four 20 ft container miniatures, one feature is completed, two are slightly rusted and the paint is fading, and one is severely rusted and the paint faded. In the lock holes area of eight 40 ft container miniatures, two features are completed, four are slightly rusted and the paint faded, and two are se-verely rusted and the paint faded. To ensure the consistency across of each set of the testing dataset, we randomly assigned the number of each container mini-ature in a set of the testing dataset.
(3) The direction and location of the taken containers were random to simulate the error when the containers were placed in the station.
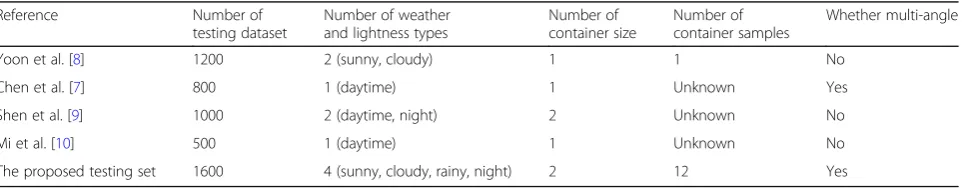
As can be seen in Table1, there are four related refer-ences about the containers recognition and location:
ref-erences [7, 8] mainly focused on container shape
recognition and location, and [9, 10] mainly focused on lock holes recognition and location. Compared with the
set to 75 and the step of sliding k1, k2were all set to 4. We assessed the detection performance by calculating the accuracy of 1600 samples. For recognition, it is a correct prediction if all the holes in an image are recog-nized correctly. The formula of accuracy is as follows:
accuracy¼correct predictions
all predictions ð7Þ
For locating, a correct prediction is defined by the fol-lowing formula:
prediction¼ 1;jerrorυj<1and errorj hj<1pixel
0;jerrorυj>1or errorj hj>1pixel
ð8Þ
Whereerrorυanderrorhare the vertical and horizontal error of the hole center between algorithm locating and manual locating respectively. It is a correct prediction if the prediction equals 1. The formula of location accur-acy is also defined via formula (7).
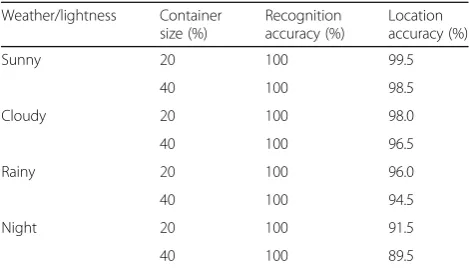
Table 2 shows the results of the experiments. In the daytime (sunny, cloudy), the average location accuracy is 98.13%, 95.25% in rainy days, and 90.50% at nights. The average recognition accuracy is 100%. The 40 ft con-tainer location accuracy is slightly lower than the 20 ft container, because the rust and damage of the 40 ft con-tainer keyhole surface are more serious than the 20 ft container, which makes it difficult to locate the 40 ft container lock holes.
The proposed method was compared with the two closely related references. Shen et al. [9] mainly focused on lock holes location, while Mi et al. [10] mainly fo-cused on lock holes recognition. They all defined the
Table 1Comparison with other datasets
Reference Number of
testing dataset
Number of weather and lightness types
Number of container size
Number of container samples
Whether multi-angle
Yoon et al. [8] 1200 2 (sunny, cloudy) 1 1 No
Chen et al. [7] 800 1 (daytime) 1 Unknown Yes
Shen et al. [9] 1000 2 (daytime, night) 2 Unknown No
Mi et al. [10] 500 1 (daytime) 1 Unknown No
accuracy of the single lock hole (There were more than one hole in an image.). Thus, we used the same defin-ition to record the experiment results. As shown in
Table 3, the recognition and location accuracy in the
daytime is close to 100%, at night the location accuracy is 4.2% higher than Shen’s. The improvement of accur-acy is obvious.
4 Discussion
The study presented a comprehensive container dataset for container lock holes recognition and location. It also pre-sents a new hybrid method that can automatically locate lock holes from an image of a complete container, which is taken from various viewpoints. In contrast with the other related studies’performance, the presented method shows the robustness to the rusty keyholes and changes of illu-mination as well as weather. Though the proposed method outperforms the state-of-the-art method, there is still room for improvement:
Rust contour is connected with the edge of the lock holes during edge detection: when the lightness is bright (sunny, cloudy), most of the edge in images can be clearly detected, but the rust around the holes is easy to be connected with the contour of the hole, interfering with the shape of holes. To solve this problem, increasing the threshold of edge detection may be considered so that fewer pixels are preserved.
Incomplete lock holes feature in edge detection: because of the weather conditions or rust around the holes, the hole contour may be broken or lose during edge detection. The only remaining contour can be incomplete hole edges, or even other features, such as corners. It is more likely to occur at night or on rainy days. In the rain, the detected edges are prone to breakage because of the accumulation of rainwater on the edge of the lock holes. At night, with the low illumination, the taken container features are not clear enough, hence to make the hole features easily miss. Besides, the brightness of the light during the night experiment is lower than the actual station. An enhancement in brightness or test in an actual environment will further improve the accuracy.
5 Conclusions
This paper presented a hybrid machine vision method for container lock holes recognition and location. The proposed approach is applicable to different placement angles and size of the container; it is also robust to rust around holes. The experiment results in recognition and location accuracy dur-ing the daytime are 100% and 98.13% respectively, which are higher than previous methods. In addition, the location ac-curacies in rainy days and night are 95.25% and 90.50% re-spectively, and the recognition accuracies are all 100%, which proves that the method is feasible under special wea-ther and light conditions. The solution of several research challenges, such as the detecting holes from multiple con-tainer surfaces, the variations of concon-tainer angle, the low lighting conditions, and the special weather conditions, makes the method suitable for actual container terminals.
Abbreviations
HOG:Histograms of oriented gradients; SVM: Support vector machine; HSV: Hue, saturation, value; ECOC: Error-correcting output codes
Acknowledgements
Thanks for the editors and reviewers. The authors gratelfully acknowledge financial support from China Scholarship Council.
Authors’contributions
YD contributed to the algorithm, analyzed the data, and wrote the manuscript. RD contributed to the algorithm improvement and revised the manuscript. WC contributed to the experiment platforms. YW polished the manuscript. JZ contributed to the data collection. All authors read and approved the final manuscript.
Authors’information
Yunfeng Diao is currently working towards the Ph.D. degree in the Department of Engineer Machinery, Southwest Jiaotong University, China. His current research interest includes construction safety monitoring, human action recognition, and automatic container handling.
Wenming Cheng is a Professor and Head of Department of Engineer Machinery at Southwest Jiaotong University, China. His research interests include logistics equipment, industrial engineering, and intelligent optimization and simulation. He has published over 80 journals in China and abroad. He has received 3 national awards and more than 10 provincial awards in China. Run Du received the B.Sc. and Ph.D. degrees in mechanical engineering from Southwest Jiaotong University, Chengdu, China in 2003 and 2010. He is currently an assistant professor at Southwest Jiaotong
Table 2Experimental results
Weather/lightness Container size (%) Recognition accuracy (%) Location accuracy (%)
Sunny 20 100 99.5
40 100 98.5
Cloudy 20 100 98.0
40 100 96.5
Rainy 20 100 96.0
40 100 94.5
Night 20 100 91.5
40 100 89.5
Table 3Comparison with other results
Weather/lightness Reference Lock holes recognition accuracy
Lock holes location accuracy
Daytime Shen et al. [9] \ 96.4%
Mi et al. [10] 97.6% \
The proposed method 100% 99.53%
Night Shen et al. [9] \ 93.4%
Author details
1School of Mechanical Engineering, Southwest Jiaotong University, Chengdu, China.2Technology and Equipment of Rail Transit Operation and
Maintenance Key Laboratory of Sichuan Province, Chengdu, China.3TStone Robotics Institute, The Chinese University of Hong Kong, Hong Kong SAR, China.
Received: 21 March 2019 Accepted: 16 June 2019
References
1. UTCAD, Review of Maritime Transport 2017. United Nation (2017) 2. J. He, Y. Huang, W. Yan, Yard crane scheduling in a container terminal for
the trade-off between efficiency and energy consumption. Adv. Eng. Inform.
29, 59–75 (2015)
3. J.-t. Wang, T. Kong, J. Li, J.-g. Pan, Container alignment based on laser measurement and camera calibration. J. Syst. Simul. (China)21, 4873–4878 (2009) 4. Q.H. Ngo, N.P. Nguyen, C.N. Nguyen, T.H. Tran, K.S. Hong, Fuzzy sliding mode
control of container cranes. Int. J. Control. Autom. Syst.13, 419–425 (2015) 5. Q.H. Ngo, K.S. Hong, Sliding-mode antisway control of an offshore container
crane. IEEE-ASME. Trans. Mechatron.17, 201–209 (2012)
6. L. Wei, L. Eung-Joo, Real-time container shape and range recognition for implementation of container auto-landing system. J. Korea. Multimed. Soc.
12, 794–803 (2009)
7. N. Chen, S. Wang, Z. Huang, Container recognition and location technology based on feature matching. J. Graph.37, 530–536 (2016)
8. H.-J. Yoon, Y.-C. Hwang, E.-Y. Cha,Ieee, Real-time container position estimation method using stereo vision for container auto-landing system. International Conference on Control, Automation and Systems (Iccas 2010)
(2010), pp. 872–876
9. Y. Shen, W. Mi, Z. Zhang, A positioning lockholes of container corner castings method based on image recognition. Polish. Marit. Res.24, 95–101 (2017) 10. C. Mi, Z. Zhang, Y. Huang, Y. Shen, A fast automated vision system for container
corner casting recognition. J. Mar. Sci. Technology-Taiwan.24, 54–60 (2016) 11. N. Otsu, A threshold selection method from gray-level histograms. IEEE.
Trans. Syst. Man. Cybern. SMC.9, 62–66 (1979)
12. P. Soille, Morphological image analysis: principles and applications. Springer-Verlag (2003)
13. J. Macqueen, Some methods for classification and analysis of multivariate observations, Proc. of Berkeley Symposium on Mathematical Statistics and Probability1966, pp. 281-297
14. J. Canny, A computational approach to edge detection. IEEE. Trans. Pattern. Anal. Mach. Intell.8, 679–698 (1986)
15. N. Dalal, B. Triggs, in2005 IEEE Computer Society Conference on Computer Vision and Pattern Recognition, Vol 1, Proceedings, Ieee Computer Soc, Los
Alamitos, ed. by C. Schmid, S. Soatto, C. Tomasi. Histograms of oriented
gradients for human detection (2005), pp. 886–893
16. C.W. Hsu, C.J. Lin, A comparison of methods for multiclass support vector machines. Ieee. Trans. Neural. Netw.13, 415–425 (2002)
17. S. Escalera, O. Pujol, P. Radeva, On the decoding process in ternary error-correcting output codes. IEEE. Trans. Pattern. Anal. Mach. Intell.32, 120–134 (2010)
6 Publisher’s Note