DOI 10.1007/s13173-013-0106-x O R I G I NA L PA P E R
A strategy for preparing software organizations for statistical
process control
Monalessa Perini Barcellos · Ricardo de Almeida Falbo · Ana Regina Rocha
Received: 17 May 2012 / Accepted: 4 March 2013 / Published online: 12 April 2013 © The Brazilian Computer Society 2013
Abstract Software organizations have increased their inter-est in software process improvement (SPI). Nowadays, there are several frameworks that support SPI implementation. Some of them, such as CMMI (Capability Maturity Model Integration), propose to implement SPI in levels. At high maturity levels, such as CMMI levels 4 and 5, SPI involves carrying out statistical process control (SPC), which requires measures and data suitable for this context. However, mea-surement problems have been pointed in the literature as one of the main obstacles for a successful implementation of SPC in SPI efforts. With this scenario in mind, we developed a strategy to help software organizations prepare themselves regarding measurement aspects in order to implement SPC. The strategy is made up of three components: a Reference Software Measurement Ontology, an Instrument for Evalu-ating the Suitability of a Measurement Repository for SPC, and a Body of Recommendations for Software Measurement Suitable for SPC. In this paper we present the strategy as a whole and describe each one of its components.
Keywords Software measurement·Statistical process control·High maturity·Software measurement ontology
M. P. Barcellos (
B
)·R. de Almeida Falbo Department of Computer Science,Federal University of Espírito Santo, Vitória, ES, Brazil e-mail: [email protected]
R. de Almeida Falbo e-mail: [email protected] A. R. Rocha
COPPE-Federal University of Rio de Janeiro, Rio de Janeiro, RJ, Brazil
e-mail: [email protected]
1 Introduction
Statistical process control (SPC) was originally developed in the manufacturing area, aiming to support improvement programs. In the context of software organizations, the use of SPC can be considered recent, so there are still many doubts about it [1,2]. Real cases of SPC implementation in software organizations have revealed a picture characterized by prob-lems and situations that affect the successful implementation of SPC. The unsuitability of the defined measures and col-lected data is one of the main problems [3]. It delays SPC implementation because the measures should be firstly cor-rected and then to only apply SPC techniques.
At high maturity levels, such as CMMI (Capability Matu-rity Model Integration) [4] levels 4 and 5, or MR MPS.BR (Reference Model for Brazilian Software Process Improve-ment) [5] levels A and B, SPC occurs after a measurement program has been institutionalized (a requirement of CMMI level 2 and MPS.BR level F). As a result of the measurement program, measures and data are stored in an organizational measurement repository [6]. It is expected that these mea-sures and data are suitable to be used in SPC. However, as it was said before, usually this is not the case.
Considering that, we defined a strategy to support organi-zations that desire to achieve high maturity levels to obtain and maintain measurement repositories suitable for SPC as well as to perform measurements appropriately for this con-text. The strategy has three components: a Reference Soft-ware Measurement Ontology (RSMO), an Instrument for Evaluating the Suitability of a Measurement Repository for SPC (IESMR), and a Body of Recommendations for Soft-ware Measurement Suitable for SPC (BRSM).
negatively influence SPC implementation. Based on these factors, we defined a set of requirements for a measure to be used in SPC. These requirements, in turn, were arranged in the form of checklists that comprise the Instrument for Evaluating the Suitability of a Measurement Repository for SPC (IESMR). The IESMR includes checklists for evaluat-ing four items related to measurement: the measurement plan, the measurement repository structure, the measures defined, and the data collected for the measures. The IESMR provides procedures for evaluating each requirement and the possible corrective actions to be taken when a requirement is not sat-isfied.
When we were defining the IESMR, we identified the need for establishing a common conceptualization regard-ing the software measurement domain that includes also aspects related to measurement in high maturity organi-zations. This need gave rise to the Reference Software Measurement Ontology (RSMO). The RSMO is a domain reference ontology grounded in the Unified Foundational Ontology (UFO) [7,8]. It was developed following the Systematic Approach for Building Ontologies (SABiO) [9], which prescribes an ontology development process compris-ing activities for purpose identification, ontology capture, ontology formalization, integration with existing ontolo-gies, ontology evaluation, and ontology documentation. The RSMO was developed with the purpose of providing a com-mon vocabulary and relevant knowledge about the software measurement domain, including traditional and high matu-rity measurement aspects. As for ontology capture, RSMO is based on several standards (such as CMMI [4], ISO/IEC 15939 [10], PSM [11], and IEEE Std. 1061 [12]), and on high maturity software measurement aspects. Several axioms were defined and formalized in first-order logics, describ-ing constraints in the software measurement domain. Since the software measurement domain is strongly related to the domains of software processes and organizations, RSMO reuses part of the conceptualization described in a software process ontology [8] and a software organization ontology [13]. Finally, ontology evaluation was done by means of ver-ification and validation (V&V) activities. For verifying the ontology, we checked if the concepts, relations and axioms were able to satisfy the ontology requirements. For validating the ontology, we instantiated the RSMO’s elements with real entities extracted from measurement repositories of organi-zations, in order to verify if the ontology was able to represent concrete situations of the real world.
Finally, to complement our strategy, we defined a practi-cal guide to organizations to perform software measurement suitable for SPC: the Body of Recommendations for Software Measurement Suitable for SPC (BRSM). The BRSM is com-posed by recommendations related to eighteen aspects orga-nized in five groups, namely: (i) recommendations related to software measurement preparation, (ii) recommendations
related to the alignment between software measurement and organizational goals, (iii)recommendations related to the definition of software measures, (iv) recommenda-tions related to the execution of software measurement, and (v) recommendations related to software measurement analysis.
There are two main scenarios in which software organiza-tions that are interested in using SPC can apply the strategy presented in this paper. In the first one, an organization that has already a measurement repository can use the IESMR component in order to evaluate and adapt, when possible, their measurement repositories for SPC. In the second sce-nario, an organization that is starting to implement an SPI program can use the knowledge provided by the RSMO and the recommendations provided by the BRSM for building a measurement repository, elaborating a Measurement Plan and carrying out measurements suitable for SPC.
The purpose of this paper is to present the strategy as a whole. In this sense, details of each component are not presented in this paper. Contrariwise, here we present only the most important information regarding the strategy, taking the perspective of software quality practitioners into account. Thus, regarding the RSMO, we present the conceptual mod-els and the definitions of the terms adopted. Axioms and tables exemplifying how we performed ontology V&V are presented only to illustrate how we performed the corre-sponding activities. A discussion on the fact that RSMO be grounded in UFO is out of the scope of this paper. For more detailed information about these aspects, the reader should see [14–18]. With respect to the IESMR, we present the four checklists developed, along with instructions about how to apply them. Suggested actions for suitability are only illus-trated. Details regarding the IESMR can be found in [19]. Finally, concerning the BRSM, we enumerate each aspect addressed in each one of the groups before mentioned, and we present some recommendations as examples. Also, we briefly discuss how we preliminarily evaluated the BRSM.
Since the strategy is very extensive, we have published fragments of its components in [14–19]. However, the strat-egy as a whole has not been published yet, as well as infor-mation regarding the BRSM. Also, in this paper we include parts of the RSMO not shown in previous publications and we present RSMO under a different point of view, focusing on the domain rather than on ontological aspects, as we did in previous publications [14–18].
2 Software measurement and statistical process control
There are several standards and models that support software process improvement (SPI), such as ISO/IEC 12207 [20], ISO/IEC 15504 [21], CMMI [4], and MR MPS.BR [5], and almost all of them include software measurement as an essen-tial process for organizations to achieve maturity in software development.
For performing software measurement, initially, an orga-nization must plan it. Based on its goals, the orgaorga-nization has to define which entities (processes, projects, products and so on) to consider for software measurement and which of their properties (size, cost, time, etc.) are to be measured. The organization has also to define which measures are to be used to quantify those elements. Measures can be base measures, i.e., measures that are functionally independent of other measures, or derived measures, which are defined as a function of other measures. For each measure, an operational definition should be specified, indicating, among others, how the measure must be collected and analyzed. Once planned, measurement can start. Measurement execution involves col-lecting data for the defined measures according to their oper-ational definitions. Once data are collected, they should be analyzed, also following the guidelines established by the corresponding operational definitions. Finally, the measure-ment process and its products should be evaluated in order to identify potential improvements [16,17].
Depending on the organization’s maturity level, software measurement is performed in different ways. At initial levels, traditional measurement consists basically in collecting data from projects and comparing them with their correspond-ing planned values. At high maturity levels, traditional mea-surement is not enough. It is necessary to carry out statis-tical process control in order to know the processes behav-ior, determine their performance in previous executions, and predict their performance in current and future projects; ver-ifying if they are able to achieve the established goals [4,22]. The SPC uses a set of statistical techniques to determine if a process is under control, considering the statistical point of view. A process is under control if its behavior is stable, i.e., if their variations are within the expected limits, calcu-lated from historical data [22]. The behavior of a process is described by data collected for performance measures defined by this process.
A process under control is a stable process and, as such, has repeatable behavior [22]. So, it is possible to predict its performance in future executions and, thus, to prepare achiev-able plans and to improve the process continuously. On the other hand, a process that varies beyond the expected limits is an unstable process [22] and the causes of these variations (said special causes) must be investigated and addressed by improvement actions, in order to stabilize the process. Once the processes are stable, their levels of variation can be
estab-lished and sustained, it being possible to predict their results. Thus, it is also possible to identify the processes that are capa-ble of achieving the established goals and the processes that are failing in meeting the goals. In this case, actions to change the process in order to make it capable should be carried out [22]. Stabilizing their critical processes is a characteristic of high maturity organizations or organizations that are looking forward to achieve the highest maturity levels.
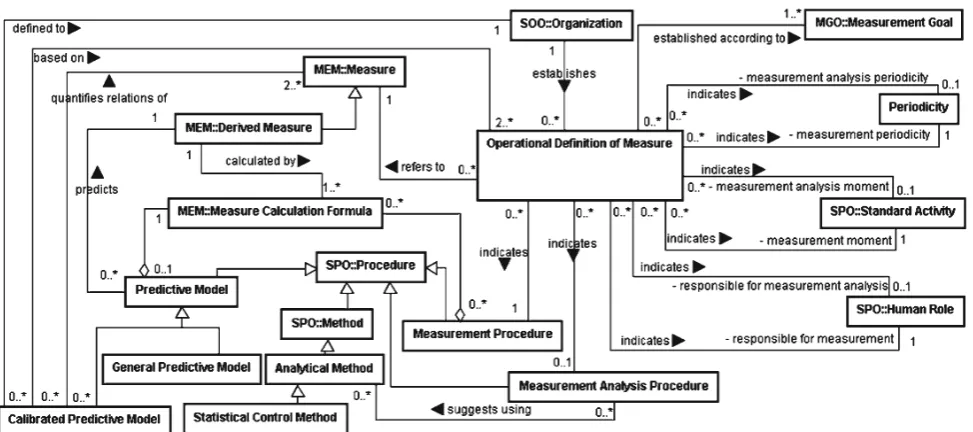
Figure1summarizes the process behavior analysis using SPC principles. First, it is necessary to understand the organi-zational business goals. Next, the processes related to busi-ness goals are identified and the measures used to provide quantitative information about their performance are iden-tified. Data for the measures are collected, checked, stored and used for analyzing the processes behavior using statis-tical techniques. If a process is unstable, the special causes should be removed. If it is incapable, it should be changed. Finally, if it is capable, it can be improved continuously.
3 Software measurement related factors that impact on SPC: a literature systematic review
As said before, measurement problems have been pointed in the literature as one of the main obstacles for a successful implementation of SPC in SPI efforts. Aiming at systemat-ically analyzing the influence of software measurement on SPC implementation, we carried out a study based on a sys-tematic review of the literature. The purpose of this study was to identify and analyze: (i)software measurement related factors that positively influence SPC implementation, and(ii) software measurement related factors that negatively influ-ence SPC implementation.
The study was performed following the process defined by the Software Quality Group from the Federal University of Rio de Janeiro [23] based on [24]. The process is made up of three steps:
Fig. 1 Process behavior analysis (adapted from [22])
(ii) Perform Research:In this step the researcher performs the research according to the defined protocol. Publi-cations are selected, and data are extracted, stored, and quantitatively and qualitatively analyzed.
(iii) Provide Results: In this step the research results pro-duced during the execution of the systematic review process are packaged and should be published.
The research protocol defined in this study contains the following information: objective, research questions, electronic source selection criteria, publication inclusion/ exclusion criteria, data extraction and storage procedure, analysis procedure, and protocol test procedure.
It is worthwhile to point out that the purpose of this paper is to present our strategy for preparing software organizations to implement SPC. Thus, detailed information regarding the literature systematic review performed to elicit the require-ments for the strategy is out of the scope of this paper. In this section we only present the procedure for selecting publica-tions used and the final results of the study. For more details, see [25].
The procedure for selecting publications was performed in three steps. The first one, calledS1-Preliminary Selection and Cataloging, selected publications by applying the following criteria using the digital library search:
Date: from 1990, January 1st Language: English
Search string: ((“statistical process control”) AND (“measurement” OR “measures” OR “metrics”) AND (“problems” OR “questions” OR “factors” OR “require-ments” OR “characteristics” OR “needs” OR “diffi-culties” OR “guidelines” OR “strategies” OR “strat-egy” OR “lessons learned” OR “best practices”) AND (“software”)).
Areas: Computer Science and Engineering
The electronic sources searched were: Compendex, Sco-pus, IEEE, and Science Direct (limited to the Journal of Sys-tems and Software, the Journal of System Architecture, and the Information and Software Technology).
Since a search using an expression is limited to syntactic aspects, it is probable that some selected publications do not contain relevant information to the study. For that reason, a second step (calledS2—Relevant Publications Selection—-First Filter), composed by criteria regarding the publication abstract, was applied to the publications selected in the first step, in order to identify that ones whose abstracts showed signs that the publication addresses the research questions. In S2, the abstract of each publication selected in S1 was analyzed and the publications that did not satisfy one or both the following criteria were eliminated:
C2. The publication presents useful information in the con-text of measurement or SPC for software processes.
Aiming to avoid premature exclusions of publications, we did not eliminate any publication in case of doubt. Also, publications without an abstract were not eliminated.
Considering that in the second step only the publication abstract was read, it is still possible that useless publications have been selected. Then, the last step (calledS3—Relevant Publications Selection—Second Filter), composed by crite-ria regarding the publication content, was performed to select among the publications selected in S2, those ones that answer the study research questions. In S3, the full text of publica-tions selected in S2 was read and the publicapublica-tions that did not satisfy one or both the following criteria were eliminated:
C3. The publication provides information concerning fac-tors related to software measurement that influence SPC implementation (for example, measurement problems or good practices).
C4. The full text of the publication is available.
Then 212 publications were selected in the first step, 87 in the second, and 30 in the third. As a result, we obtained a list of measurement related factors that positively influence SPC implementation and a list of measurement related factors that negatively influence SPC implementation. These lists are presented in Tables1and2, respectively.
It is important to notice that several factors identified in the study are not related to measurement at high maturity levels, but to measurement in general (e.g., N11, N15, and N20, among others). It means that several problems related to measurement at high maturity levels usually have an origin at initial levels. Since the impacts of some problems are stronger in the context of SPC than in traditional measurement, they are only recognized when organizations start the practices to implement SPC. For instance, regarding N20, incorrect data must be removed from the group of values being analyzed for a measure. Since software process behavior analysis using SPC considers chronological aspects, when sequential data are removed from the data group being plotted in a control chart, it is possible that the process behavior obtained is dif-ferent from the actual process behavior. In other words, the behavior analysis can be compromised.
The knowledge obtained from the study was used to help us in the definition of our strategy. The strategy and its com-ponents are presented in the next section.
4 A strategy for preparing software organizations for SPC
The strategy developed in this work is made up of three components: theReference Software Measurement Ontology
(RSMO),which provides a common vocabulary and relevant knowledge about the software measurement domain, includ-ing traditional and high maturity measurement aspects; the Instrument for Evaluating the Suitability of a Measurement Repository for SPC (IESMR), which is used to evaluate exist-ing measurement repositories and to determine their suitabil-ity for SPC, identifying corrective actions that can be taken as a means to obtain measurement repositories suitable for SPC (if it is necessary and possible); and theBody of Recommen-dations for Software Measurement Suitable for SPC (BRSM), which provides guidelines on how to prepare a measurement program, to define measures and to perform measurements suitable for SPC.
Software organizations that are interested in using SPC are generally in one of two scenarios. In the first one, there are organizations that have achieved the initial maturity levels and wish to use the measures and data collected along those levels in SPC. In the second one, there are organizations that are starting a SPI program and intend, since the initial levels, to build a measurement repository and perform measurement suitable for SPC. The strategy proposed can be used in both scenarios.
Organizations that have already a measurement reposi-tory can use, as a reactive approach, the IESMR component in order to evaluate and adapt, when possible, their measure-ment repositories for SPC. On the other hand, as a pro-active approach, organizations that are starting SPI programs can use the knowledge provided by the RSMO and the recom-mendations provided by the BRSM for building a measure-ment repository, elaborating a Measuremeasure-ment Plan and carry-ing out measurements suitable for SPC.
Since an organization starts SPC, new data will be col-lected and, probably, new measures will be defined. There-fore, the strategy can be used continuously, aiming to main-tain the suitability of the measurement repository for SPC. In other words, organizations can continuously use the RSMO and the BRSM as sources of knowledge for defining new measures and carrying out measurements, and they can also use the IESMR as a support for evaluating the measurement repository, when it is changed. In the following, the compo-nents of the strategy are presented.
4.1 The reference software measurement ontology
Table 1 Measurement related factors that positively influence
SPC implementation P1. Centralized data storage P2. Automatic data collection
P3. Definition of criteria for grouping data that considers the projects characteristics P4. Existence and integrated use of process and product measures
P5. Existence of measures able to support decision making P6. Identification of relationships between measures
P7. Existence of at least twenty collected data for measures that will be used in SPC P8. Existence of measures related to activities able to produce tangible items P9. Existence of measures related to critical processes
P10. Existence of measures related to all phases of projects process P11. Definition of measures with clear and known intended use P12. Existence of measures for project monitoring that can also
be used to describe process performance
P13. Existence of measures that can be normalized and existence of the measures required for normalization, in order to allow comparisons P14. Identification of homogeneous data groups
P15. Identification of the process or activity in which measures must be collected
Table 2 Measurement related factors that negatively influence
SPC implementation N1. Inconsistent measurements
N2. Data grouping containing data from projects that are not similar N3. Aggregate data that cannot be disaggregate
N4. Lost measurement data
N5. Deficient operational definition of measures N6. Insufficient amount of collected data
N7. Insufficiency or absence of measurement context information
N8. Insufficiency or absence of measures that describe process performance N9. Measures with inappropriate granularity level
N10. Insufficiency or absence of correlated measures N11. Measures not aligned to organizational or project goals N12. Measures incorrectly normalized
N13. Poorly structured measurement repository
N14. Data collection for a measure occurring in different moments in the projects, i.e., for each project, the same measure is collected in different moments
N15. Ambiguous measurement data
N16. Measurement data stored in different and not integrated sources N17. Data collected for a measure with different granularity levels N18. Measures related to too long processes (even if the granularity
level is suitable, the measurement collection frequency is low)
N19. Use of traditional control measures instead of process performance measures N20. Incorrect measurement data
commonly used by the software industry. Unfortunately, the vocabulary used by those standards, and, as a consequence, by the software organizations, is diverse. Many times, the same concept is designated by different terms in different proposals. Other times, the same term refers to different con-cepts. To deal with these problems, it is important to establish
a common conceptualization regarding the software mea-surement domain.
constructed with the sole objective of making the best pos-sible description of the domain in reality, with regard to a certain level of granularity and viewpoint [27]. A domain reference ontology is a special kind of conceptual model, representing a model of consensus within a community. It is a solution-independent specification, with the aim of mak-ing a clear and precise description of domain entities for the purposes of communication, learning and problem-solving. Ideally, a reference ontology should be built based on fun-damental ontological distinctions, given by a foundational ontology [7,28].
Thus, we looked for software measurement ontologies proposed in the literature. There are some initiatives com-mitted with ontology-based modeling and formalization of the software measurement domain, among them the ones pro-posed in [29,30]. However, as a rule, such initiatives are not committed to the use of a foundational ontology as their basis. Besides, they do not address measurement in high maturity aspects, which involve statistical process control.
For the reasons just mentioned, we developed a Refer-ence Software Measurement Ontology (RSMO), which is a domain reference ontology built based on the Unified Foun-dational Ontology (UFO) [7,8], on the vocabulary used in several standards (such as CMMI [4], ISO/IEC 15939 [10], PSM [11], and IEEE Std. 1061 [12]), on high maturity soft-ware measurement aspects, and on the results of the study based on a systematic review of literature presented in Sect. 3.
For developing the Reference Software Measurement Ontology (RSMO), we used SABiO (Systematic Approach for Building Ontologies) [9]. This method has been used for the last ten years in the development of a number of domain ontologies in areas ranging from Harbor Manage-ment to Software Process to the Electrocardiogram domain. SABiO prescribes an iterative process comprising the fol-lowing activities: (i)purpose identification and requirement specificationthat is concerned about clearly identifying the ontology purpose and its intended uses, i.e., the competence of the ontology by means of competency questions1; (ii) ontology capture, when relevant concepts, relations, proper-ties and constraints are identified and organized; (iii) ontol-ogy formalization, which comprises the definition of for-mal axioms in First-Order Logic; (iv)integration of existing ontologies, which involves searching for existing ontologies that can be reused; (v)ontology evaluation, for identifying inconsistencies as well as verifying the truthfulness with the ontology’s purpose; and (vi)ontology documentation.
1 Competency questions are the questions that the ontology must be
able to answer. The ontology must contain a necessary and sufficient set of concepts, relations, properties and axioms to represent and solve these questions [31].
Since the software measurement domain is strongly related to the domains of software processes and organi-zations, we reused the software process ontology described in [8] and the software organization ontology proposed in [13]. This ontology, however, was not developed grounded in a foundational ontology. Thus, we had to reengineer it before using it. The reengineered ontology was published in [14].
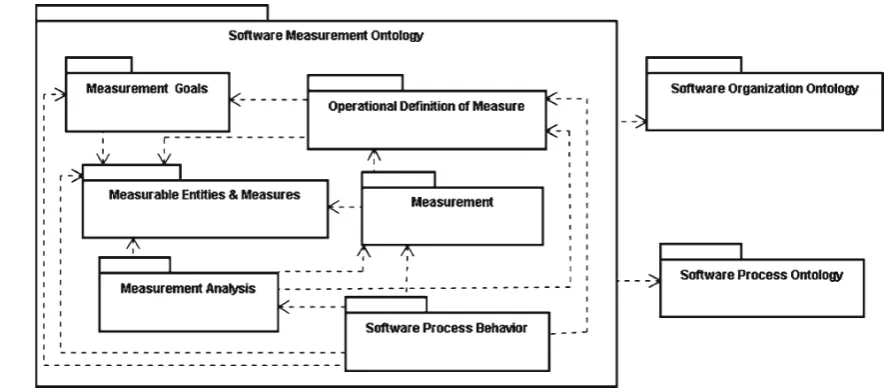
The RSMO is composed of six sub-ontologies: the Mea-surable Entities & Measuressub-ontology, which is the core of the RSMO, treating the entities that can be submitted to measurement, their properties that can be measured, and the measures used to measure them; theMeasurement Goals sub-ontology that deals with the alignment of measurement to organizational goals; theOperational Definition of Measures sub-ontology, which addresses the detailed definition of oper-ational aspects of measures, including data collection and analysis; theSoftware Measurementsub-ontology that refers to the measurement per se, i.e., collecting and storing data for measures; theMeasurement Analysissub-ontology, handling the analysis of the collected data for getting information to support decision making; and finally, theSoftware Process Behavior sub-ontology, which refers to applying measure-ment results in the analysis of the behavior of organizational software processes.
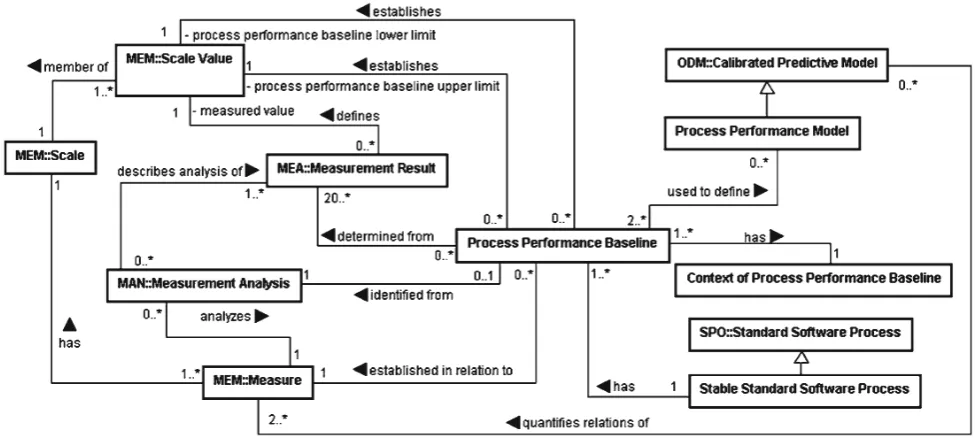
Figure2 shows the RSMO sub-ontologies and the inte-grated ontologies as UML packages, and their relationships as dependency relationships. In the figure, the dependency relationships indicate that concepts and relations from a sub-ontology/ontology are used by another.
For each one of the RSMO sub-ontologies we accom-plished the steps of SABiO. As a result, the RSMO ontol-ogy is made of: (i) sets of competency questions, describ-ing the sub-ontologies requirements specification; (ii) struc-tural conceptual models represented as UML class diagrams, capturing the concepts and relations of the sub-ontologies; (iii) a dictionary of terms, providing descriptions for each term in the ontology in natural language; and (iv) first order logic axioms, capturing constraints that are not captured by the conceptual models developed. Aiming to help organi-zations understand the RSMO conceptualization, even for those not very familiar with conceptual models and axioms, we also elaborated textual explanations about the concepts, relationships and axioms, including examples based on prac-tical measurement experiences.
Fig. 2 RSMO overview
Since RSMO is a reference ontology, we modeled it using a UML profile based on UFO. This profile commits to a much richer meta-ontology than the ones underlying lan-guages designed to maintain interesting computational prop-erties such as tractability and decidability, like OWL [27]. These computational properties are in general absent in more expressive languages, such as the UML profile we adopted and, thus, the evaluation of RSMO was made manually. For each competency question, we related the concepts, relations and axioms used to answer it, and, aiming at a minimum onto-logical commitment, we verified if the ontology has only the concepts, axioms and relations needed to answer the com-petency questions. Besides, in order to verify if RSMO is able to represent concrete situations of the real world, we instantiated it with real entities extracted from measurement repositories of organizations.
Next, some fragments of the RSMO sub-ontologies are presented. In each sub-ontology conceptual model, the con-cepts from other (sub-) ontologies are identified preceded by the following abbreviations: SOO—Software Organization Ontology; SPO—Software Process Ontology [8]; MEM— Measurable Entities & Measures sub-ontology; MGO— Measurement Goals Sub-ontology; ODM—Operational Definition of Measure Sub-ontology; MEA—Measurement Sub-ontology; MAN—Measurement Analysis Sub-ontology; and SPB—Software Process Behavior Sub-ontology. Aim-ing not to visually overload the diagrams, the stereotypes of the UFO-based UML profile we used are not shown. Also some specializations and relationships presented in a diagram are not shown in the subsequent diagrams. For the MEM sub-ontology, as an example, we present some of its competency questions and a fragment of its evaluation.
After each conceptual model, the concepts presented are described. In the text, the first occurrences of RSMO
con-cepts are shown in bold and instances of RSMO concepts are shown underlined.
It is worthwhile to point out that most of the concepts in RSMO have a correspondent in the standards and models that we used as a basis for developing the ontology. How-ever, some of them do not have a counterpart; they were included in RSMO due to ontological distinctions given by UFO or in order to generalize concepts established in the standards. Obviously, many times the terms used to desig-nate the concepts in RSMO are also distinct from the terms used in the standards and models, since the vocabulary used by these standards and models is diverse. Finally, the defi-nitions we gave for the RSMO concepts were based on the definitions given by the standards and models we used as the basis during ontology capture. However, they are not exactly the same. Sometimes, we combined different definitions from different standards and models, achieving a new definition; other times, we used the conceptualization underlying UFO to improve a definition given by a standard or model. Thus, although in general there is a correspondence between the concepts in RSMO and the terms adopted by the standards and models, their definitions are not exactly the same. Table 3shows a mapping between some RSMO concepts and the corresponding terms used by the standards and models. We prefer to follow this approach, since we do not want to com-mit to any particular standard or model. Moreover, acting in this way, we feel freer to use the RSMO to harmonize different standards and models.
4.1.1 The measurable entities and measures sub-ontology
Table 3 Mapping between RSMO concepts and standard’s terms
RSMO concept ISO/IEC 15939 PSM IEEE Std.1061 CMMI MR MPS
Measurable Entity Type – – – – –
Measurable Entity Entity Entity Entity – Entity
Measurable Element Attribute Attribute Attribute – Attribute
Directly Measurable Element – – – – –
Indirectly Measurable Element – – – – –
Measure Measure Measure Metric Measure Measure
Base Measure Base Measure Base Measure Direct Metric Base Measure Basic Measure Derived Measure Derived Measure Derived Measure Metric Derived Measure Derived Measure
Scale Scale Scale – Scale Scale
Scale Type Type of Scale Type of Scale – – –
Scale Value – – – – –
Measure Unit Unit of Measurement Unit of Measurement Unit of Measure Unit of Measure Unit of Measure Measure Calculation Formula Measurement Function Measurement Function – – Function
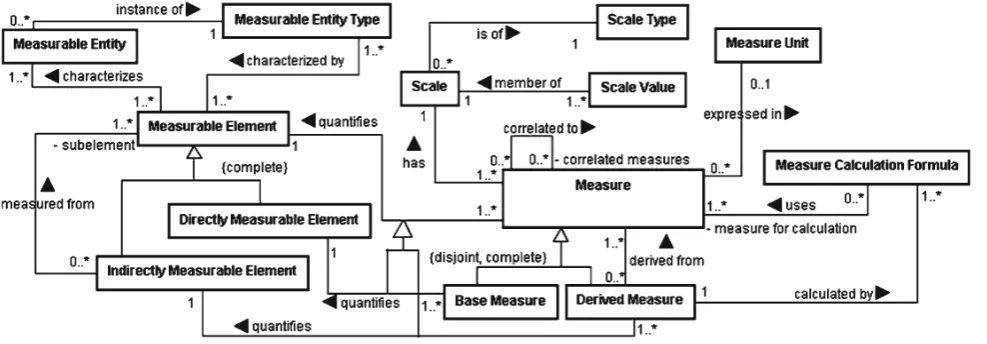
Fig. 3 Fragment of the Measurable Entities and Measures Sub-ontology
so on) that can be measured and the measures used to mea-sure them. Figure3 shows its conceptual model. Some of the competence questions this sub-ontology should be able to answer are:
CQ1. What is the type of a measurable entity?
CQ2. Which are the measurable elements that characterize all measurable entities of a same type?
CQ3. Which are the measurable elements of a measurable entity?
CQ4. Which measures can be used to quantify a measurable element?
AMeasurable Entityis anything that can be measured, such as a process, an artifact, a project and a resource [10– 12]. Measurable entities can be classified according to types
(Measurable Entity Type). For instance, process is a type of measurable entity.
Measurable Entities are characterized by Measurable Elements. A Measurable Element is a property of a Mea-surable Entity that can be distinguished, and, thus, measured [10–12]. Size and productivity are examples of measurable elements. Measurable Elements can be directly (e.g., size) or indirectly (e.g., productivity) measured.Indirectly Measur-able Elementsare measured by means of other measurable elements, said to be theirsub-elements.
Measurable Entities that are instance of the same Measur-able Entity Type are characterized by the same MeasurMeasur-able Elements. The axiom MEM-A1 captures this constraint.
Table 4 Example of ontology verification
Competency Question Concept A Relation Concept B Axioms
Which are the measurable elements of a measurable entity?
Measurable Entity Is instance of Measurable Entity Type MEM-A1 Measurable Entity Type Is characterized by Measurable Element
Table 5 Example of ontology
validation Concept Instance
Measurable Entity Type Standard Software Process
Measurable Entity Requirements Management Process of the organization Org Measurable Element Requirements stability
Measure Requirements changing ratio
A Measure is an instrument that allows associating Measurable ElementswithScale Valuesof aScale[7,10– 12]. For instance, the measure number of requirements can be used to associate a value to the measurable element size that characterizes the measurable entity type project. Thus, a Measure quantifies a Measurable Element and has a Scale composed by Scale Values. Moreover, a Scale is of aScale Type[10,11] (e.g., absolute, nominal).
A measure can be correlated to other measures, said itscorrelated measures, indicating, for instance, that they are related to the same goal, or that they have a cause-effect relationship [11]. Finally, Measures can be classified intoBase Measures, which are functionally independent of other measures (e.g., number of requirements) and used to quantify Directly Measurable Elements, andDerived Mea-sures(e.g., requirements changing rate, given by the ratio of the number of changed requirements to the number of requirements), which are defined as a function of other mea-sures and used to quantify Indirectly Measurable Elements [4,10,11].
A Measure can be expressed in a Measure Unit [4], [10–12] (e.g., hours, function points). Derived Measures are calculated byMeasure Calculation Formulas, which, in turn, use other measures as measures for calculation [10,11].
As said before, the RSMO concepts were obtained by ana-lyzing terms used in several proposals, standards and models that address software measurement. Table3presents, as an example, the mapping between the concepts shown in Fig.2 and the terms used in some standards/models. It is important to point out that some of the RSMO concepts are not present in any standard/model. They were included in RSMO aim-ing to better represent the conceptualization of the software measurement domain. The use of a foundational ontology (UFO) as a basis for developing RSMO helped us to identify several of these concepts, by means of disambiguating con-cepts when they were analyzed in the light of UFO. Some
discussions regarding how UFO helped us to develop our RSMO can be found in [15–17].
During the development of the RSMO, several constraints were identified and, since the conceptual models are not capa-ble of capturing several of them, we defined axioms to make them explicit. As said in Sect.1, these axioms are not the focus of this paper, and, thus, only some of them are pre-sented, such as the axiom MEM-A1, previously presented. For details, see [15–17]. Moreover, as also discussed in Sect. 1, we performed activities for verifying and validating the ontology, which are not the focus of this paper yet. In order to illustrate how we performed these activities, Tables3and 4show examples regarding ontology verification and valida-tion. For more details, see [15–17].
The RSMO evaluation started with a verification activity, where we checked if the concepts, relations and axioms were able to answer the competency questions. Table 4shows a small fragment of the table used for verifying the MEM sub-ontology, considering the competency question CQ3.
For validating the ontology, we instantiated the RSMO concepts with real elements extracted from measurement repositories of organizations, in order to check if the ontol-ogy was able to represent concrete situations of the real world. Table 5shows part of an instantiation of the MEM sub-ontology.
4.1.2 The measurement goals sub-ontology
Measurement should be aligned to organizational goals in order to produce useful data for decision-making, goals monitoring, activities management and process performance analysis. The Measurement Goals sub-ontology addresses concepts, relationships and constraints related to the align-ment between measurealign-ment and goals. Figure 4 shows its conceptual model.
propo-Fig. 4 Fragment of the Measurement Goals Sub-ontology
sitional content of an Intention [7]. In the context of software measurement, a goal can be a Business Goal, a Software Goal or a Measurement Goal. ABusiness Goalexpresses the intention for which strategic actions are planned and performed (e.g., increase 10% the number of clients) [4,7, 22]. A Software Goal expresses the intention for which actions related to the software area are planned and per-formed (e.g., achieve the CMMI level 4). AMeasurement Goal expresses the intention for which actions related to software measurement are planned and performed (e.g., stabilize the behavior of the critical processes) [4,32]. Soft-ware and measurement goals are defined based on business goals. Measurement goals can also be defined from software goals. A Measurement Goal can be aProject Monitoring and Control Measurement Goal(e.g., improve the adherence to projects plans), a Quality Measurement Goal (e.g., reduce the number of delivered defects) or a Performance Measurement Goal(e.g., stabilize the behavior of the critical processes) [4].
Concerning goals, we should state that if a measurement goalmgis defined based on the software goalsgandsgis defined based on the business goalbg, thenmgis also defined based onbg.
MGO-A1: (∀ mg Measurement Goal, sg Software Goal, bg Business Goal) (isDefinedBasedOn (mg, sg) ∧ isDefinedBasedOn (sg, bg) → isDefinedBasedOn (mg, bg))
Information Needsare identified from goals and they are satisfied by Measures . For instance, the measurement goal improve the adherence to projects plans could identify the information need know the requirements stability after their approval by the client, which could be satisfied by the mea-sure requirements changing rate [4,10–12].
Measures can be used to indicate the achievement of goals. In this case, the measure fulfills the role of an Indicator [10,11]. Considering the example cited above, if the mea-sure requirements changing rate is used for monitoring the achievement of the goal improve the adherence to projects plans, then, in this context, it is an indicator. Thus, the fol-lowing constraint holds: if a measuremis an indicator of the
achievement of the goalg,then there should exist an infor-mation needin,identified from the goalg,which is satisfied bym.
MGO-A2: (∀m Indicator, gGoal) (indicatesAchieve-mentOf(m,g)→(∃inInformation Need) (identifies(g,in)∧ (satisfies(m, in))
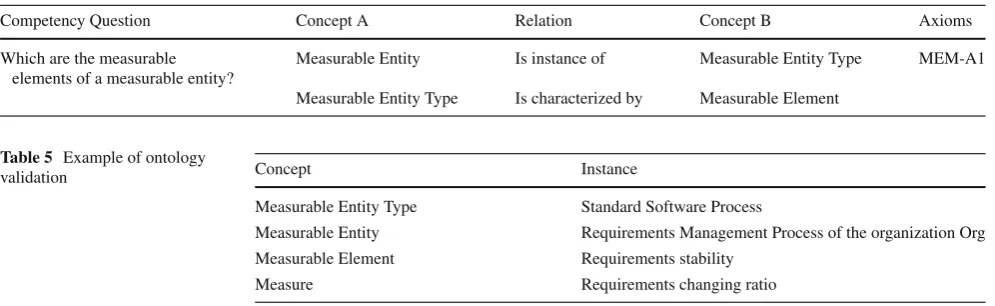
4.1.3 The operational definition of measures sub-ontology
An operational definition of measure regards defining in details how a measure must be collected and analyzed accord-ing to its intended use. For instance, measures used at high maturity levels for analyzing process performance must apply statistical process control techniques. Thus, their oper-ational definitions should include such techniques as proce-dures for analyzing collected data. This is not the case for measures used at initial maturity levels, where their intended use is to support traditional project monitoring and control.
Measurement repeatability is related to the accuracy and completeness of the operational definitions applied. If an operational definition of measure is imprecise, ambiguous or poorly documented, probably different people will under-stand the measure in different ways. As a consequence, it is likely that they collect invalid data, perform incomparable measurements or incorrect analysis, making the measure-ment inconsistent and inefficient [33].
Fig. 5 Fragment of the Operational Definition of Measure Sub-ontology
AnOperational Definition of Measuredetails aspects related to the data collection and analysis of a Measure in an Organization [4,10,11]. An Organization establishes Oper-ational Definitions of Measure taking Measurement Goals into account. For instance, measures related to process per-formance analysis goals are used to describe the processes behavior and, as such, must have operational definitions suit-able for it.
Regarding data collection, an Operational Definition of Measure should indicate:(i)the moment when measurement should occur. In order to integrate the measurement process with the software process, themeasurement momentshould be established in terms of the activity (Standard Activity) of the standard software process during which measurement should occur (e.g., Requirements Specification Approval); (ii) the measurement periodicity, that is, the frequency with which measurement should be performed (e.g. monthly, weekly, in each occurrence of the activity designated as measurement moment);(iii)the human role (Human Role) responsible for performing the measurement (responsible for measurement) (e.g., requirement engineer); and(iv)the Measurement Procedureto be followed in order to guide data collection [4,10–12].
Analogously, regarding measurement analysis, an Oper-ational Definition of Measure may indicate: the activity when the data collected for the measure should be ana-lyzed (measurement analysis moment), themeasurement analysis periodicity, the human role responsible for analyz-ing the collected data (responsible for measurement analy-sis), and theMeasurement Analysis Procedureto be fol-lowed in order to guide data analysis [4,10–12]. Information regarding measurement analysis is not defined in every
Oper-ational Definition of Measure, since there are some measures that are not analyzed separately. For instance, the measure project size could be used just to normalize other measures, not being necessary to analyze its data separately. In this case, the operational definition of the measure project size would not include information about measurement analysis.
Measurement ProceduresandMeasurement Analysis Proceduresare procedures to be followed in order to guide data collection and analysis, respectively [4,10–12]. A Mea-surement Procedure can includeMeasure Calculation For-mulas. In turn, Measurement Analysis Procedures can sug-gest the use of Analytical Methods for representing and analyzing the measured values [4,10,11]. Histograms and bar charts are examples of analytical methods. Analytical methods that use principles of statistical control to represent and analyze values and are said to be Statistical Control Methods[22]. The XmR and mXmR charts [22] are exam-ples of statistical control methods. At high maturity levels, measurement analysis procedures should indicate the use of statistical control methods.
Fig. 6 Fragment of the Measurement Sub-ontology
data collected in a particular organization and according to certain operational definitions of measures. For instance, an organization could use data collected through projects for establishing a calibrated predictive model that aim to predict project effort based on their size and complexity .
A calibrated predictive model must quantify the relation-ship existing between at least two measures. Since calibrated predictive models should be established from a consistent group of data, these data should be collected using the same operational definition of measure. Therefore, a calibrated predictive model must be based on one specific operational definition of measure for each measure used to establish the calibrated predictive model.
4.1.4 The measurement sub-ontology
This sub-ontology addresses measurement per se, i.e., col-lecting and storing data for the measures. Its conceptual model is shown in the Fig.6.
Measurementis an action performed to measure a surable Element of a Measurable Entity by applying a Mea-sure [4,10–12]. As a result, a Measurement Result is obtained, which defines ameasured value[4,10–12]. The measured value must be a Scale Value of the Scale of the
applied measure. For instance, the measurement of the mea-surable element changed requirements of the meamea-surable entity Requirements Specification Document by applying the measure number of changed requirements could obtain a measurement result, which defines as measured value of the value 12.
Since a Measurement measures a Measurable Element and applies a Measure, this Measure must quantify that able Element. Besides, if a Measurement measures a Measur-able Entity that is an instance of a MeasurMeasur-able Entity Type, it can only measure Measurable Elements that characterize that Measurable Entity Type.
A Measurement has aMeasurement Contextthat describes the circumstances in which the measurement occurred [4]. The measurement context is useful to group data or exclude values for measurement analysis, as well as to understand variations among values being analyzed. Regarding the example cited before, a possible measurement context could be: measurement carried out after changes in the legislation in which the system is based on.
Fig. 7 Fragment of the Measurement Analysis Sub-ontology
says that if a measurementmeauses an operational defini-tion of measureodmand applies a measurem, thenodmmust refer tom.
MEA-A1: (∀ mea Measurement, odm Operational Definition of Measure, m Measure) (uses (mea, odm) ∧ applies(mea, m)) → refersTo(odm,m)
A Measurement is performed by a Human Resource, called the measurement executor, and it adopts a Mea-surement Procedure[4,10–12]. Furthermore, a Measure-ment occurs during the occurrence of another activity (Activity Occurrence) (e.g., an occurrence of the activ-ity Requirements Specification Approval) said to be the actual measurement moment.This activity occurrence is caused by a Project Activity (e.g., the activity Requirements Specification Approval defined to the project P) that tai-lors a Standard Activity (e.g., the activity Requirements Specification Approval defined in the Requirements Man-agement standard process) (see [8]). Since an operational definition of measure is used to guide measurement, this Standard Activity has to be the one indicated as the mea-surement moment by the Operational Definition of Measure. Moreover, themeasurement executormust play the Human Role indicated as responsible for measurement, and the measurement procedure adopted must be the same indicated by the operational definition of measure.
4.1.5 The measurement analysis sub-ontology
This sub-ontology treats the analysis of the collected data. Its conceptual model is shown in the Fig.7.
AMeasurement Analysisis an action performed to ana-lyze values measured for a Measure characterizing the Mea-surable Entity measured [4,10–12]. The values to be analyzed are described in Measurement Results, produced by Mea-surements. As a result, a Measurement Analysis produces a
Measurement Analysis Result [4,10–12]. An example of Measurement Analysis is the analysis of values measured for the measure requirements changing rate in order to char-acterize the measurable entity Requirements Management Process in the project P.
The Operational Definition of Measure used in a ment Analysis must be the same one used in the Measure-ments that produced the Measurement Results being ana-lyzed. The axiom MAN-A1 addresses this constraint by say-ing that if a measurement analysismanuses the operational definition of measureodmfor describing the analysis of the measurement resultmrproduced by the measurementmea, thenmeashould have usedodm.
MAN-A1: (∀manMeasurement Analysis,odm Oper-ational Definition of Measure, mr Measurement Result, mea Measurement) (uses(man, odm) ∧ describesAnaly-sisOf(man,mr)∧produces(mea, mr))→uses(mea,odm)
Besides, the Measurable Entity characterized by a Mea-surement Analysis must be the same Measurable Entity mea-sured by the Measurements that produced the Measurement Results being analyzed. The axiom MAN-A2 addresses this constraint by stating that if a measurement analysisman char-acterizes the measurable entitymetand describes the analysis of the measurement resultmrproduced by the measurement mea, thenmeashould measuremet.
measure-Fig. 8 Fragment I of the Software Process Behavior Sub-ontology
ment analysis. Although not shown in Fig.7, in a very similar way than in the case of the Measurement sub-ontology (Sect. 4.1.4), a Measurement Analysis is carried out by a Human Resource, said to bemeasurement analysis executor, in an Activity Occurrence said to beactual measurement analy-sis moment.As argued before with respect to Measurement, ideally, in a Measurement Analysis, the actual measurement analysis moment must be an Activity Occurrence caused by a Project Activity that tailors a Standard Activity indicated as the measurement analysis moment by the Operational Defini-tion of Measure. Moreover, the measurement analysis execu-tor must play the Human Role indicated as responsible for measurement analysis.
4.1.6 The software process behavior sub-ontology
Data are collected for measures, and they are analyzed aim-ing to provide information that support decision-makaim-ing. At high maturity levels, information is applied for analyzing the software process behavior. The Software Process Behavior Sub-ontology deals with concepts, relations and constraints involved in software process behavior analysis. A fragment of its conceptual model is shown in the Fig.8.
In a Measurement Analysis that adopts a Statistical Con-trol Method, it is possible to identify aProcess Performance Baseline, established in relation to a Measure for aStable Standard Software Process[4,22].
According to the Software Process Ontology [8], a Stan-dard Software Process refers to a generic process defined by an organization, establishing basic requirements for processes to be performed in that organization. A Stable
Standard Software Processis a Standard Software Process with stable behavior. In other words, it is a Standard Software Process that has at least one Process Performance Baseline. A Process Performance Baseline is identified from twenty or more Measurement Results [4,22]. It is the range of results achieved by a Stable Standard Software Process,obtained from measured values of a particular Mea-sure. This range is used as a reference for process perfor-mance analysis and it is defined by two limits:process per-formance baseline upper limitandprocess performance baseline lower limit[22]. The values of the limits are Scale Values of the Scale of the Measure considered for establish-ing the baseline. This constraint is addressed by an axiom (SPB-A1), which says that if a scale valuesvis a lower limit or an upper limit of a process performance baselineppb estab-lished in relation to the measuremthat has as scales, then svshould be a value of the scales.
SPB-A1: (∀ sv Scale Value, ppb Process Perfor-mance Baseline, m Measure, s Scale) ((processPerfor-manceBaselineLowerLimit(sv, ppb)∨ processPerformance-BaselineUpperLimit(sv, ppb)) ∧ isEstablishedInRelationTo (ppb, m) ∧ has(m, s) → memberOf(sv, s))
Fig. 9 Fragment II of the Software Process Behavior Sub-ontology 0,1 and 0.25, respectively. Thus, in this context, the Require-ments Management standard software process is considered a stable standard software process.
A Process Performance Baseline is established in a par-ticular context (Context of Process Performance Baseline). In the previous example, we could have the following situ-ation for the first process performance baseline established to the Requirements Management standard software process: the data used to establish the baseline were collected in six small projects developed by the same team, under usual conditions. In the analysis, two points collected on exceptio-nal situations were excluded.
Process Performance Baselines are used to defineProcess Performance Models[4]. A Process Performance Model is a specific type of Calibrated Predictive Model that uses Process Performance Baselines (at least 2) to establish and quantify the relations between Measures. The Process Per-formance Baselines used by a Process PerPer-formance Model must be defined in relation to the measures whose relations are quantified by that Process Performance Model.
Figure9shows another fragment of the conceptual model of the Software Process Behavior Sub-ontology.
ASpecified Process Performance is the range of val-ues that describes the desired results of a Standard
Soft-ware Process, considering a particular Measure. A Speci-fied Process Performance is defined by two limits: spec-ified process performance upper limit and specified process performance lower limit [22]. As well as base-line limits, the specified process performance limits are values of the Scale of the Measure used for defining the Specified Process Performance. Returning to the previous example, consider the Requirements Management standard process of the organization Org. It could have a speci-fied process performance defined in relation to the measure requirements changing rate, given by the upper and lower limits 0 and 0.25, respectively.
Table 6 Requirements for a measure to be used in SPC
R1. The measure must be aligned to organizational or project goals R2. The measure must be able to support decision making
R3. The measure must be able to support software process improvement R4. The measure must be associated to a critical process
R5. The measure must be able to describe the process performance R6. The measure must have appropriate granularity level
R7. The operational definition of the measure must be correct and satisfactory R8. The correlated measures to the measure must be defined
R9. The measure must be correctly normalized (if applicable) R10. It must be possible to normalize the measure (if applicable)
R11. The criteria for grouping data to the measure analysis must be defined R12. The measurement data related to the measure must include context information R13. The measurement data related to the measure must be accessible and retrievable
R14. The measure must be related to the process or activity in which the measurement is carried out R15. The measure should not consider aggregated data
R16. It must be possible to identify the process definition in which data were collected for the measure R17. The collected data for the measure must be consistent
R18. The collected data for the measure must be precise
R19. There is no lost data for the measure or the amount of lost data does not compromise the analysis R20. The amount of collected data is sufficient
PCDP-01: calculate the process capability index using the calculation formula Cp = (ULb−LLb)/(ULs−LLs), where Cp = process capability index, ULb = processperfor-mance baseline upper limit, LLb = process perforprocessperfor-mance baseline lower limit, ULs = specified process performance upper limit and LLs = specified process performance lower limit. If Cp is≤1, verify if the process performance baseline limits are within the specified process performance limits. In the affirmative case, the process is capable. Otherwise, the process is not capable.
When the Process Capability revels that the process is capable of achieving the expected performance, we have a Capable Standard Software Process[4,22]. Regarding the examples cited before, consider applying the process capa-bility determination procedure PCDP-01 to the Requirement Management standard process of the organization Org. As a result, we obtained a capability index 0.6. Besides, consider that the process performance baseline limits are within the specified process performance limits. So, this Requirement Management standard process is a Capable Standard Process with respect to the measure requirements changing rate.
4.2 The instrument for evaluating the suitability of a measurement repository for SPC
The IESMR development started after the study based on a literature systematic review described in Sect.3. Based on the measurement related factors that impact SPC implementation
identified in the study, we defined a set of requirements for a measure to be used in SPC. These requirements are presented in Table6.
Based on these requirements, we created the first version of the IESMR, which was composed of one checklist used to evaluate a measure and its data. This version was used to evaluate measurement repositories of two organizations in order to verify if the identified requirements were correct. For this, we asked if a measure that fulfilled the requirements of IESMR could really be used in SPC and if a measure that did not fulfill the requirements was really unsuitable for SPC. To answer these questions, we plotted in control charts the data collected for the measures evaluated. As a result, we observed that the measures considered suitable for SPC according to IESMR could be correctly plotted in con-trol charts and they provided useful information about the processes performance. By contrast, the measures consid-ered unsuitable by IESMR could not be plotted in control charts or, when they could, they did not describe the process performance.
Fig. 10 Overview of the IESMR
Table 7 Measurement Plan Checklist
Requirements Evaluation
1. The Organizational Measurement Plan is aligned to the organizational goals S LS RS PS D NE 1.1 The organizational business goals relevant to measurement are recorded
in the Measurement Plan
S LS RS PS D NE
1.2 The measurement goals are recorded in the Measurement Plan and they are correctly associated to organizational business goals
S LS RS PS D NE
1.3 The information needs for monitoring measurement goals are identified S LS RS PS D NE 1.4 The measures able to attend the information needs for monitoring measurement
goals are identified and properly associated
S LS RS PS D NE
requirement and the possible corrective actions to be taken when a requirement is not fulfilled. The second version of IESMR was used to evaluate the measurement repository of a third organization. After that, we carried out some minor adjustments in IESMR, basically related to its wording, aim-ing to improve its understandaim-ing. Finally, for determinaim-ing the suitability degree of a measurement repository for SPC in percentage, we added some principles of Fuzzy Logic, getting the current version of it, whose overview is shown in Fig.10.
In IESMR, each item is evaluated by a set of requirements present in checklists. The evaluation of an item against each requirement can produce one of the following results:(i) Sat-isfied,which means that the item satisfies totally the require-ment and no corrective action is necessary;(ii) Largely Sat-isfied, Reasonably Satisfied or Precariously SatSat-isfied,which means that the item does not completely satisfy the require-ment, but it is possible to take actions to adapt it in order to satisfy the requirement and, consequently, to allow the use of the evaluated item in SPC. The level of satisfaction (largely, reasonably or precariously) is related to the effort required to perform the actions (the more effort is necessary,
the less the satisfaction level will be); and(iii) Dissatisfied, meaning that the item does not satisfy the requirement and there are no possible actions to adapt it for being used in SPC.
When the result of the evaluation of a requirement is Largely Satisfied,Reasonably SatisfiedorPrecariously Sat-isfied,Actions for Suitability are suggested. These actions are guidelines for correcting the item so that it can be used in SPC. When the result isDissatisfied,recommendations of the Body of Recommendations for Software Measurement can be used to rebuild the item (BRSM is presented in the next section).
The results of the evaluation are recorded in a document calledEvaluation Diagnosis. It includes the detailed evalua-tion of each item (filled checklists and comments), the acevalua-tions for suitability suggested, and the degree of suitability of the measurement repository for SPC, which is informed as a per-centage. As said before it is calculated using Fuzzy Logic (see [19]).
Table 8 Measurement Repository Structure Checklist
Requirements Evaluation
1. The measurement repository is well structured and allows measures to be integrated to processes and activities of the organization
S LS RS PS D NE
1.1 The measurement repository structure allows the defined measures to be related to processes and activities of the organization in which the measurement must be carried out
S LS RS PS D NE
1.2 The measurement repository is unique or it is composed by several correctly integrated sources
S LS RS PS D NE
2. The projects are satisfactorily characterized S LS RS PS D NE
3. A mechanism for identifying similarity between projects is established S LS RS PS D NE 4. It is possible to identify the version of the processes executed in the projects S LS RS PS D NE 5. It is possible to store and to retrieve the context information of the collected measures S LS RS PS D NE For each collected measure, it is possible to store and to retrieve:
5.1 Measurement moment (date, process and activity in which the measurement was carried out)
S LS RS PS D NE
5.2 Measurement conditions (relevant information about the execution of the process, the environment or the project at the moment of the measure collection)
S LS RS PS D NE
5.3 Performer of the measurement S LS RS PS D NE
5.4 Project in which the measure was collected S LS RS PS D NE
5.5 Characteristics of the project in which the measure was collected S LS RS PS D NE
only once during an evaluation of a measurement reposi-tory. Checklists to evaluate the measures (Table9) and the collected data (Table10) must be applied once for each mea-sure evaluated. The possible answers for a requirement in a checklist are: S = Satisfied; LS = Largely Satisfied; RS = Reasonable Satisfied; PS = Precariously Satisfied; D = Dis-satisfied; NE = It could not be evaluated.
It is important to point out that, according to the approach for software process improvement at high maturity levels, only processes that are critical to the organizational goals must be submitted to SPC. So, it is desirable that the orga-nization identifies these processes before carrying out the evaluation, in order to avoid evaluating measures that are not related to these processes.
As shown in the previous tables, most of the requirements of the IESMR can produce one of the following results: Sat-isfied,Largely Satisfied, Reasonably Satisfied, Precariously SatisfiedorDissatisfied.Only a few ones (requirements 3 to 6 in Table9, and requirement 2 in Table10) have as possi-ble resultsSatisfiedorDissatisfied. In these cases, there is no possibility of partially fulfill the corresponding require-ment, since there are no possible actions for correcting it. For example, the requirement “The measure is related to the per-formance of a process” (requirement 5 of Table9) is satisfied or not. If a measure is not able to describe the performance of a process, there is nothing that can be done to use it in the SPC.
In order to guide the evaluation, for each requirement, we provided a description of what a possible answer means. For instance, concerning the requirement “The projects are
satisfactorily characterized” (requirement 2 of Table8), the following descriptions are provided:
• Satisfied: The project characterization is explicit. That is, there is a characterization schema formally defined and implemented in the measurement repository struc-ture, taking into account the basis on relevant criteria that enable the organization to identify the profiles of projects that it develops. The subsets composed by projects with the same profile (that is, projects of which criteria of char-acterization have the same values) are homogeneous.
• Largely Satisfied: The project characterization is explicit, but it requires some additional criteria. These criteria can be identified from data of projects stored in the measure-ment repository, interviews with projects members and projects documents.
• Reasonably Satisfied: The project characterization is explicit, but it requires many additional criteria. These criteria can be identified from data of projects stored in the measurement repository, interviews with projects mem-bers and projects documents.
• Precariously Satisfied: The project characterization is implicit. That is, there is no formal characterization to the projects, but it is possible to identify a characterization by analyzing data of projects stored in the measurement repository, carrying out interviews with projects mem-bers and analyzing projects documents.
Table 9 Measures Checklist
Requirements Evaluation
Item: Measures Measure Evaluated:________________
1. The operational definition of the measure is correct and satisfactory S LS RS PS D NE The operational definition of the measure correctly includes:
1.1 Measure Definition S LS RS PS D NE
1.2 Measured Entity S LS RS PS D NE
1.3 Measured Element S LS RS PS D NE
1.4 Measure Unity S LS RS PS D NE
1.5 Scale Type S LS RS PS D NE
1.6 Scale Values S LS RS PS D NE
1.7 Expected Interval for the Data S LS RS PS D NE
1.8 Formula(s) (if applicable) S LS RS PS D NE
1.9 Precise Description of the Measurement Procedure S LS RS PS D NE
1.10 Responsible for the Measurement S LS RS PS D NE
1.11 Measurement Moment S LS RS PS D NE
1.12 Measurement Periodicity S LS RS PS D NE
1.13 Precise Description of the Measurement Analysis Procedure (if necessary) S LS RS PS D NE
1.14 Responsible for the Measurement Analysis (if necessary) S LS RS PS D NE
1.15 Measurement Analysis Moment (if necessary) S LS RS PS D NE
1.16 Measurement Analysis Periodicity (if necessary) S LS RS PS D NE
2. The measure is aligned to the projects goals and/or organization goals S LS RS PS D NE The measure is associated to:
2.1 Organizational goals S LS RS PS D NE
2.2 Project goals S LS RS PS D NE
3. The results of the measure analysis are relevant for making decisions S D NE 4. The results of the measure analysis are useful to process improvement S D NE 5. The measure is related to the performance of a process (directly or indirectly) S D NE 6. The measure is related to a critical process (directly or indirectly) S D NE
7. The correlated measures are defined S LS RS PS D NE
8. The correlated measures are valid S LS RS PS D NE
9. The measure has appropriate granularity level S LS RS PS D NE
10. It is possible to normalize the measure (if applicable) S LS RS PS D NE
11. The measure is correctly normalized (if applicable) S LS RS PS D NE
12. The data grouping criteria for the measure analysis are defined S LS RS PS D NE
13. The measure does not consider aggregated data S LS RS PS D NE
data of projects stored in measurement repository, carry-ing out interviews with projects members or analyzcarry-ing projects documents.
As said before, if the result of the evaluation of a require-ment isLargely Satisfied, Reasonably Satisfied or Precari-ously Satisfied,actions for suitability are suggested, aiming to support the organization to change the evaluated item to ful-fill the requirement. So, for each requirement, we identified potential problems and actions for suitability. For instance, to the requirement 2 of Table8, the following potential prob-lems and actions for suitability were identified:
• Problem I: The projects have an implicit characterization in the measurement repository.
![Fig. 1 Process behavior analysis (adapted from [22])](https://thumb-us.123doks.com/thumbv2/123dok_us/861722.1583693/4.595.82.515.57.324/fig-process-behavior-analysis-adapted-from.webp)